Schematic overview of the cellular and molecular mechanisms involved in the cancer progression, including the proposed cellular and molecular mechanisms in cancer cells trajectory. AT1: alveolar type 1 cells; AT2: alveolar type 2 cells; AAH: atypical adenomatous hyperplasia; AIS: adenocarcinoma in situ; MIA: minimally invasive adenocarcinoma; IA: invasive adenocarcinoma; EMT: epithelial-mesenchymal transition

Home

Download

Statistics

Help

Contact

Center for Computational Systems Medicine
leaf

Gene summary

leaf

Malignant transformation analysis

leaf

Malignant transformation related pathway analysis

leaf

Cell-cell communication analysis

leaf

Single-cell gene regulatory network inference analysis

leaf

Somatic mutation of malignant transformation related genes

leaf

Related drugs of malignant transformation related genes

Gene: STOML2

Gene summary for STOML2

check button Gene summary.

Gene informationSpeciesHuman
Gene symbol

STOML2

Gene ID

30968

Gene namestomatin like 2
Gene AliasHSPC108
Cytomap9p13.3
Gene Typeprotein-coding
GO ID

GO:0001775

UniProtAcc

Q9UJZ1


Top

Malignant transformation analysis

check button Identification of the aberrant gene expression in precancerous and cancerous lesions by comparing the gene expression of stem-like cells in diseased tissues with normal stem cells
check button Malignant transformation involving gene list.
Entrez IDSymbolReplicatesSpeciesOrganTissueAdj P-valueLog2FCMalignancy
30968STOML2P65T-EHumanEsophagusESCC9.27e-217.59e-010.0978
30968STOML2P74T-EHumanEsophagusESCC3.74e-441.87e+000.1479
30968STOML2P75T-EHumanEsophagusESCC4.67e-862.25e+000.1125
30968STOML2P76T-EHumanEsophagusESCC1.60e-721.40e+000.1207
30968STOML2P79T-EHumanEsophagusESCC1.17e-501.18e+000.1154
30968STOML2P80T-EHumanEsophagusESCC1.04e-482.15e+000.155
30968STOML2P82T-EHumanEsophagusESCC3.93e-141.31e+000.1072
30968STOML2P83T-EHumanEsophagusESCC7.04e-692.64e+000.1738
30968STOML2P84T-EHumanEsophagusESCC2.02e-048.12e-010.0933
30968STOML2P89T-EHumanEsophagusESCC3.77e-262.56e+000.1752
30968STOML2P91T-EHumanEsophagusESCC5.62e-212.93e+000.1828
30968STOML2P94T-EHumanEsophagusESCC1.27e-021.32e+000.0879
30968STOML2P107T-EHumanEsophagusESCC3.42e-601.77e+000.171
30968STOML2P126T-EHumanEsophagusESCC4.32e-121.51e+000.1125
30968STOML2P127T-EHumanEsophagusESCC7.60e-255.53e-010.0826
30968STOML2P128T-EHumanEsophagusESCC8.28e-531.94e+000.1241
30968STOML2P130T-EHumanEsophagusESCC5.24e-1163.30e+000.1676
30968STOML2S43HumanLiverCirrhotic9.61e-08-2.70e-01-0.0187
30968STOML2HCC1_MengHumanLiverHCC9.46e-754.71e-010.0246
30968STOML2HCC2_MengHumanLiverHCC7.31e-33-7.80e-020.0107
Page: 1 2 3 4 5 6 7 8 9 10 11 

check button Transcriptomic changes along malignancy continuum.
TissueExpression DynamicsAbbreviation
BreastThe image shows the transcriptomic changes along malignancy continuum.log2FC in expression of this searched gene in stem-like cells from each diseased tissue sample relative to stem-like cells in normal samples in each tissue plotted against the malignancy continuum. Samples are colored based on if they are from different disease stage.
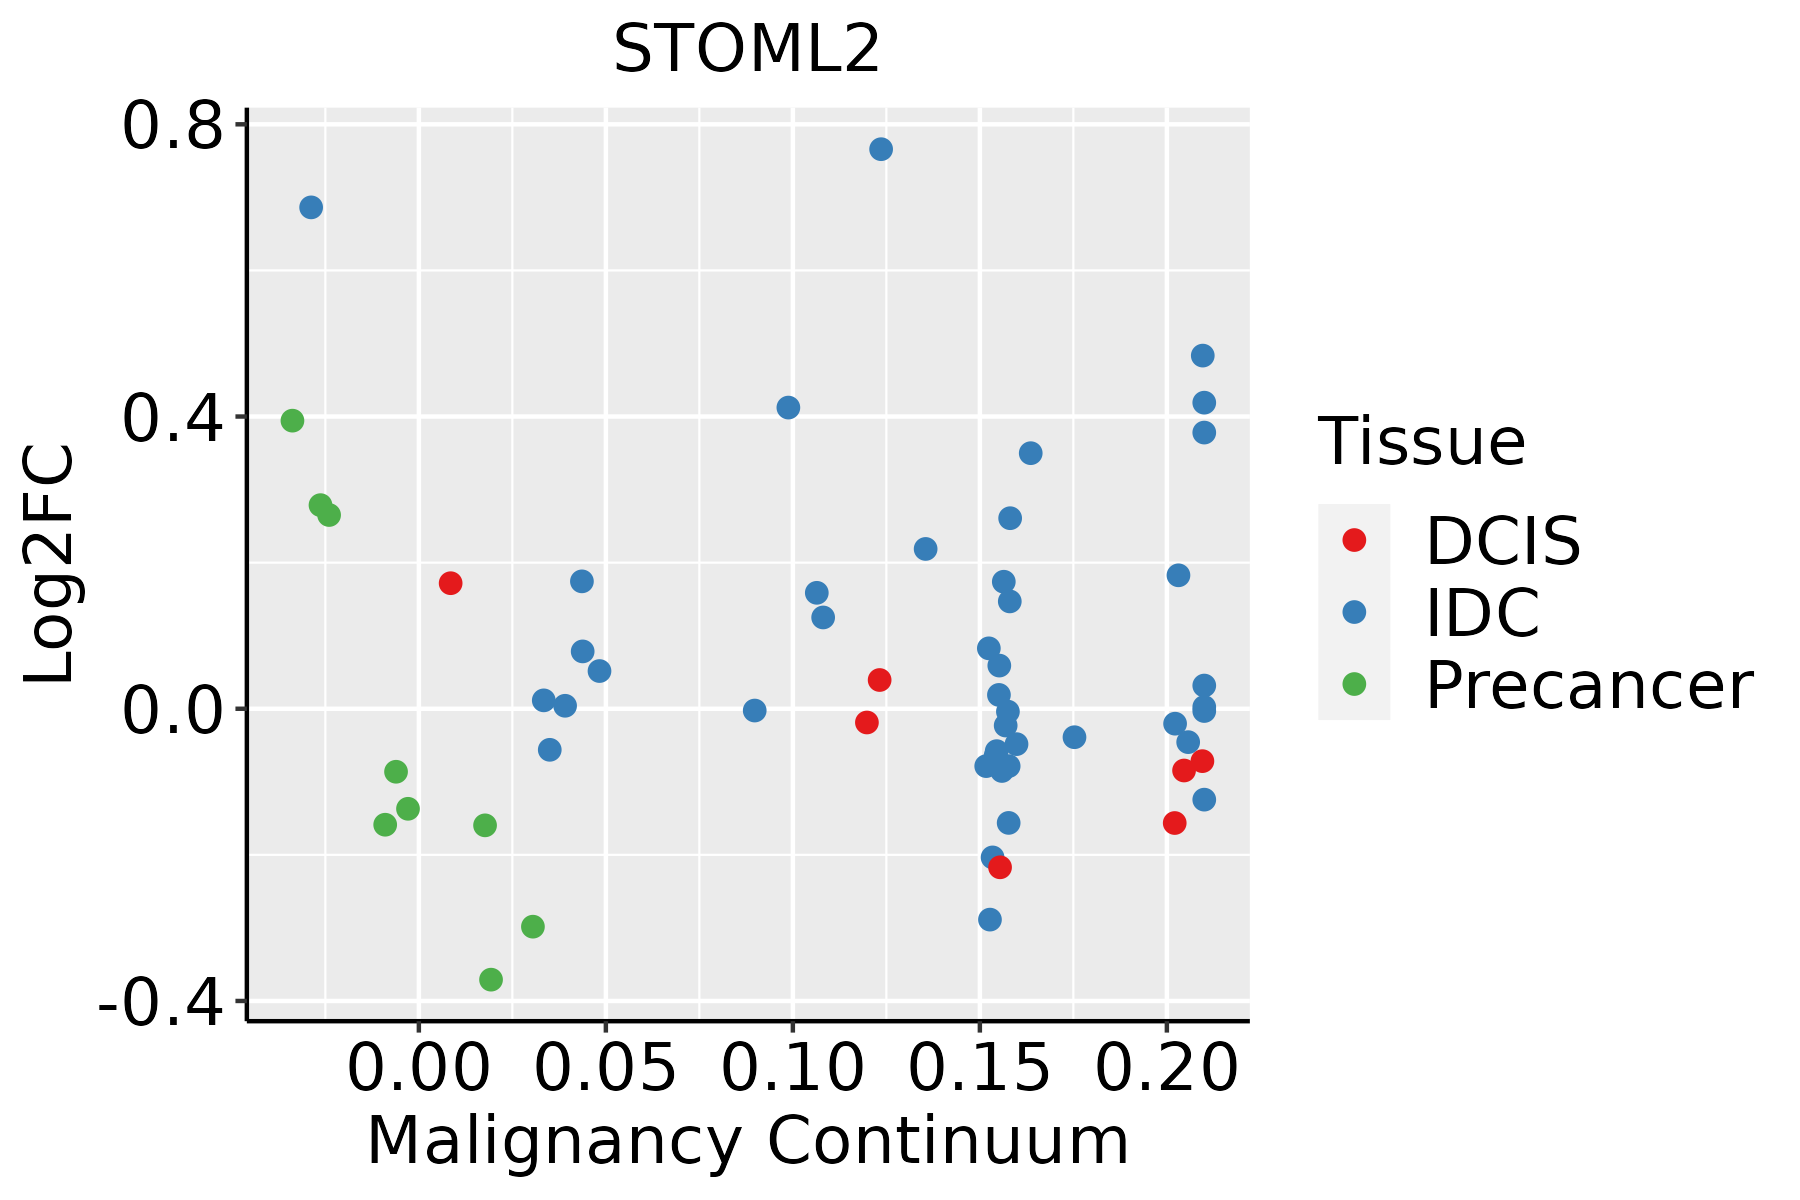
IDC: Invasive ductal carcinoma
DCIS: Ductal carcinoma in situ
Precancer(BRCA1-mut): Precancerous lesion from BRCA1 mutation carriers
Colorectum (GSE201348)The image shows the transcriptomic changes along malignancy continuum.log2FC in expression of this searched gene in stem-like cells from each diseased tissue sample relative to stem-like cells in normal samples in each tissue plotted against the malignancy continuum. Samples are colored based on if they are from different disease stage.FAP: Familial adenomatous polyposis
CRC: Colorectal cancer
Colorectum (HTA11)The image shows the transcriptomic changes along malignancy continuum.log2FC in expression of this searched gene in stem-like cells from each diseased tissue sample relative to stem-like cells in normal samples in each tissue plotted against the malignancy continuum. Samples are colored based on if they are from different disease stage.AD: Adenomas
SER: Sessile serrated lesions
MSI-H: Microsatellite-high colorectal cancer
MSS: Microsatellite stable colorectal cancer
EndometriumThe image shows the transcriptomic changes along malignancy continuum.log2FC in expression of this searched gene in stem-like cells from each diseased tissue sample relative to stem-like cells in normal samples in each tissue plotted against the malignancy continuum. Samples are colored based on if they are from different disease stage.
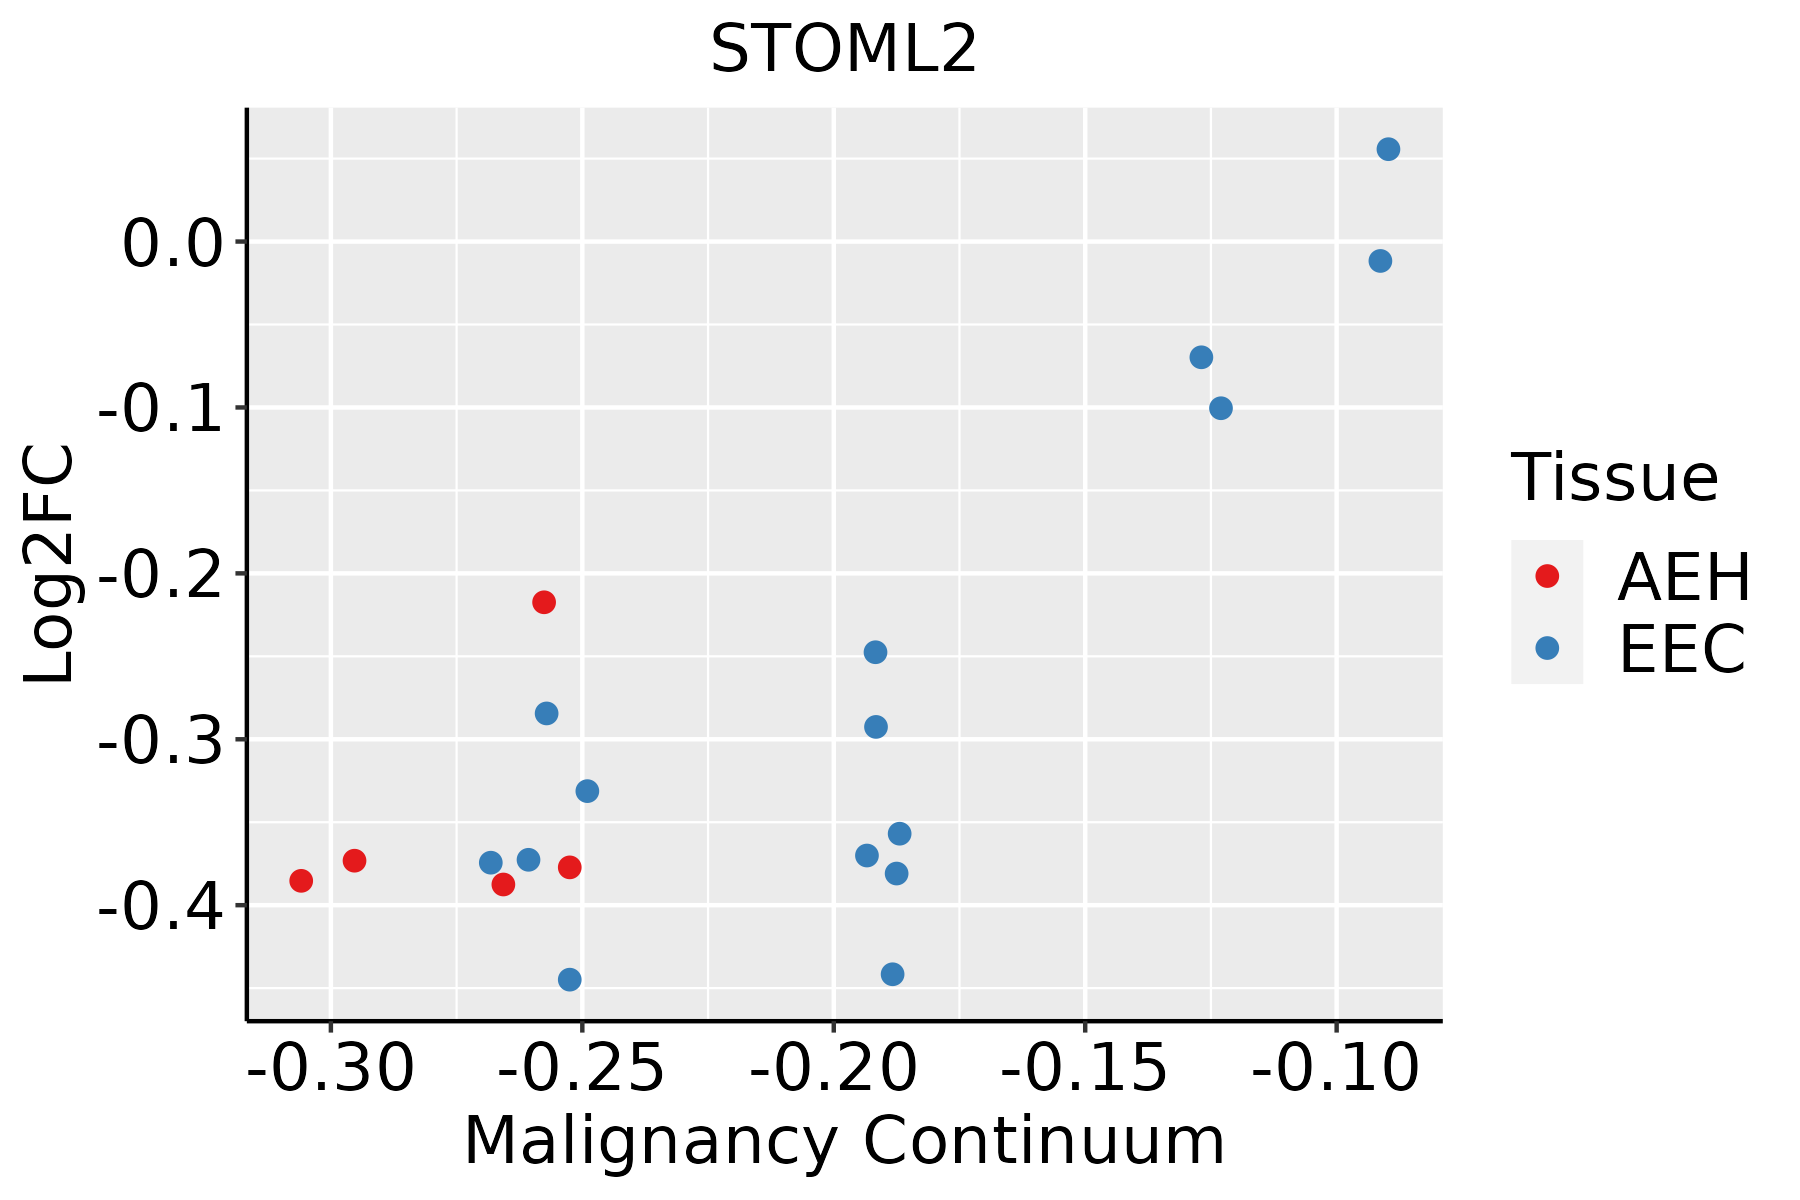
AEH: Atypical endometrial hyperplasia
EEC: Endometrioid Cancer
EsophagusThe image shows the transcriptomic changes along malignancy continuum.log2FC in expression of this searched gene in stem-like cells from each diseased tissue sample relative to stem-like cells in normal samples in each tissue plotted against the malignancy continuum. Samples are colored based on if they are from different disease stage.
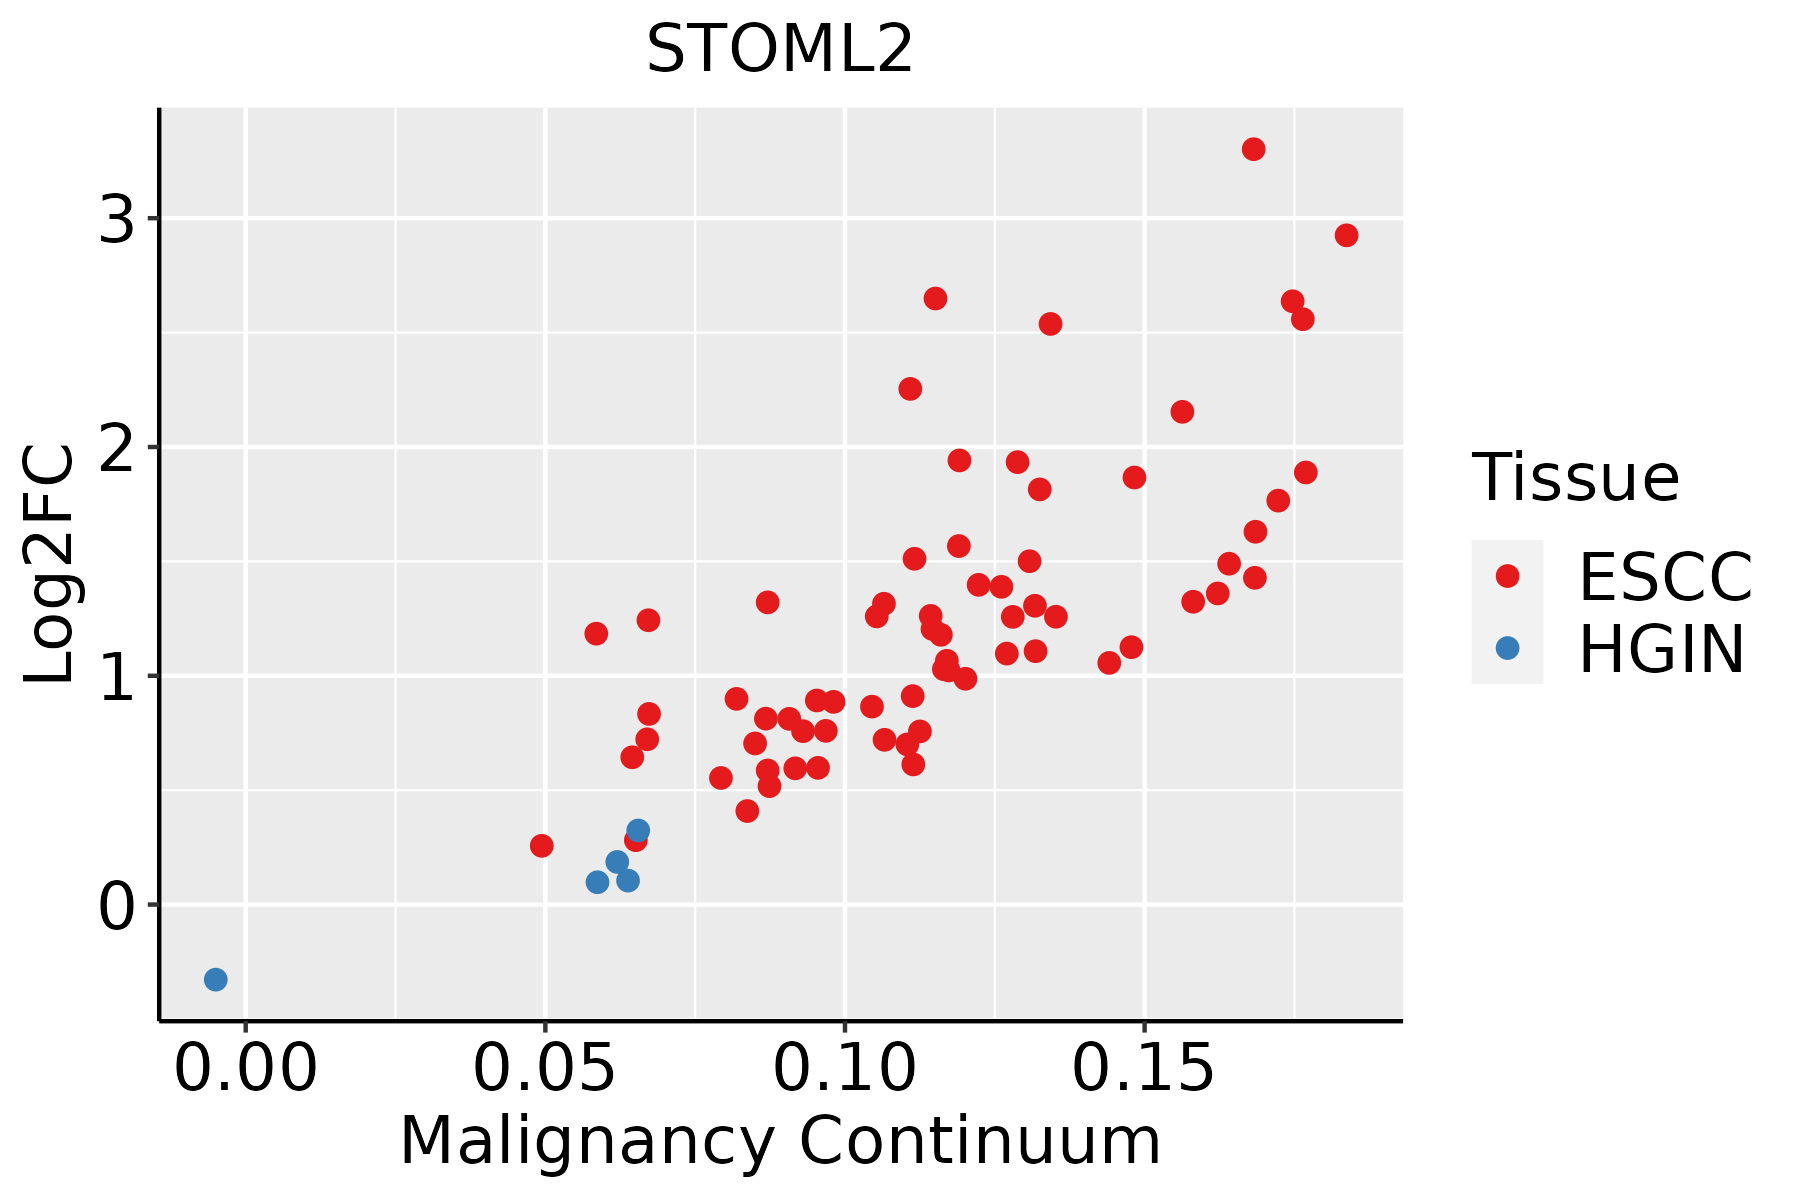
ESCC: Esophageal squamous cell carcinoma
HGIN: High-grade intraepithelial neoplasias
LGIN: Low-grade intraepithelial neoplasias
LiverThe image shows the transcriptomic changes along malignancy continuum.log2FC in expression of this searched gene in stem-like cells from each diseased tissue sample relative to stem-like cells in normal samples in each tissue plotted against the malignancy continuum. Samples are colored based on if they are from different disease stage.
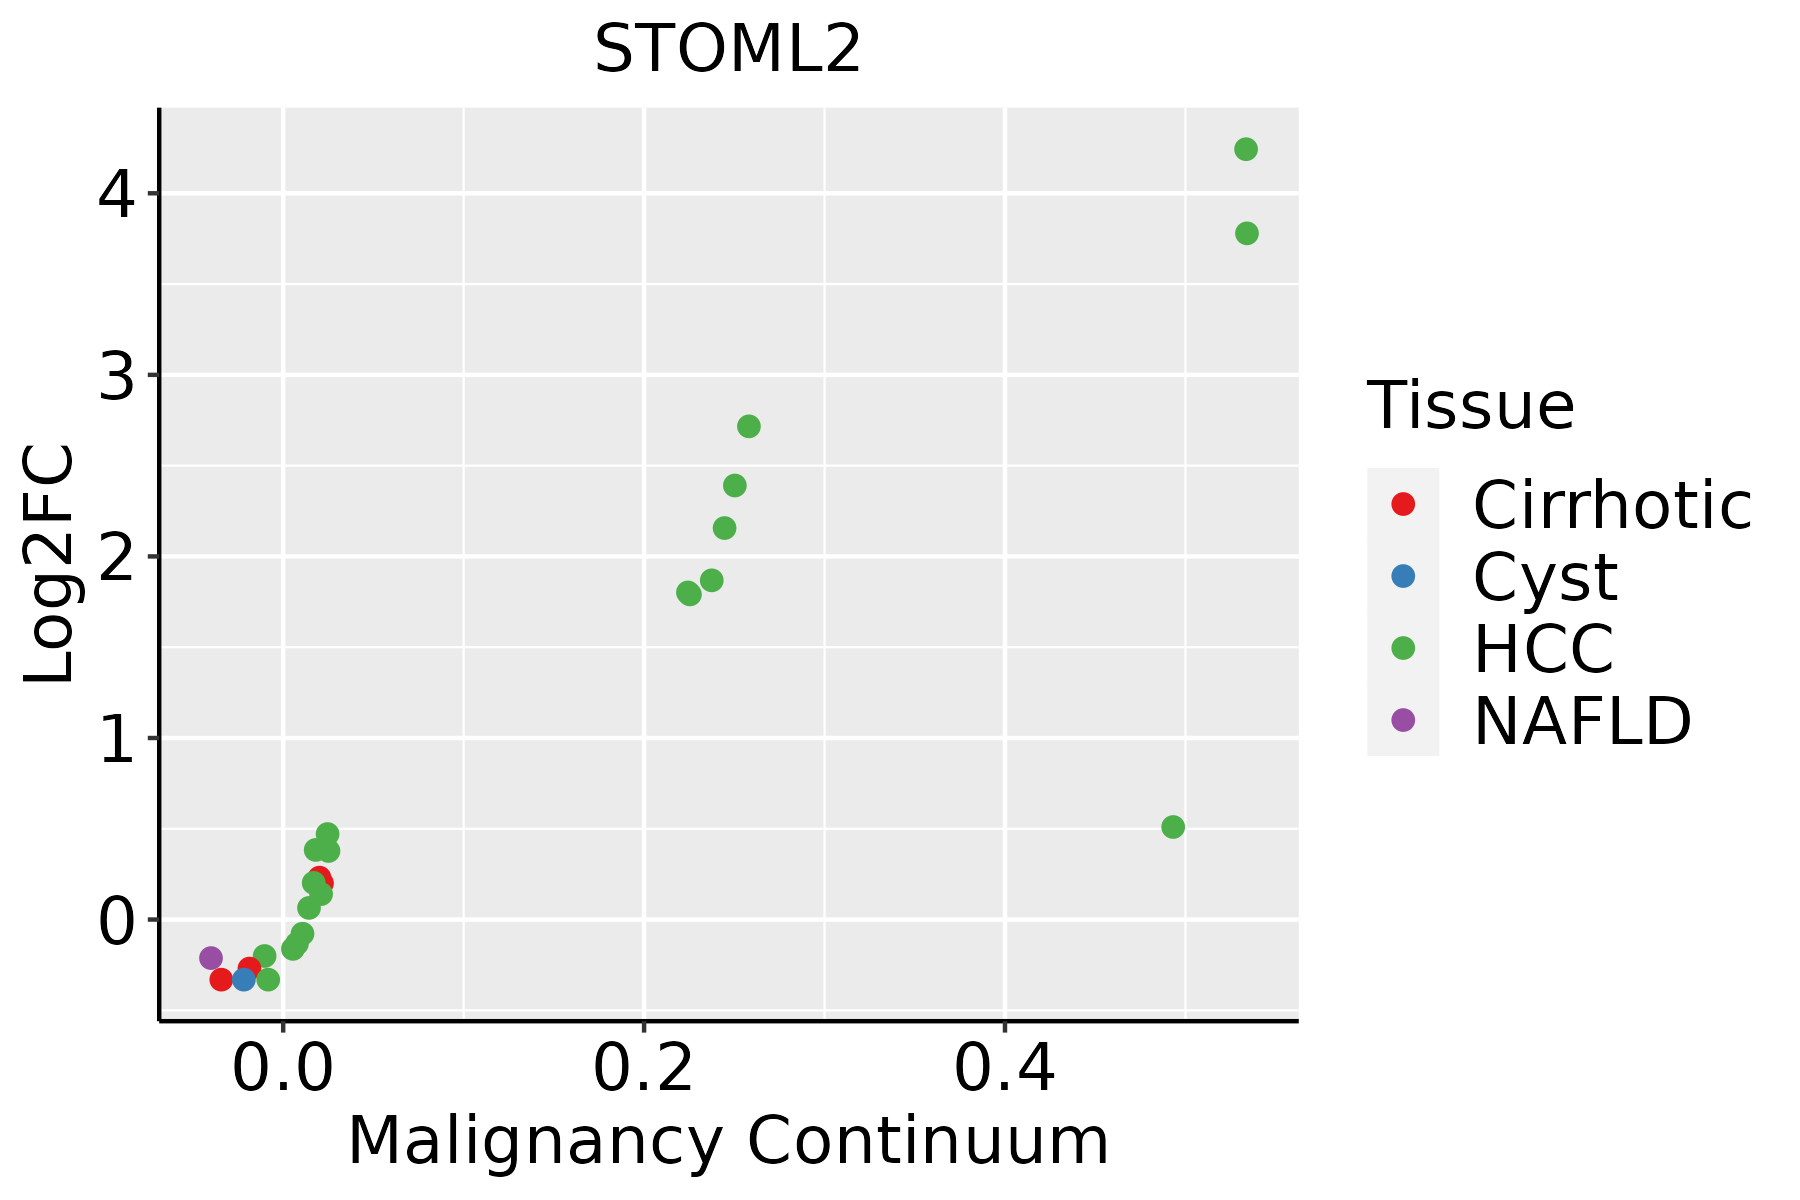
HCC: Hepatocellular carcinoma
NAFLD: Non-alcoholic fatty liver disease
Oral CavityThe image shows the transcriptomic changes along malignancy continuum.log2FC in expression of this searched gene in stem-like cells from each diseased tissue sample relative to stem-like cells in normal samples in each tissue plotted against the malignancy continuum. Samples are colored based on if they are from different disease stage.
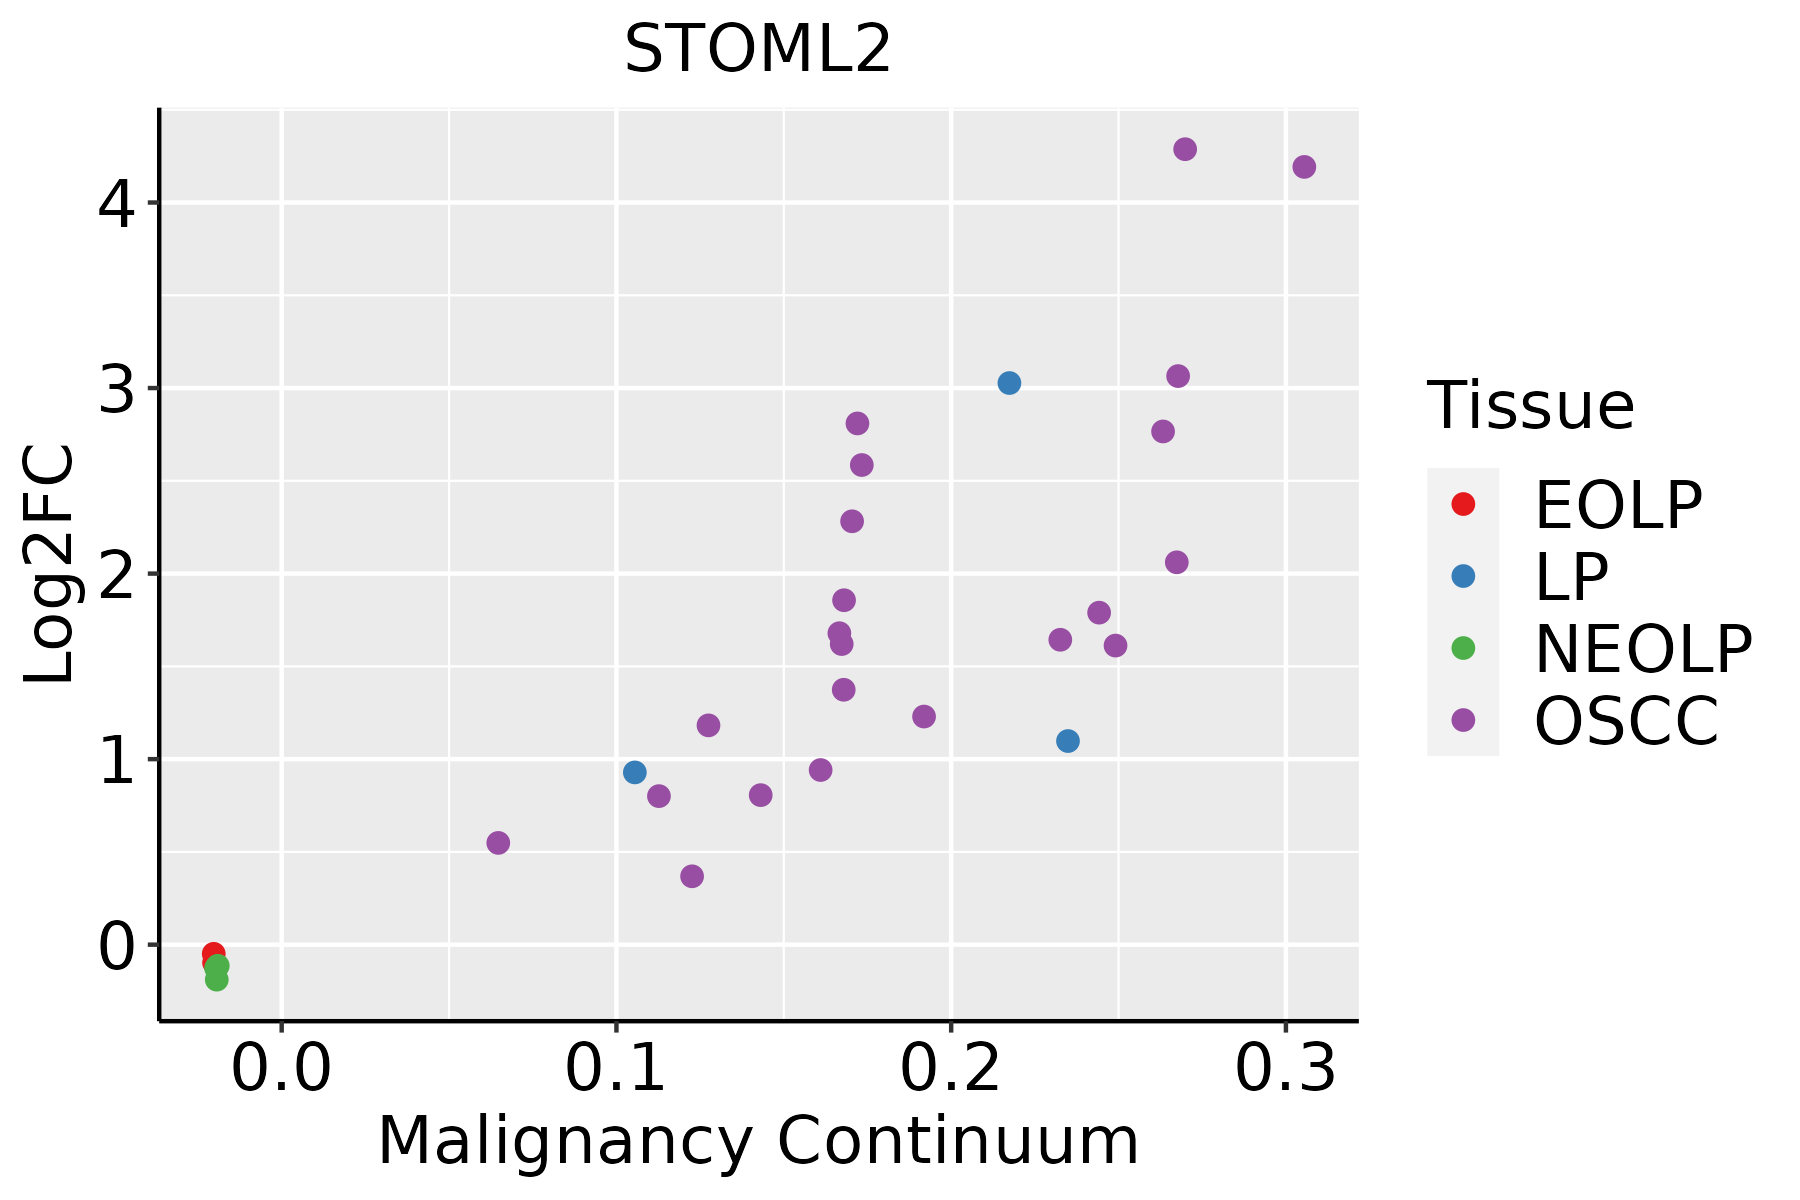
EOLP: Erosive Oral lichen planus
LP: leukoplakia
NEOLP: Non-erosive oral lichen planus
OSCC: Oral squamous cell carcinoma
ProstateThe image shows the transcriptomic changes along malignancy continuum.log2FC in expression of this searched gene in stem-like cells from each diseased tissue sample relative to stem-like cells in normal samples in each tissue plotted against the malignancy continuum. Samples are colored based on if they are from different disease stage.
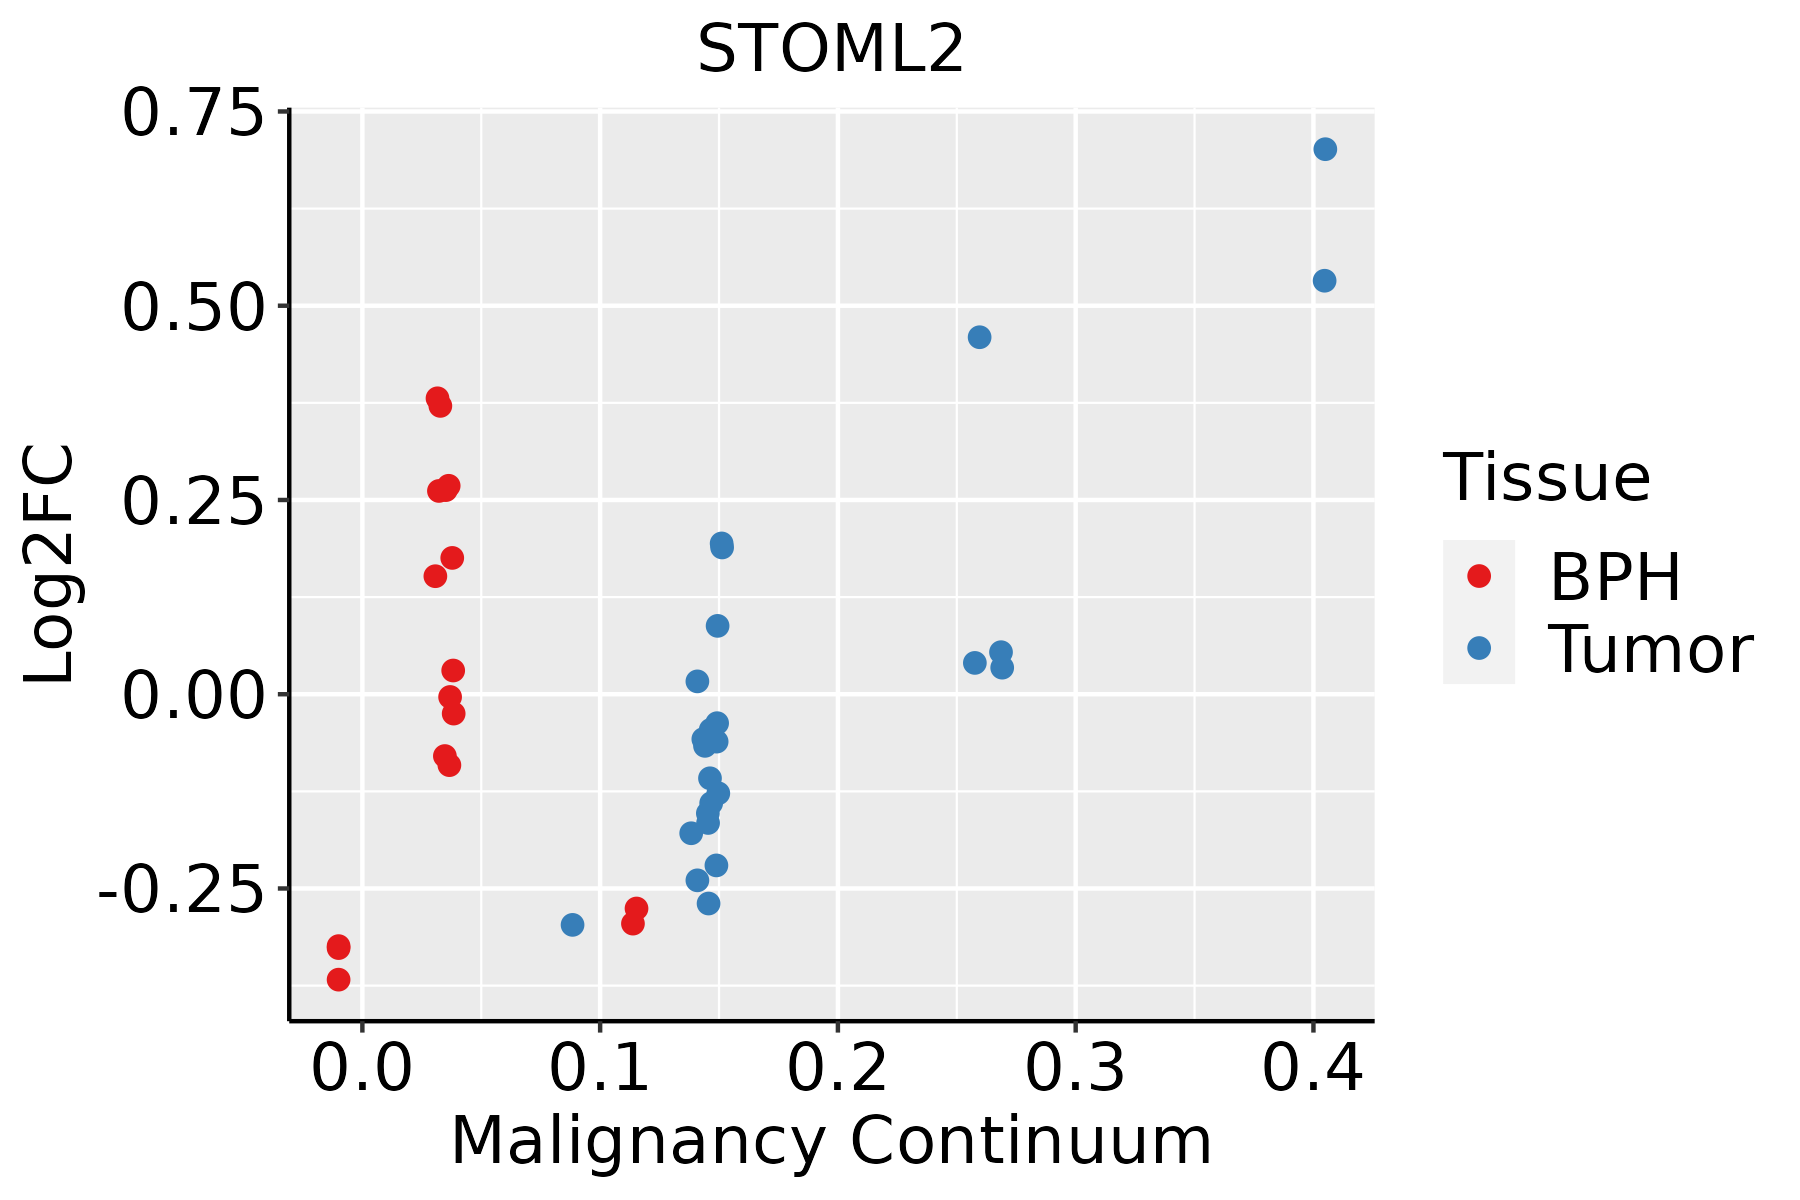
BPH: Benign Prostatic Hyperplasia
SkinThe image shows the transcriptomic changes along malignancy continuum.log2FC in expression of this searched gene in stem-like cells from each diseased tissue sample relative to stem-like cells in normal samples in each tissue plotted against the malignancy continuum. Samples are colored based on if they are from different disease stage.
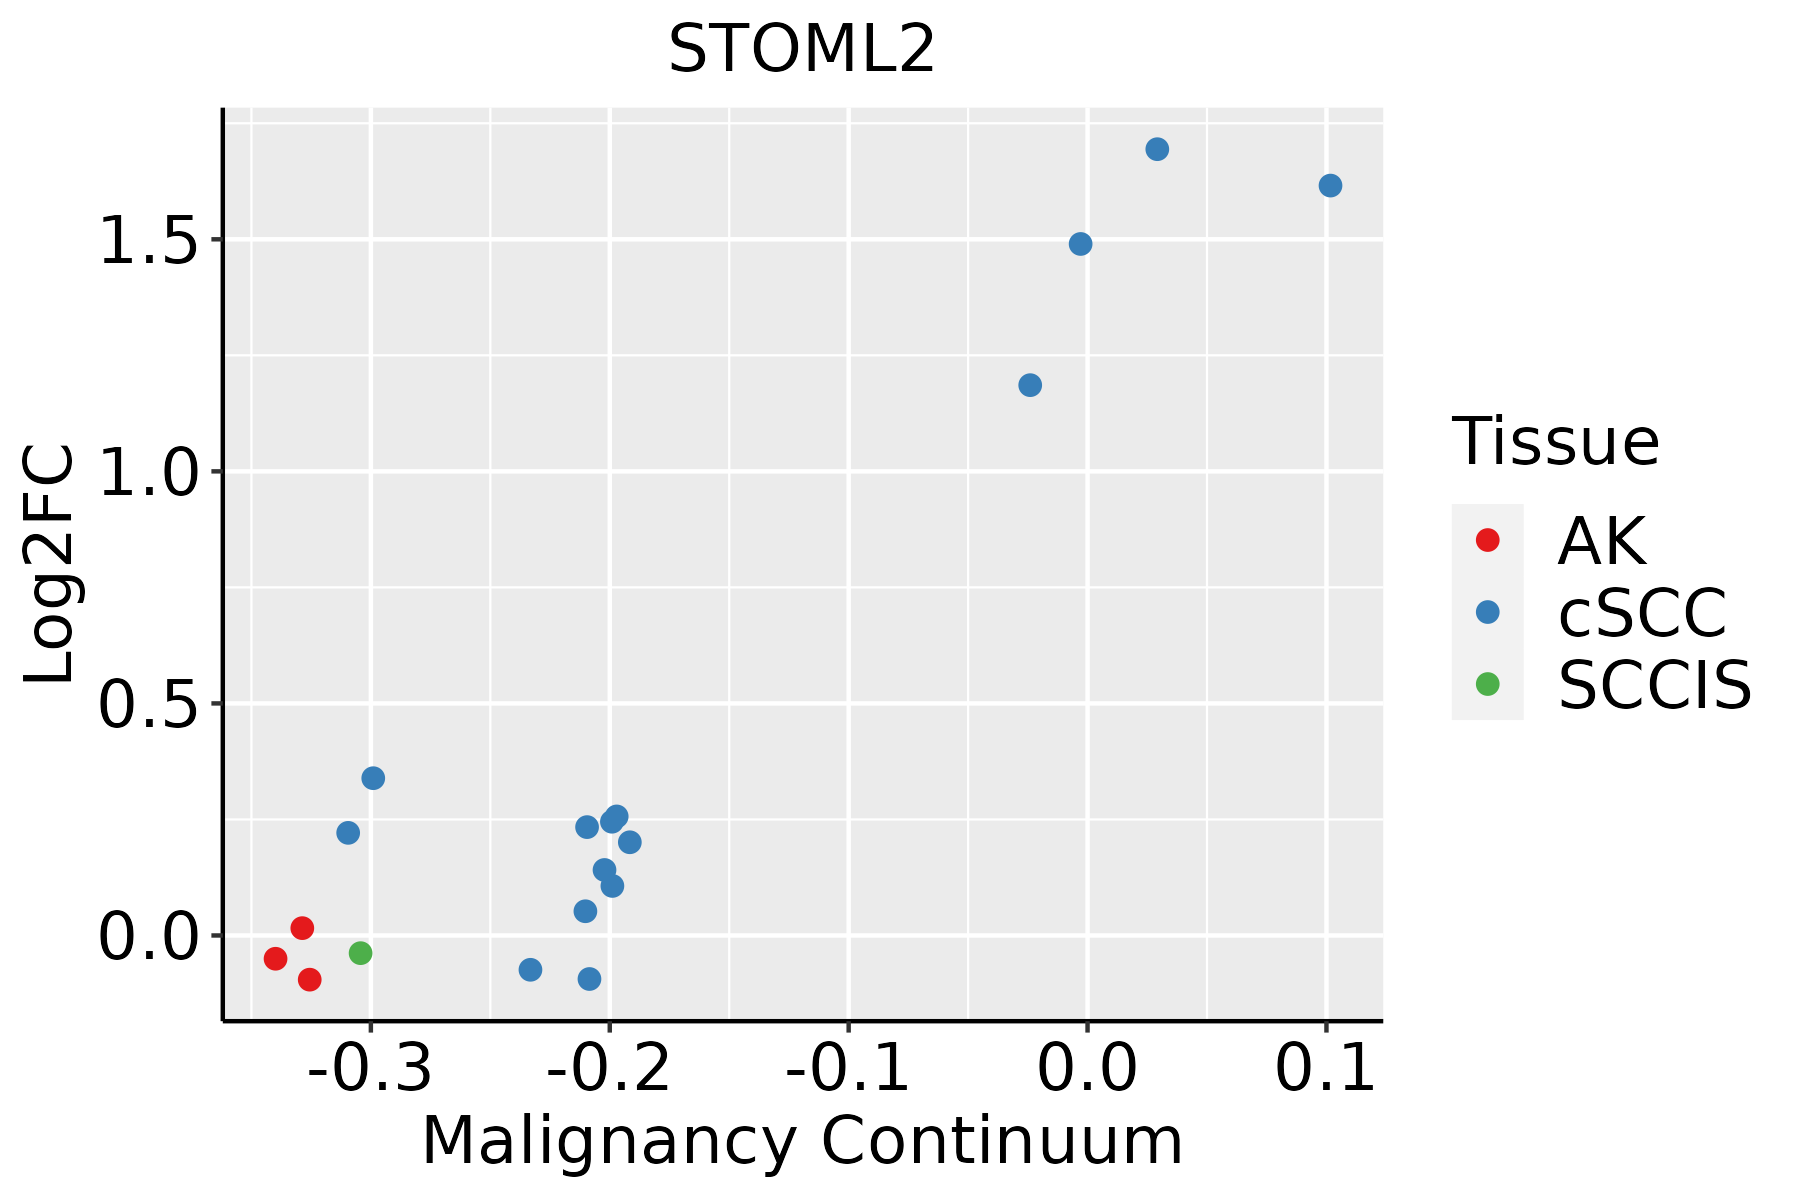
AK: Actinic keratosis
cSCC: Cutaneous squamous cell carcinoma
SCCIS:squamous cell carcinoma in situ
ThyroidThe image shows the transcriptomic changes along malignancy continuum.log2FC in expression of this searched gene in stem-like cells from each diseased tissue sample relative to stem-like cells in normal samples in each tissue plotted against the malignancy continuum. Samples are colored based on if they are from different disease stage.ATC: Anaplastic thyroid cancer
HT: Hashimoto's thyroiditis
PTC: Papillary thyroid cancer
∗log2FC in expression of this searched gene in stem-like cells from each diseased tissue sample relative to stem-like cells in normal samples in each tissue plotted against the malignancy continuum. Samples are colored based on if they are from different disease stage.

Top

Malignant transformation related pathway analysis

check buttonFind out the enriched GO biological processes and KEGG pathways involved in transition from healthy to precancer to cancer
check button Figure of enriched GO biological processes.
TissueDisease StageEnriched GO biological Processes
ColorectumADGO analysis - Figure of enriched GO biological processes: Top 15 enriched GO BP terms are showed in the bar plot of each disease state in each tissue. Each row represents a significant GO biological process which is colored according to the -log10(p.adjust).
ColorectumSERGO analysis - Figure of enriched GO biological processes: Top 15 enriched GO BP terms are showed in the bar plot of each disease state in each tissue. Each row represents a significant GO biological process which is colored according to the -log10(p.adjust).
ColorectumMSSGO analysis - Figure of enriched GO biological processes: Top 15 enriched GO BP terms are showed in the bar plot of each disease state in each tissue. Each row represents a significant GO biological process which is colored according to the -log10(p.adjust).
ColorectumMSI-HGO analysis - Figure of enriched GO biological processes: Top 15 enriched GO BP terms are showed in the bar plot of each disease state in each tissue. Each row represents a significant GO biological process which is colored according to the -log10(p.adjust).
ColorectumFAPGO analysis - Figure of enriched GO biological processes: Top 15 enriched GO BP terms are showed in the bar plot of each disease state in each tissue. Each row represents a significant GO biological process which is colored according to the -log10(p.adjust).
∗Top 15 enriched GO BP terms are showed in the bar plot of each disease state in each tissue. Each row represents a significant GO biological process which is colored according to the -log10(p.adjust).
Page: 1 2 3 4 5 6 7 8 9 

check button Enriched GO biological processes.
GO IDTissueDisease StageDescriptionGene RatioBg Ratiopvaluep.adjustCount
GO:00460349BreastPrecancerATP metabolic process82/1080277/187231.94e-365.19e-3382
GO:00061199BreastPrecanceroxidative phosphorylation53/1080141/187231.15e-292.04e-2653
GO:00090608BreastPrecanceraerobic respiration58/1080189/187235.69e-277.62e-2458
GO:00060918BreastPrecancergeneration of precursor metabolites and energy94/1080490/187231.54e-251.64e-2294
GO:00453338BreastPrecancercellular respiration59/1080230/187235.97e-235.32e-2059
GO:00159808BreastPrecancerenergy derivation by oxidation of organic compounds70/1080318/187238.33e-236.37e-2070
GO:19026008BreastPrecancerproton transmembrane transport39/1080157/187234.18e-151.18e-1239
GO:00159857BreastPrecancerenergy coupled proton transport, down electrochemical gradient16/108026/187234.15e-149.65e-1216
GO:00159867BreastPrecancerATP synthesis coupled proton transport16/108026/187234.15e-149.65e-1216
GO:00427766BreastPrecancermitochondrial ATP synthesis coupled proton transport13/108019/187231.43e-122.74e-1013
GO:00067547BreastPrecancerATP biosynthetic process21/108057/187232.31e-124.26e-1021
GO:00068398BreastPrecancermitochondrial transport45/1080254/187231.37e-111.88e-0945
GO:00092067BreastPrecancerpurine ribonucleoside triphosphate biosynthetic process22/108068/187231.41e-111.88e-0922
GO:00091457BreastPrecancerpurine nucleoside triphosphate biosynthetic process22/108069/187231.95e-112.43e-0922
GO:00092017BreastPrecancerribonucleoside triphosphate biosynthetic process22/108074/187239.18e-111.00e-0822
GO:00091448BreastPrecancerpurine nucleoside triphosphate metabolic process24/108088/187239.66e-111.03e-0824
GO:00092057BreastPrecancerpurine ribonucleoside triphosphate metabolic process23/108082/187231.27e-101.34e-0823
GO:00091427BreastPrecancernucleoside triphosphate biosynthetic process23/108085/187232.82e-102.69e-0823
GO:00091997BreastPrecancerribonucleoside triphosphate metabolic process23/108089/187237.65e-106.66e-0823
GO:00091418BreastPrecancernucleoside triphosphate metabolic process26/1080112/187237.72e-106.66e-0826
Page: 1 2 3 4 5 6 7 8 9 10 11 12 13 14 15 16 17 18 19 20 21 22 23 24 25 26 27 28 29 30 31 32 33 34 35 36 37 38 39 40 

check button Enriched KEGG pathways.
Pathway IDTissueDisease StageDescriptionGene RatioBg Ratiopvaluep.adjustqvalueCount
Page: 1 

Top

Cell-cell communication analysis

check buttonIdentification of potential cell-cell interactions between two cell types and their ligand-receptor pairs for different disease states
LigandReceptorLRpairPathwayTissueDisease Stage
Page: 1 

Top

Single-cell gene regulatory network inference analysis

check buttonFind out the significant the regulons (TFs) and the target genes of each regulon across cell types for different disease states
TFCell TypeTissueDisease StageTarget GeneRSSRegulon Activity
∗The dot plots of a searched regulon are shown for all cell subpopulations in each disease state of each tissue based on the regulon specific score inferred using pySCENIC and by calculating the average expression.
Page: 1 

Top

Somatic mutation of malignant transformation related genes

check buttonAnnotation of somatic variants for genes involved in malignant transformation
Hugo SymbolVariant ClassVariant ClassificationdbSNP RSHGVScHGVSpHGVSp ShortSWISSPROTBIOTYPESIFTPolyPhenTumor Sample BarcodeTissueHistologySexAgeStageTherapy TypesDrugsOutcome
STOML2insertionIn_Frame_Insnovelc.869_870insTGGGGAp.Ala290_Lys291insGlyAspp.A290_K291insGDQ9UJZ1protein_codingTCGA-BH-A0H7-01Breastbreast invasive carcinomaFemale>=65III/IVChemotherapydoxorubicinSD
STOML2insertionIn_Frame_Insnovelc.868_869insAGCTGGGCTTGGCCAGGGAGTp.Ala290delinsGluLeuGlyLeuAlaArgGluSerp.A290delinsELGLARESQ9UJZ1protein_codingTCGA-BH-A0H7-01Breastbreast invasive carcinomaFemale>=65III/IVChemotherapydoxorubicinSD
STOML2SNVMissense_Mutationrs763483882c.215G>Ap.Arg72Glnp.R72QQ9UJZ1protein_codingtolerated(0.09)benign(0.094)TCGA-EA-A3HS-01Cervixcervical & endocervical cancerFemale<65I/IIUnknownUnknownSD
STOML2SNVMissense_Mutationrs753222022c.511N>Tp.Arg171Cysp.R171CQ9UJZ1protein_codingdeleterious(0.01)possibly_damaging(0.892)TCGA-AA-3966-01Colorectumcolon adenocarcinomaFemale>=65I/IIUnknownUnknownSD
STOML2SNVMissense_Mutationrs201944176c.776G>Ap.Arg259Glnp.R259QQ9UJZ1protein_codingtolerated(0.48)benign(0.003)TCGA-AA-A00N-01Colorectumcolon adenocarcinomaMale>=65I/IIUnknownUnknownPD
STOML2SNVMissense_Mutationc.1062G>Tp.Lys354Asnp.K354NQ9UJZ1protein_codingdeleterious_low_confidence(0.01)benign(0.003)TCGA-G4-6303-01Colorectumcolon adenocarcinomaFemale<65III/IVChemotherapy5-fuPD
STOML2SNVMissense_Mutationc.445N>Ap.Glu149Lysp.E149KQ9UJZ1protein_codingdeleterious(0)probably_damaging(0.997)TCGA-G4-6304-01Colorectumcolon adenocarcinomaFemale>=65I/IIChemotherapyfluorouracilPD
STOML2SNVMissense_Mutationnovelc.628N>Tp.Thr210Serp.T210SQ9UJZ1protein_codingtolerated(0.36)benign(0.098)TCGA-A5-A0G2-01Endometriumuterine corpus endometrioid carcinomaFemale<65III/IVUnknownUnknownSD
STOML2SNVMissense_Mutationrs781632715c.512N>Ap.Arg171Hisp.R171HQ9UJZ1protein_codingtolerated(0.1)possibly_damaging(0.806)TCGA-AJ-A3EK-01Endometriumuterine corpus endometrioid carcinomaFemale<65I/IIChemotherapycarboplatinCR
STOML2SNVMissense_Mutationrs201944176c.776N>Ap.Arg259Glnp.R259QQ9UJZ1protein_codingtolerated(0.48)benign(0.003)TCGA-AJ-A5DW-01Endometriumuterine corpus endometrioid carcinomaFemale<65I/IIUnknownUnknownSD
Page: 1 2 3 4 

Top

Related drugs of malignant transformation related genes

check buttonIdentification of chemicals and drugs interact with genes involved in malignant transfromation
(DGIdb 4.0)
Entrez IDSymbolCategoryInteraction TypesDrug Claim NameDrug NamePMIDs
Page: 1