
|
|||||
|
 | |
| |
| |
| |
| |
| |
|
Gene: SSNA1 |
Gene summary for SSNA1 |
| Gene information | Species | Human | Gene symbol | SSNA1 | Gene ID | 8636 |
| Gene name | SS nuclear autoantigen 1 | |
| Gene Alias | N14 | |
| Cytomap | 9q34.3 | |
| Gene Type | protein-coding | GO ID | GO:0006810 | UniProtAcc | A0A024R8G6 |
Top |
Malignant transformation analysis |
| Identification of the aberrant gene expression in precancerous and cancerous lesions by comparing the gene expression of stem-like cells in diseased tissues with normal stem cells |
| Entrez ID | Symbol | Replicates | Species | Organ | Tissue | Adj P-value | Log2FC | Malignancy |
| 8636 | SSNA1 | SYSMH4 | Human | Oral cavity | OSCC | 1.92e-14 | 3.74e-01 | 0.1226 |
| 8636 | SSNA1 | SYSMH5 | Human | Oral cavity | OSCC | 1.96e-11 | 3.83e-01 | 0.0647 |
| 8636 | SSNA1 | SYSMH6 | Human | Oral cavity | OSCC | 7.23e-23 | 7.19e-01 | 0.1275 |
| 8636 | SSNA1 | P4_S8_cSCC | Human | Skin | cSCC | 2.57e-06 | 2.54e-01 | -0.3095 |
| 8636 | SSNA1 | P5_S10_cSCC | Human | Skin | cSCC | 3.02e-19 | 3.15e-01 | -0.299 |
| 8636 | SSNA1 | P1_cSCC | Human | Skin | cSCC | 2.40e-46 | 1.58e+00 | 0.0292 |
| 8636 | SSNA1 | P2_cSCC | Human | Skin | cSCC | 2.35e-35 | 1.13e+00 | -0.024 |
| 8636 | SSNA1 | P4_cSCC | Human | Skin | cSCC | 1.01e-49 | 1.27e+00 | -0.00290000000000005 |
| 8636 | SSNA1 | P10_cSCC | Human | Skin | cSCC | 1.89e-43 | 1.44e+00 | 0.1017 |
| 8636 | SSNA1 | cSCC_p1 | Human | Skin | cSCC | 1.92e-03 | 2.16e-01 | -0.1916 |
| 8636 | SSNA1 | cSCC_p10 | Human | Skin | cSCC | 1.27e-03 | 2.96e-01 | -0.2095 |
| 8636 | SSNA1 | cSCC_p4 | Human | Skin | cSCC | 1.01e-05 | 2.99e-01 | -0.2022 |
| 8636 | SSNA1 | cSCC_p6 | Human | Skin | cSCC | 1.72e-02 | 1.70e-01 | -0.1989 |
| 8636 | SSNA1 | cSCC_p8 | Human | Skin | cSCC | 1.13e-16 | 3.73e-01 | -0.1971 |
| 8636 | SSNA1 | cSCC_p9 | Human | Skin | cSCC | 8.47e-13 | 3.25e-01 | -0.1991 |
| 8636 | SSNA1 | male-WTA | Human | Thyroid | PTC | 1.53e-16 | 1.12e-01 | 0.1037 |
| 8636 | SSNA1 | PTC01 | Human | Thyroid | PTC | 3.42e-13 | 3.07e-01 | 0.1899 |
| 8636 | SSNA1 | PTC03 | Human | Thyroid | PTC | 6.49e-03 | 2.42e-01 | 0.1784 |
| 8636 | SSNA1 | PTC04 | Human | Thyroid | PTC | 1.43e-14 | 3.16e-01 | 0.1927 |
| 8636 | SSNA1 | PTC05 | Human | Thyroid | PTC | 2.42e-25 | 8.44e-01 | 0.2065 |
| Page: 1 2 3 4 5 6 7 8 |
| Tissue | Expression Dynamics | Abbreviation |
| Colorectum (GSE201348) |  | FAP: Familial adenomatous polyposis |
| CRC: Colorectal cancer | ||
| Colorectum (HTA11) |  | AD: Adenomas |
| SER: Sessile serrated lesions | ||
| MSI-H: Microsatellite-high colorectal cancer | ||
| MSS: Microsatellite stable colorectal cancer | ||
| Esophagus | 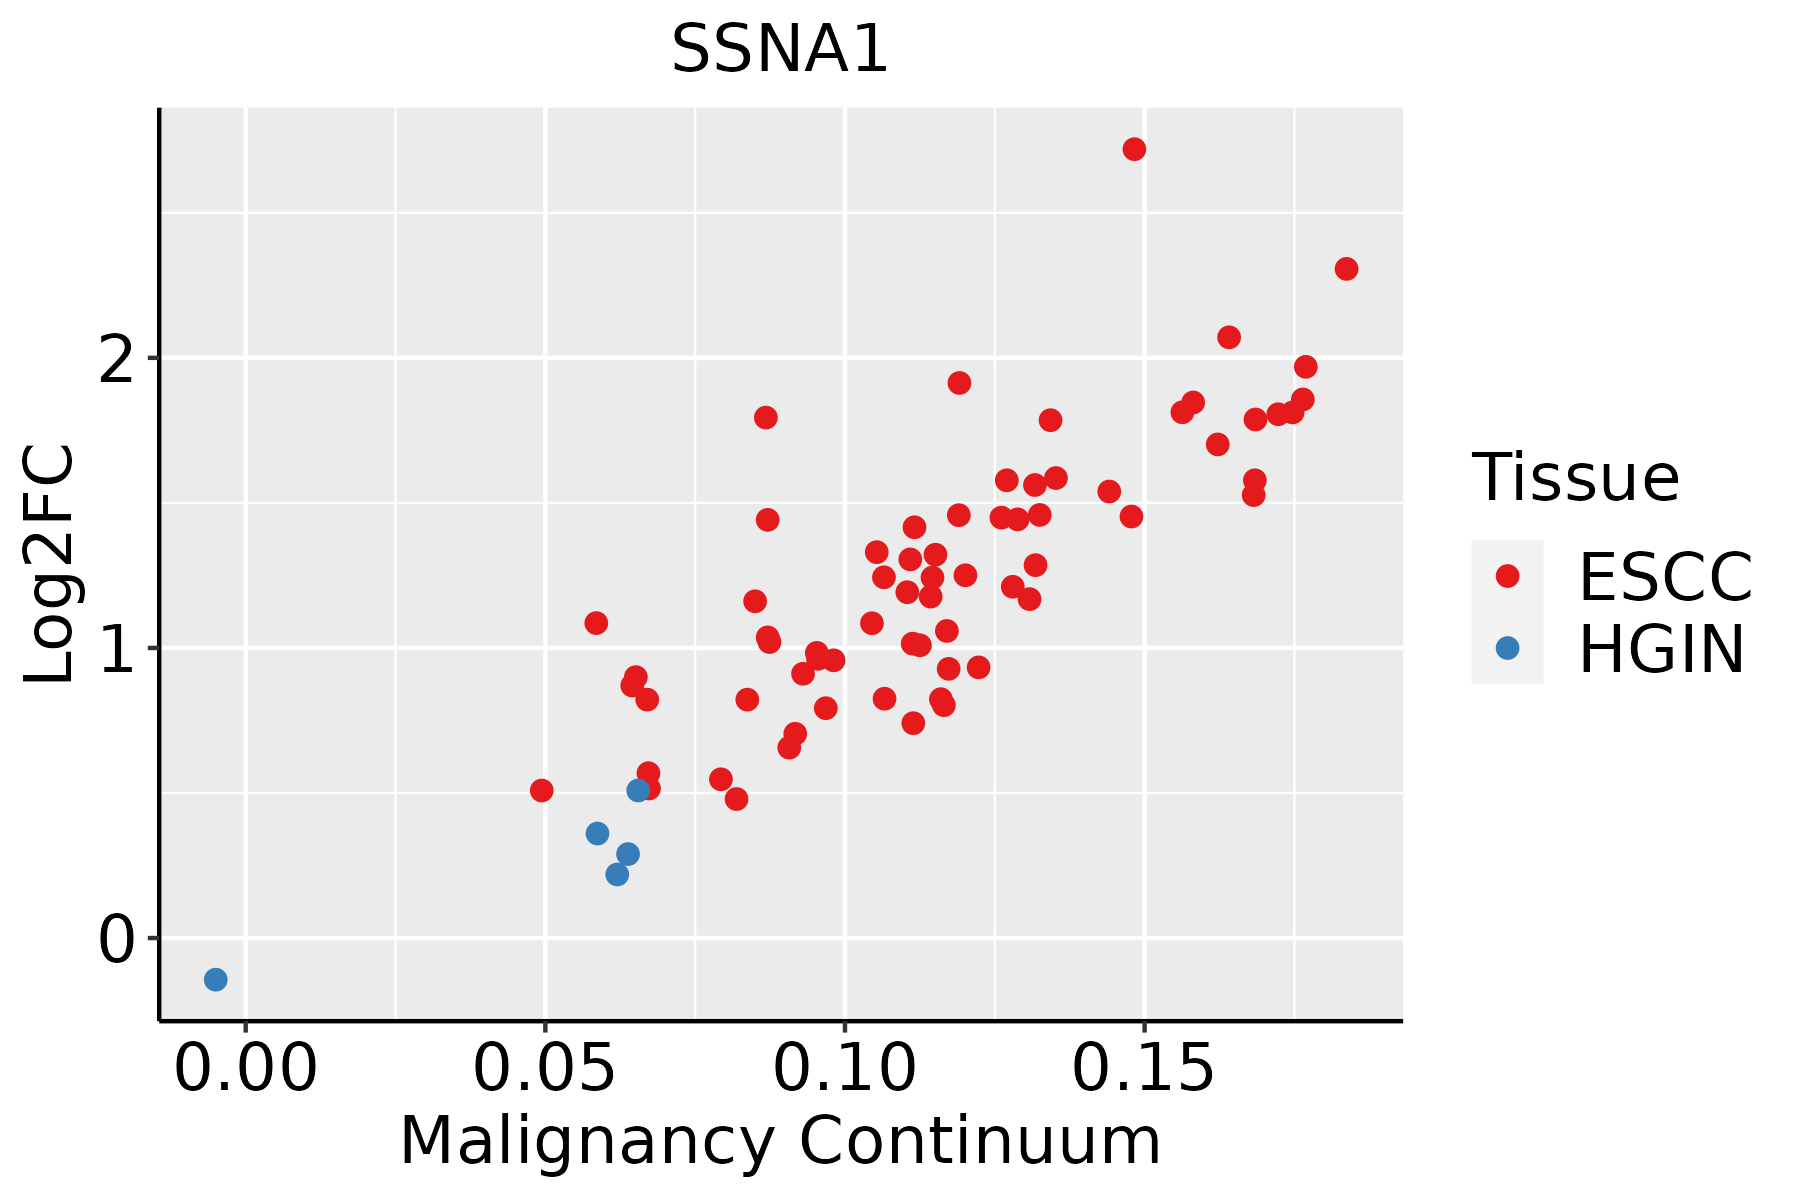 | ESCC: Esophageal squamous cell carcinoma |
| HGIN: High-grade intraepithelial neoplasias | ||
| LGIN: Low-grade intraepithelial neoplasias | ||
| Liver |  | HCC: Hepatocellular carcinoma |
| NAFLD: Non-alcoholic fatty liver disease | ||
| Oral Cavity | 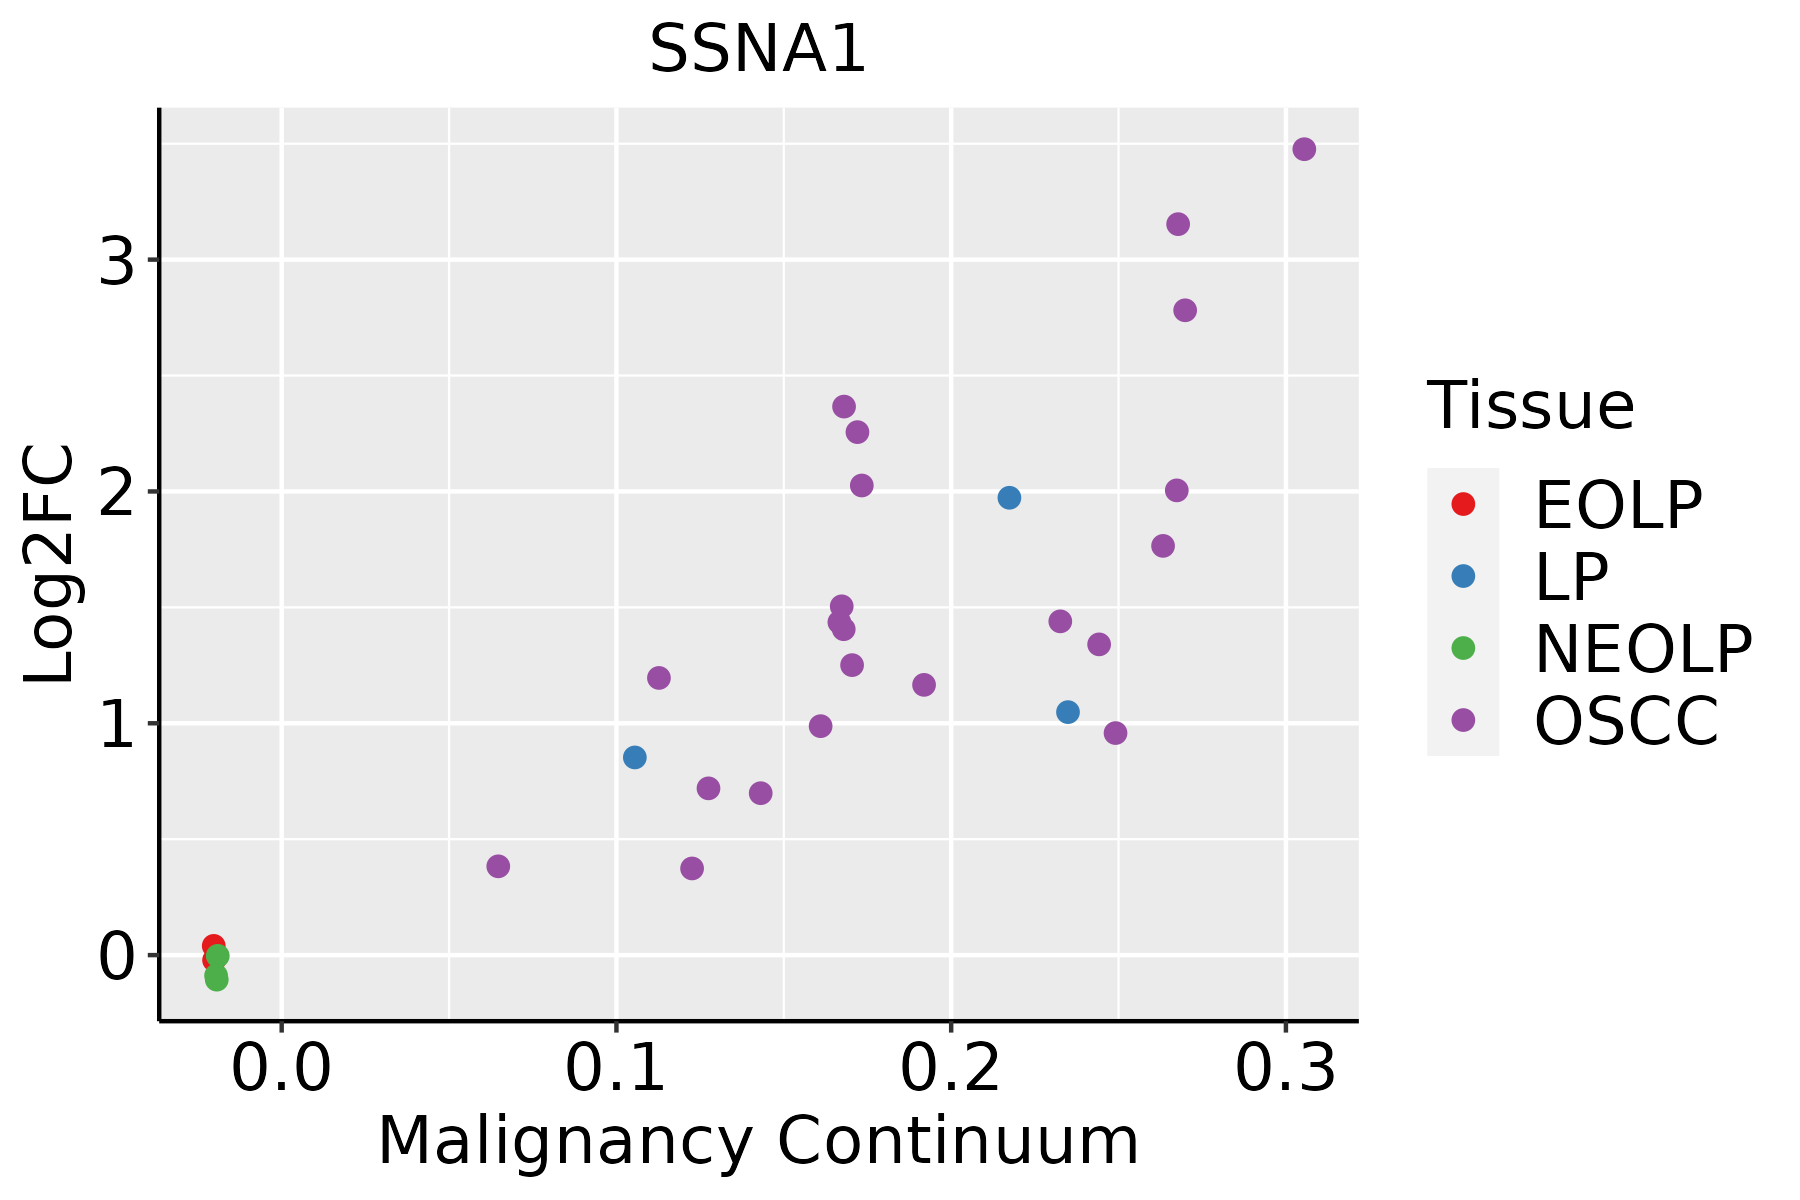 | EOLP: Erosive Oral lichen planus |
| LP: leukoplakia | ||
| NEOLP: Non-erosive oral lichen planus | ||
| OSCC: Oral squamous cell carcinoma | ||
| Prostate | 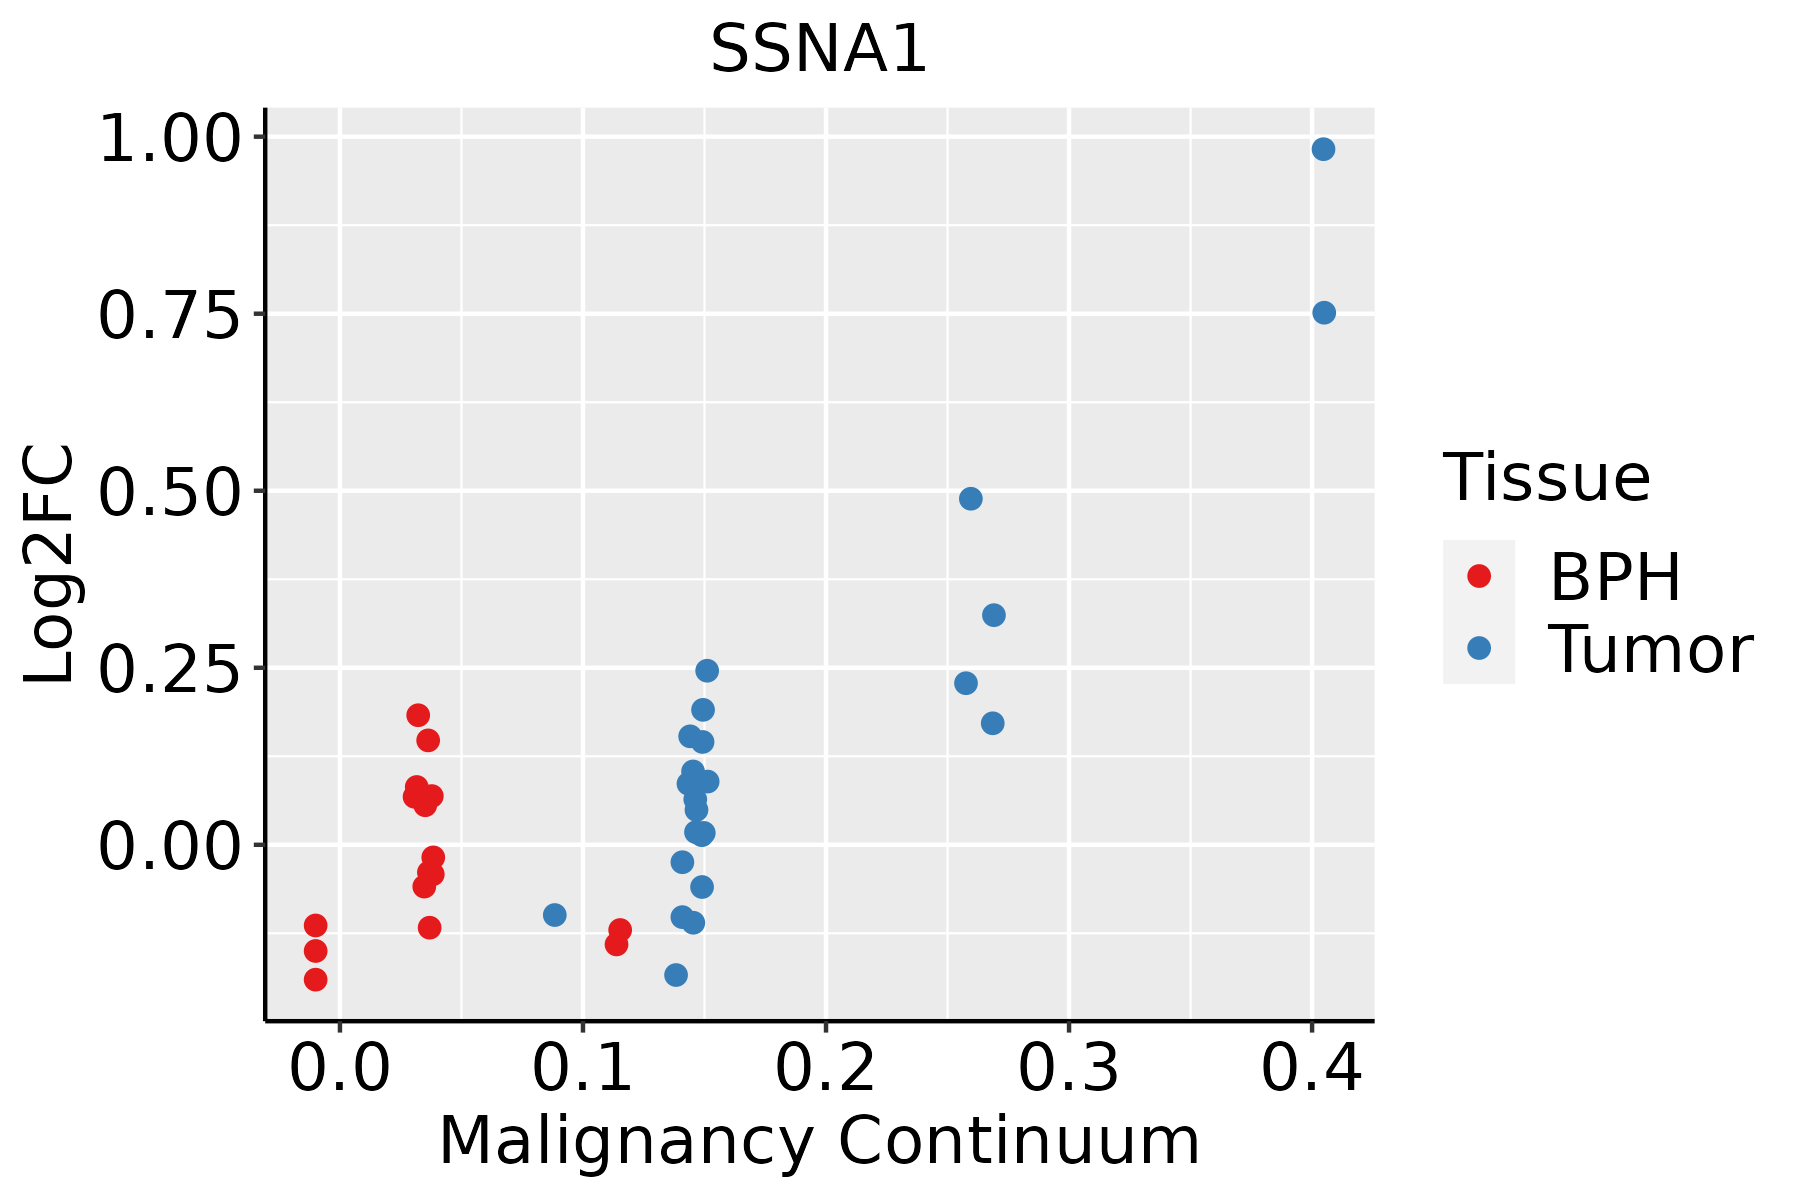 | BPH: Benign Prostatic Hyperplasia |
| Skin | 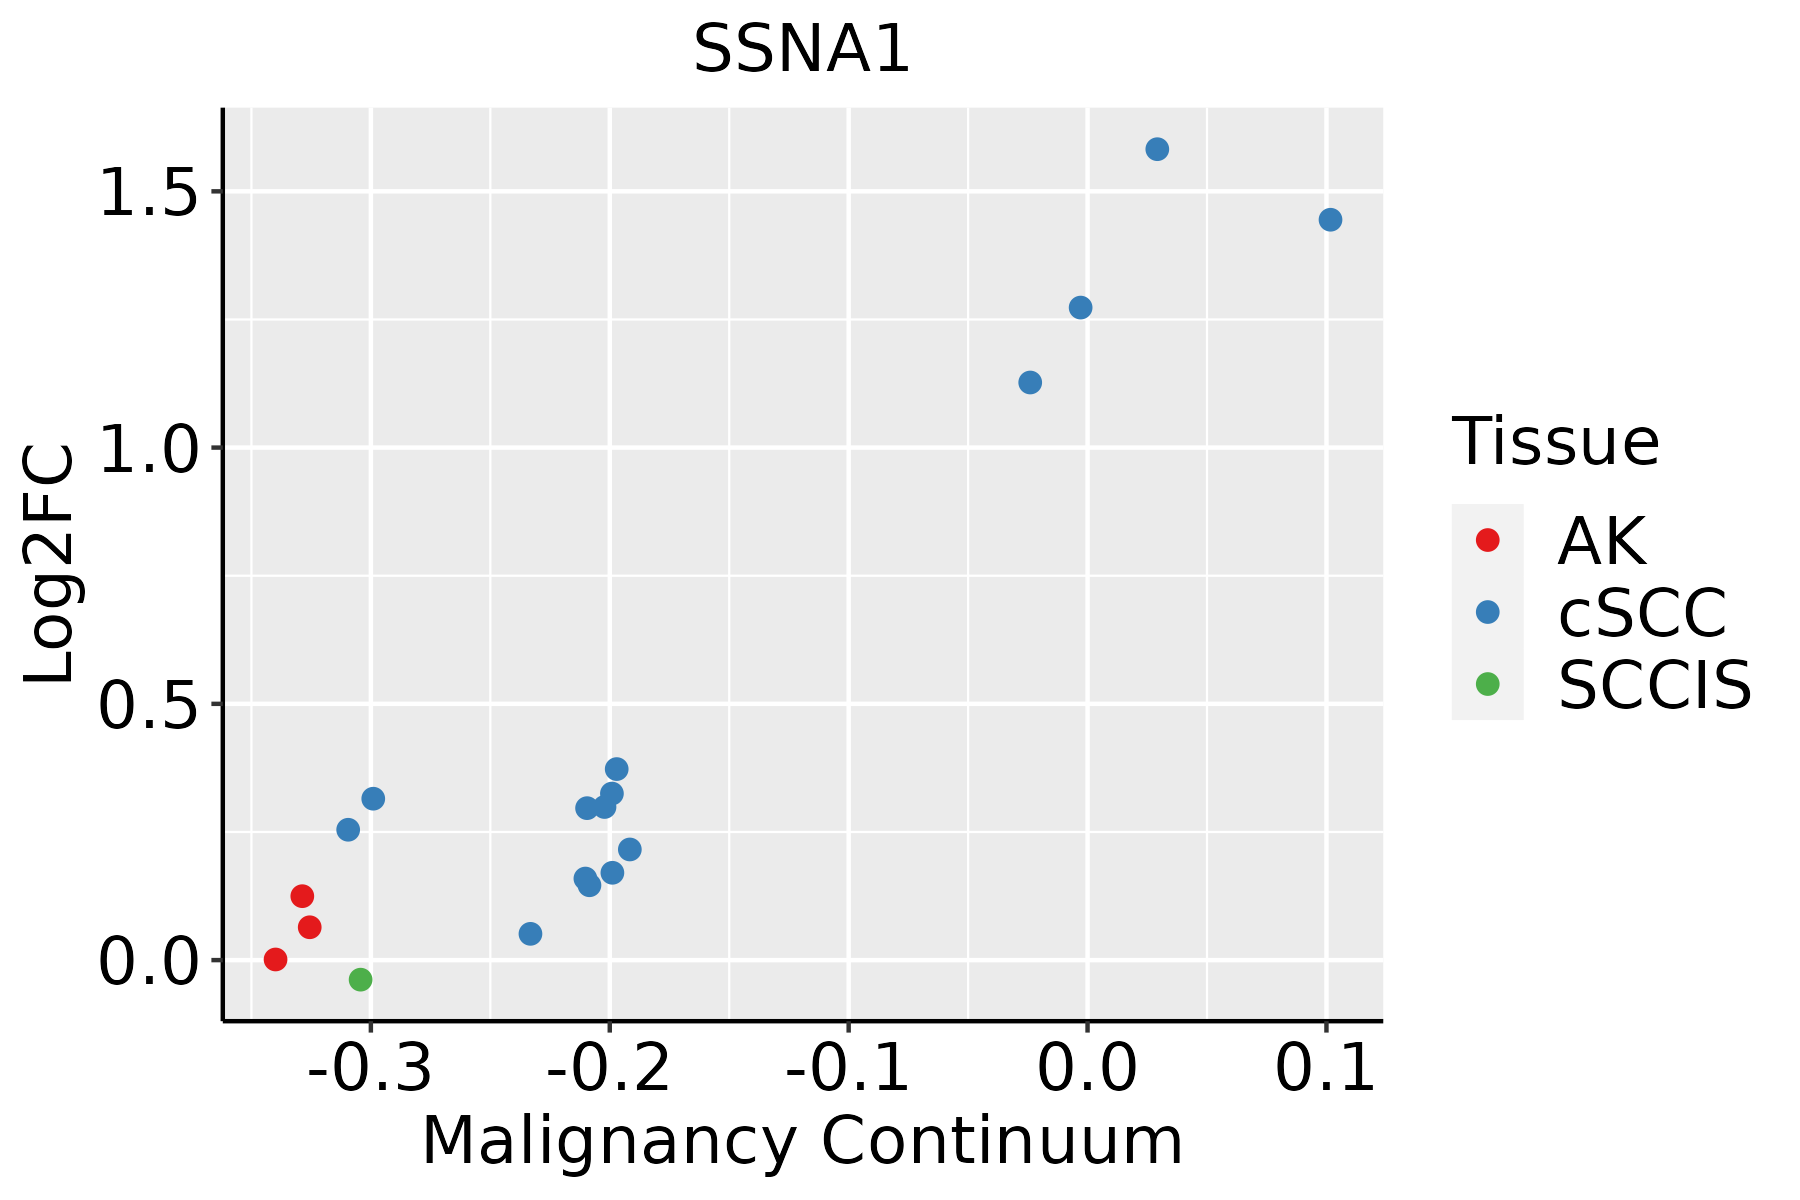 | AK: Actinic keratosis |
| cSCC: Cutaneous squamous cell carcinoma | ||
| SCCIS:squamous cell carcinoma in situ | ||
| Thyroid | 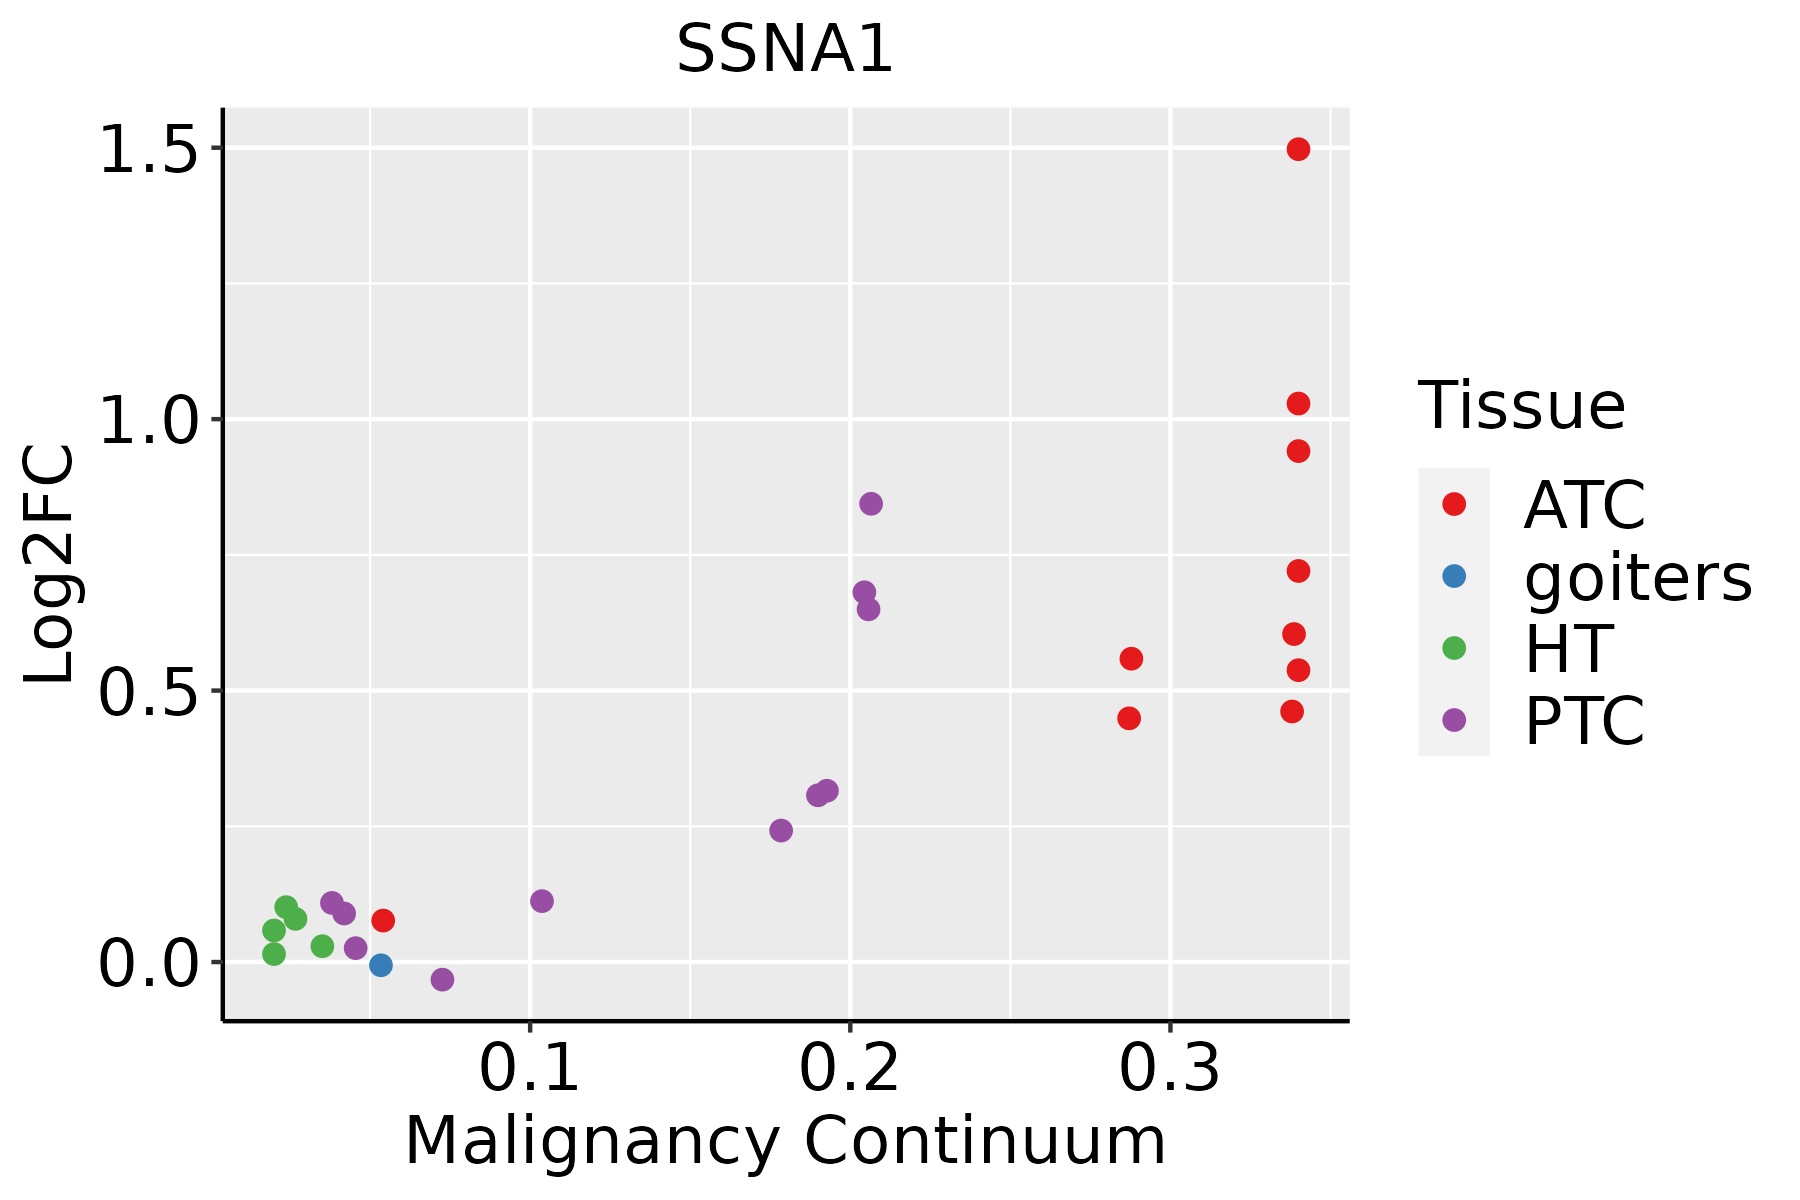 | ATC: Anaplastic thyroid cancer |
| HT: Hashimoto's thyroiditis | ||
| PTC: Papillary thyroid cancer |
| ∗log2FC in expression of this searched gene in stem-like cells from each diseased tissue sample relative to stem-like cells in normal samples in each tissue plotted against the malignancy continuum. Samples are colored based on if they are from different disease stage. |
Top |
Malignant transformation related pathway analysis |
| Find out the enriched GO biological processes and KEGG pathways involved in transition from healthy to precancer to cancer |
| Tissue | Disease Stage | Enriched GO biological Processes |
| Colorectum | AD |  |
| Colorectum | SER |  |
| Colorectum | MSS |  |
| Colorectum | MSI-H |  |
| Colorectum | FAP |  |
| ∗Top 15 enriched GO BP terms are showed in the bar plot of each disease state in each tissue. Each row represents a significant GO biological process which is colored according to the -log10(p.adjust). |
| Page: 1 2 3 4 5 6 7 8 9 |
| GO ID | Tissue | Disease Stage | Description | Gene Ratio | Bg Ratio | pvalue | p.adjust | Count |
| GO:0030705 | Colorectum | AD | cytoskeleton-dependent intracellular transport | 60/3918 | 195/18723 | 7.56e-04 | 7.59e-03 | 60 |
| GO:00307051 | Colorectum | SER | cytoskeleton-dependent intracellular transport | 44/2897 | 195/18723 | 5.53e-03 | 4.09e-02 | 44 |
| GO:00307052 | Colorectum | MSS | cytoskeleton-dependent intracellular transport | 52/3467 | 195/18723 | 3.07e-03 | 2.34e-02 | 52 |
| GO:00315035 | Esophagus | HGIN | protein-containing complex localization | 50/2587 | 220/18723 | 2.18e-04 | 3.98e-03 | 50 |
| GO:003070517 | Esophagus | HGIN | cytoskeleton-dependent intracellular transport | 45/2587 | 195/18723 | 3.07e-04 | 5.15e-03 | 45 |
| GO:00109707 | Esophagus | HGIN | transport along microtubule | 35/2587 | 155/18723 | 2.01e-03 | 2.12e-02 | 35 |
| GO:003070518 | Esophagus | ESCC | cytoskeleton-dependent intracellular transport | 133/8552 | 195/18723 | 1.48e-10 | 4.27e-09 | 133 |
| GO:001097013 | Esophagus | ESCC | transport along microtubule | 107/8552 | 155/18723 | 3.17e-09 | 6.80e-08 | 107 |
| GO:003150314 | Esophagus | ESCC | protein-containing complex localization | 139/8552 | 220/18723 | 1.14e-07 | 1.85e-06 | 139 |
| GO:00991114 | Esophagus | ESCC | microtubule-based transport | 115/8552 | 190/18723 | 2.54e-05 | 2.15e-04 | 115 |
| GO:003070511 | Liver | Cirrhotic | cytoskeleton-dependent intracellular transport | 68/4634 | 195/18723 | 9.54e-04 | 6.77e-03 | 68 |
| GO:0031503 | Liver | Cirrhotic | protein-containing complex localization | 75/4634 | 220/18723 | 1.13e-03 | 7.73e-03 | 75 |
| GO:00109701 | Liver | Cirrhotic | transport along microtubule | 52/4634 | 155/18723 | 8.42e-03 | 3.91e-02 | 52 |
| GO:00315031 | Liver | HCC | protein-containing complex localization | 129/7958 | 220/18723 | 9.38e-07 | 1.42e-05 | 129 |
| GO:003070521 | Liver | HCC | cytoskeleton-dependent intracellular transport | 111/7958 | 195/18723 | 3.25e-05 | 3.28e-04 | 111 |
| GO:00109702 | Liver | HCC | transport along microtubule | 90/7958 | 155/18723 | 6.49e-05 | 5.92e-04 | 90 |
| GO:003070510 | Oral cavity | OSCC | cytoskeleton-dependent intracellular transport | 113/7305 | 195/18723 | 6.03e-08 | 1.09e-06 | 113 |
| GO:00315034 | Oral cavity | OSCC | protein-containing complex localization | 123/7305 | 220/18723 | 2.54e-07 | 4.00e-06 | 123 |
| GO:00109706 | Oral cavity | OSCC | transport along microtubule | 88/7305 | 155/18723 | 5.35e-06 | 6.02e-05 | 88 |
| GO:00991113 | Oral cavity | OSCC | microtubule-based transport | 96/7305 | 190/18723 | 7.92e-04 | 4.27e-03 | 96 |
| Page: 1 2 3 |
| Pathway ID | Tissue | Disease Stage | Description | Gene Ratio | Bg Ratio | pvalue | p.adjust | qvalue | Count |
| Page: 1 |
Top |
Cell-cell communication analysis |
| Identification of potential cell-cell interactions between two cell types and their ligand-receptor pairs for different disease states |
| Ligand | Receptor | LRpair | Pathway | Tissue | Disease Stage |
| Page: 1 |
Top |
Single-cell gene regulatory network inference analysis |
| Find out the significant the regulons (TFs) and the target genes of each regulon across cell types for different disease states |
| TF | Cell Type | Tissue | Disease Stage | Target Gene | RSS | Regulon Activity |
| ∗The dot plots of a searched regulon are shown for all cell subpopulations in each disease state of each tissue based on the regulon specific score inferred using pySCENIC and by calculating the average expression. |
| Page: 1 |
Top |
Somatic mutation of malignant transformation related genes |
| Annotation of somatic variants for genes involved in malignant transformation |
| Hugo Symbol | Variant Class | Variant Classification | dbSNP RS | HGVSc | HGVSp | HGVSp Short | SWISSPROT | BIOTYPE | SIFT | PolyPhen | Tumor Sample Barcode | Tissue | Histology | Sex | Age | Stage | Therapy Types | Drugs | Outcome |
| SSNA1 | SNV | Missense_Mutation | c.154N>A | p.Glu52Lys | p.E52K | O43805 | protein_coding | tolerated(0.2) | benign(0.073) | TCGA-BH-A0W5-01 | Breast | breast invasive carcinoma | Female | >=65 | I/II | Hormone Therapy | arimidex | CR | |
| SSNA1 | SNV | Missense_Mutation | c.106G>C | p.Glu36Gln | p.E36Q | O43805 | protein_coding | tolerated(0.1) | possibly_damaging(0.9) | TCGA-C8-A26Y-01 | Breast | breast invasive carcinoma | Female | >=65 | I/II | Unknown | Unknown | SD | |
| SSNA1 | SNV | Missense_Mutation | c.295N>A | p.Glu99Lys | p.E99K | O43805 | protein_coding | deleterious(0) | possibly_damaging(0.67) | TCGA-EK-A3GJ-01 | Cervix | cervical & endocervical cancer | Female | <65 | I/II | Unknown | Unknown | SD | |
| SSNA1 | SNV | Missense_Mutation | novel | c.163N>A | p.Ala55Thr | p.A55T | O43805 | protein_coding | tolerated(0.29) | possibly_damaging(0.462) | TCGA-DF-A2KU-01 | Endometrium | uterine corpus endometrioid carcinoma | Female | Unknown | I/II | Unknown | Unknown | SD |
| SSNA1 | SNV | Missense_Mutation | novel | c.55A>G | p.Ile19Val | p.I19V | O43805 | protein_coding | deleterious(0.05) | benign(0.048) | TCGA-DD-AACZ-01 | Liver | liver hepatocellular carcinoma | Female | <65 | I/II | Unknown | Unknown | PD |
| Page: 1 |
Top |
Related drugs of malignant transformation related genes |
| Identification of chemicals and drugs interact with genes involved in malignant transfromation |
| (DGIdb 4.0) |
| Entrez ID | Symbol | Category | Interaction Types | Drug Claim Name | Drug Name | PMIDs |
| Page: 1 |

Copyright 2023-Present -The University of Texas Health Science Center at Houston |