
|
|||||
|
 | |
| |
| |
| |
| |
| |
|
Gene: SMAD2 |
Gene summary for SMAD2 |
| Gene information | Species | Human | Gene symbol | SMAD2 | Gene ID | 4087 |
| Gene name | SMAD family member 2 | |
| Gene Alias | JV18 | |
| Cytomap | 18q21.1 | |
| Gene Type | protein-coding | GO ID | GO:0000578 | UniProtAcc | Q15796 |
Top |
Malignant transformation analysis |
| Identification of the aberrant gene expression in precancerous and cancerous lesions by comparing the gene expression of stem-like cells in diseased tissues with normal stem cells |
| Entrez ID | Symbol | Replicates | Species | Organ | Tissue | Adj P-value | Log2FC | Malignancy |
| 4087 | SMAD2 | S43 | Human | Liver | Cirrhotic | 9.23e-04 | 7.17e-02 | -0.0187 |
| 4087 | SMAD2 | HCC1_Meng | Human | Liver | HCC | 9.64e-59 | 3.73e-03 | 0.0246 |
| 4087 | SMAD2 | HCC2_Meng | Human | Liver | HCC | 2.18e-16 | -2.52e-02 | 0.0107 |
| 4087 | SMAD2 | cirrhotic2 | Human | Liver | Cirrhotic | 3.10e-04 | 1.06e-01 | 0.0201 |
| 4087 | SMAD2 | cirrhotic3 | Human | Liver | Cirrhotic | 5.53e-04 | 5.04e-02 | 0.0215 |
| 4087 | SMAD2 | HCC1 | Human | Liver | HCC | 1.32e-05 | 3.04e+00 | 0.5336 |
| 4087 | SMAD2 | HCC2 | Human | Liver | HCC | 2.05e-10 | 3.80e+00 | 0.5341 |
| 4087 | SMAD2 | Pt13.b | Human | Liver | HCC | 2.84e-08 | 4.17e-02 | 0.0251 |
| 4087 | SMAD2 | S014 | Human | Liver | HCC | 3.98e-13 | 7.56e-01 | 0.2254 |
| 4087 | SMAD2 | S015 | Human | Liver | HCC | 4.02e-12 | 7.10e-01 | 0.2375 |
| 4087 | SMAD2 | S016 | Human | Liver | HCC | 6.81e-12 | 5.95e-01 | 0.2243 |
| 4087 | SMAD2 | S027 | Human | Liver | HCC | 5.64e-06 | 8.15e-01 | 0.2446 |
| 4087 | SMAD2 | S028 | Human | Liver | HCC | 2.13e-18 | 9.05e-01 | 0.2503 |
| 4087 | SMAD2 | S029 | Human | Liver | HCC | 2.44e-20 | 9.05e-01 | 0.2581 |
| 4087 | SMAD2 | RNA-P17T-P17T-2 | Human | Lung | IAC | 5.44e-04 | 4.70e-01 | 0.3371 |
| 4087 | SMAD2 | RNA-P17T-P17T-4 | Human | Lung | IAC | 1.62e-02 | 4.49e-01 | 0.343 |
| 4087 | SMAD2 | RNA-P17T-P17T-6 | Human | Lung | IAC | 1.04e-03 | 3.41e-01 | 0.3385 |
| 4087 | SMAD2 | RNA-P17T-P17T-8 | Human | Lung | IAC | 1.71e-02 | 3.08e-01 | 0.3329 |
| 4087 | SMAD2 | RNA-P25T1-P25T1-1 | Human | Lung | AIS | 6.74e-15 | 6.66e-01 | -0.2116 |
| 4087 | SMAD2 | RNA-P25T1-P25T1-2 | Human | Lung | AIS | 7.93e-05 | 6.01e-01 | -0.1941 |
| Page: 1 2 3 4 5 6 7 8 9 10 |
| Tissue | Expression Dynamics | Abbreviation |
| Colorectum (GSE201348) | 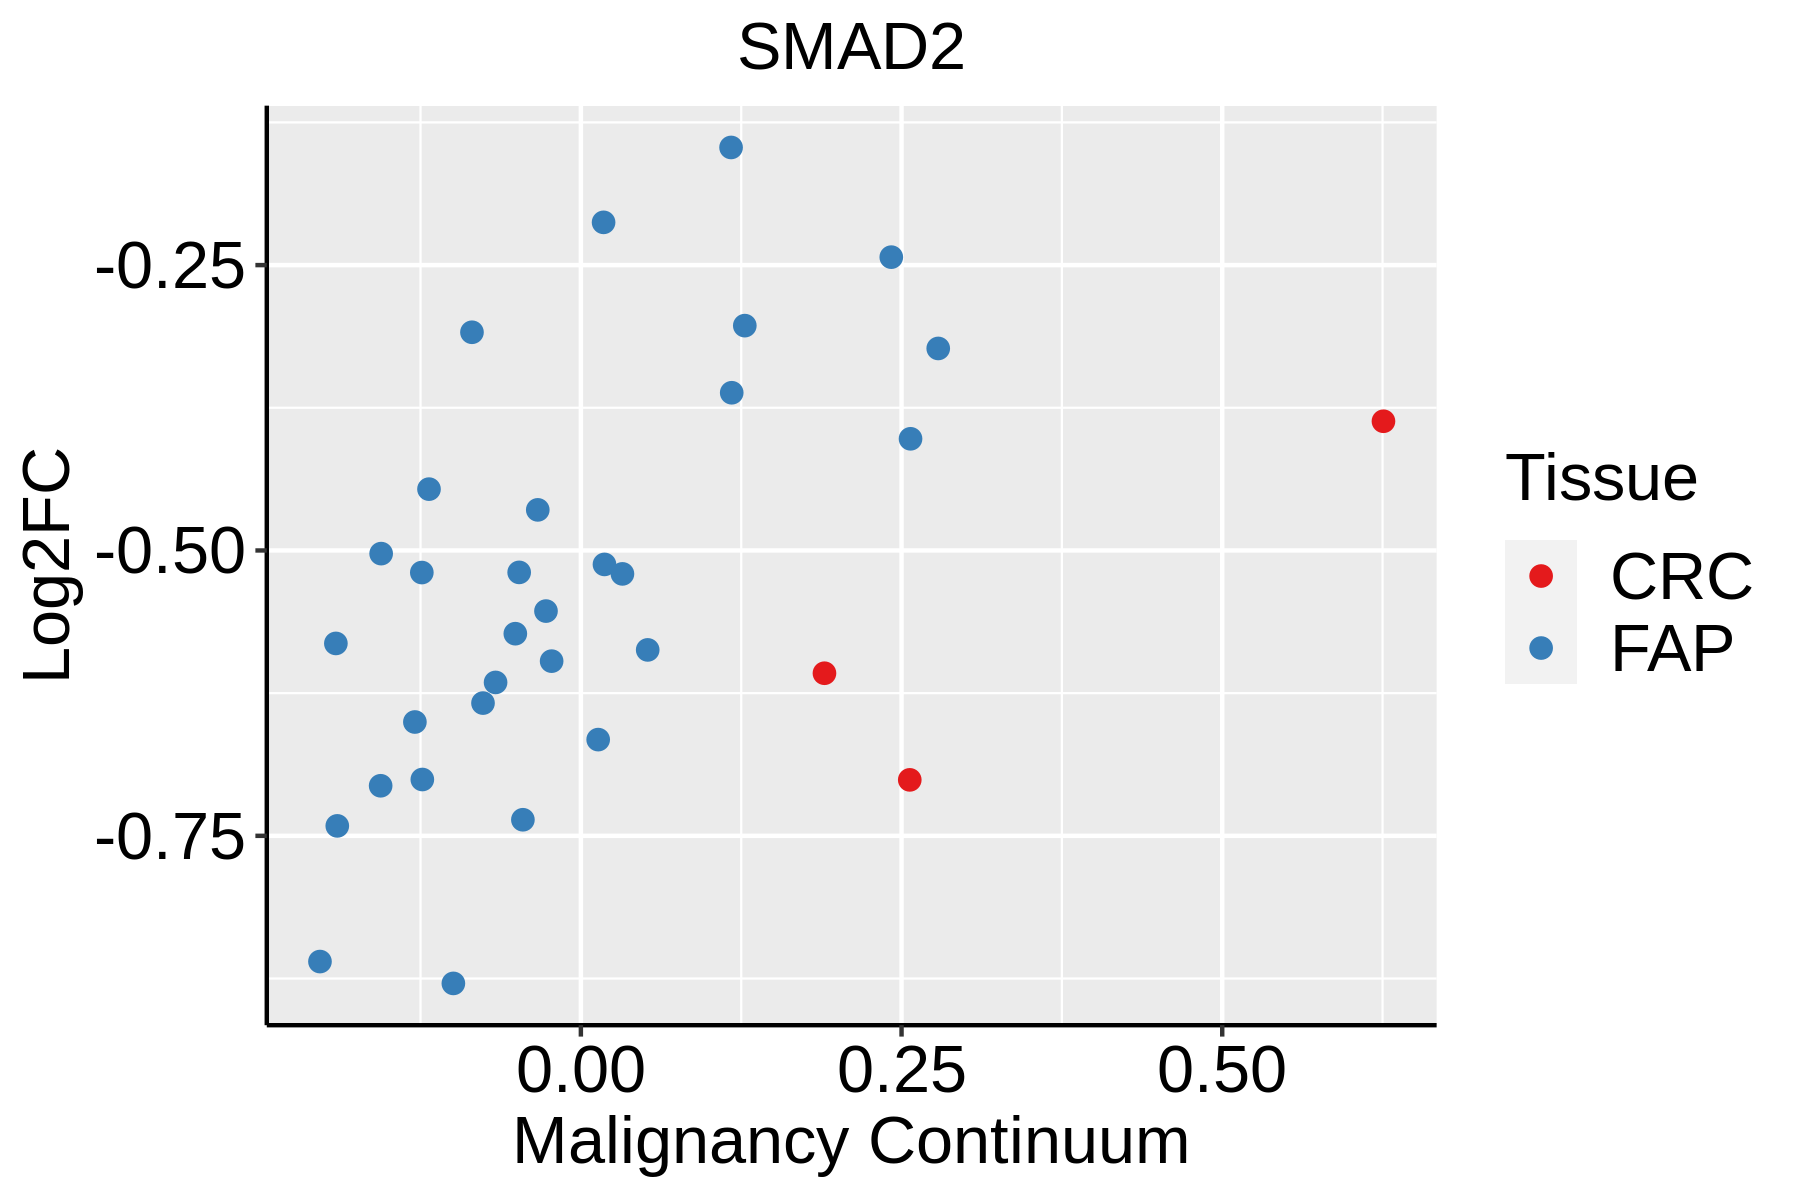 | FAP: Familial adenomatous polyposis |
| CRC: Colorectal cancer | ||
| Colorectum (HTA11) |  | AD: Adenomas |
| SER: Sessile serrated lesions | ||
| MSI-H: Microsatellite-high colorectal cancer | ||
| MSS: Microsatellite stable colorectal cancer | ||
| Esophagus |  | ESCC: Esophageal squamous cell carcinoma |
| HGIN: High-grade intraepithelial neoplasias | ||
| LGIN: Low-grade intraepithelial neoplasias | ||
| Liver | 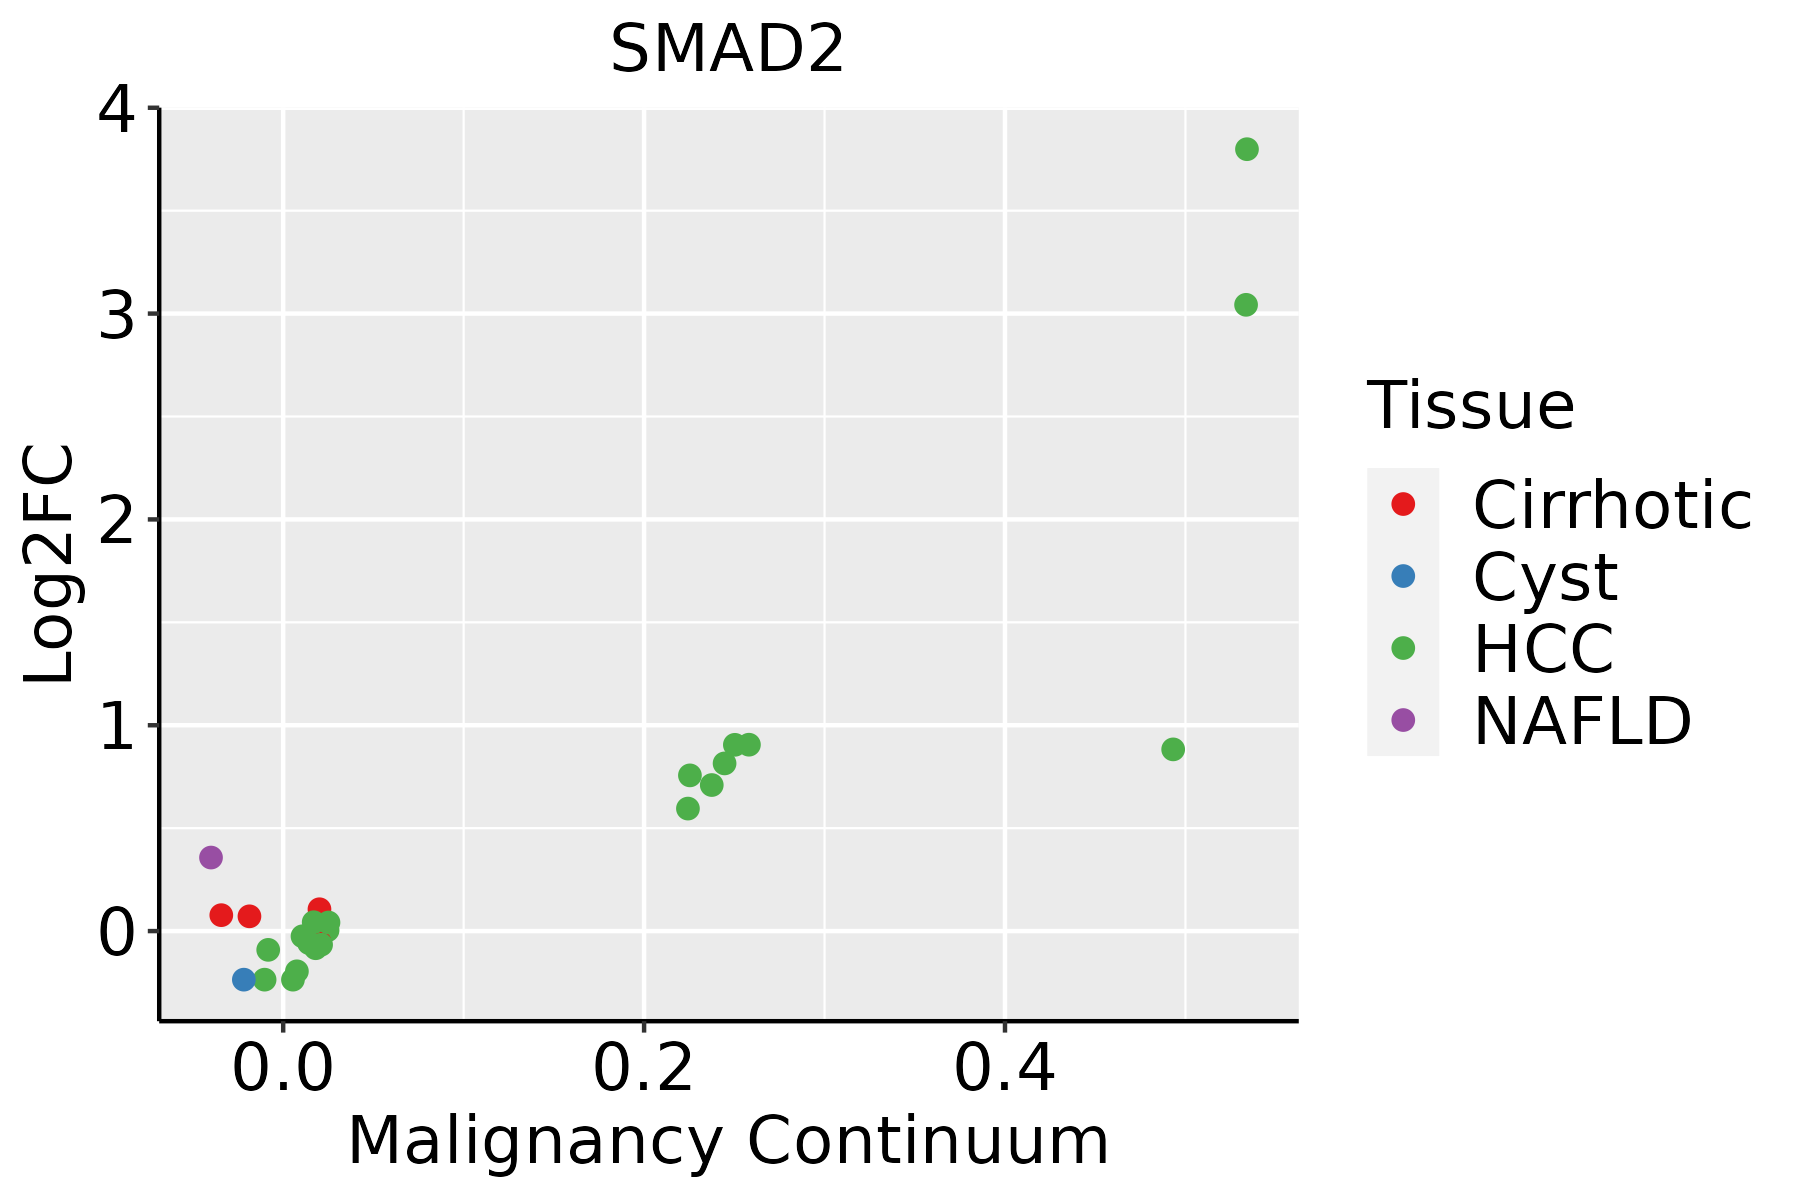 | HCC: Hepatocellular carcinoma |
| NAFLD: Non-alcoholic fatty liver disease | ||
| Lung |  | AAH: Atypical adenomatous hyperplasia |
| AIS: Adenocarcinoma in situ | ||
| IAC: Invasive lung adenocarcinoma | ||
| MIA: Minimally invasive adenocarcinoma | ||
| Oral Cavity | 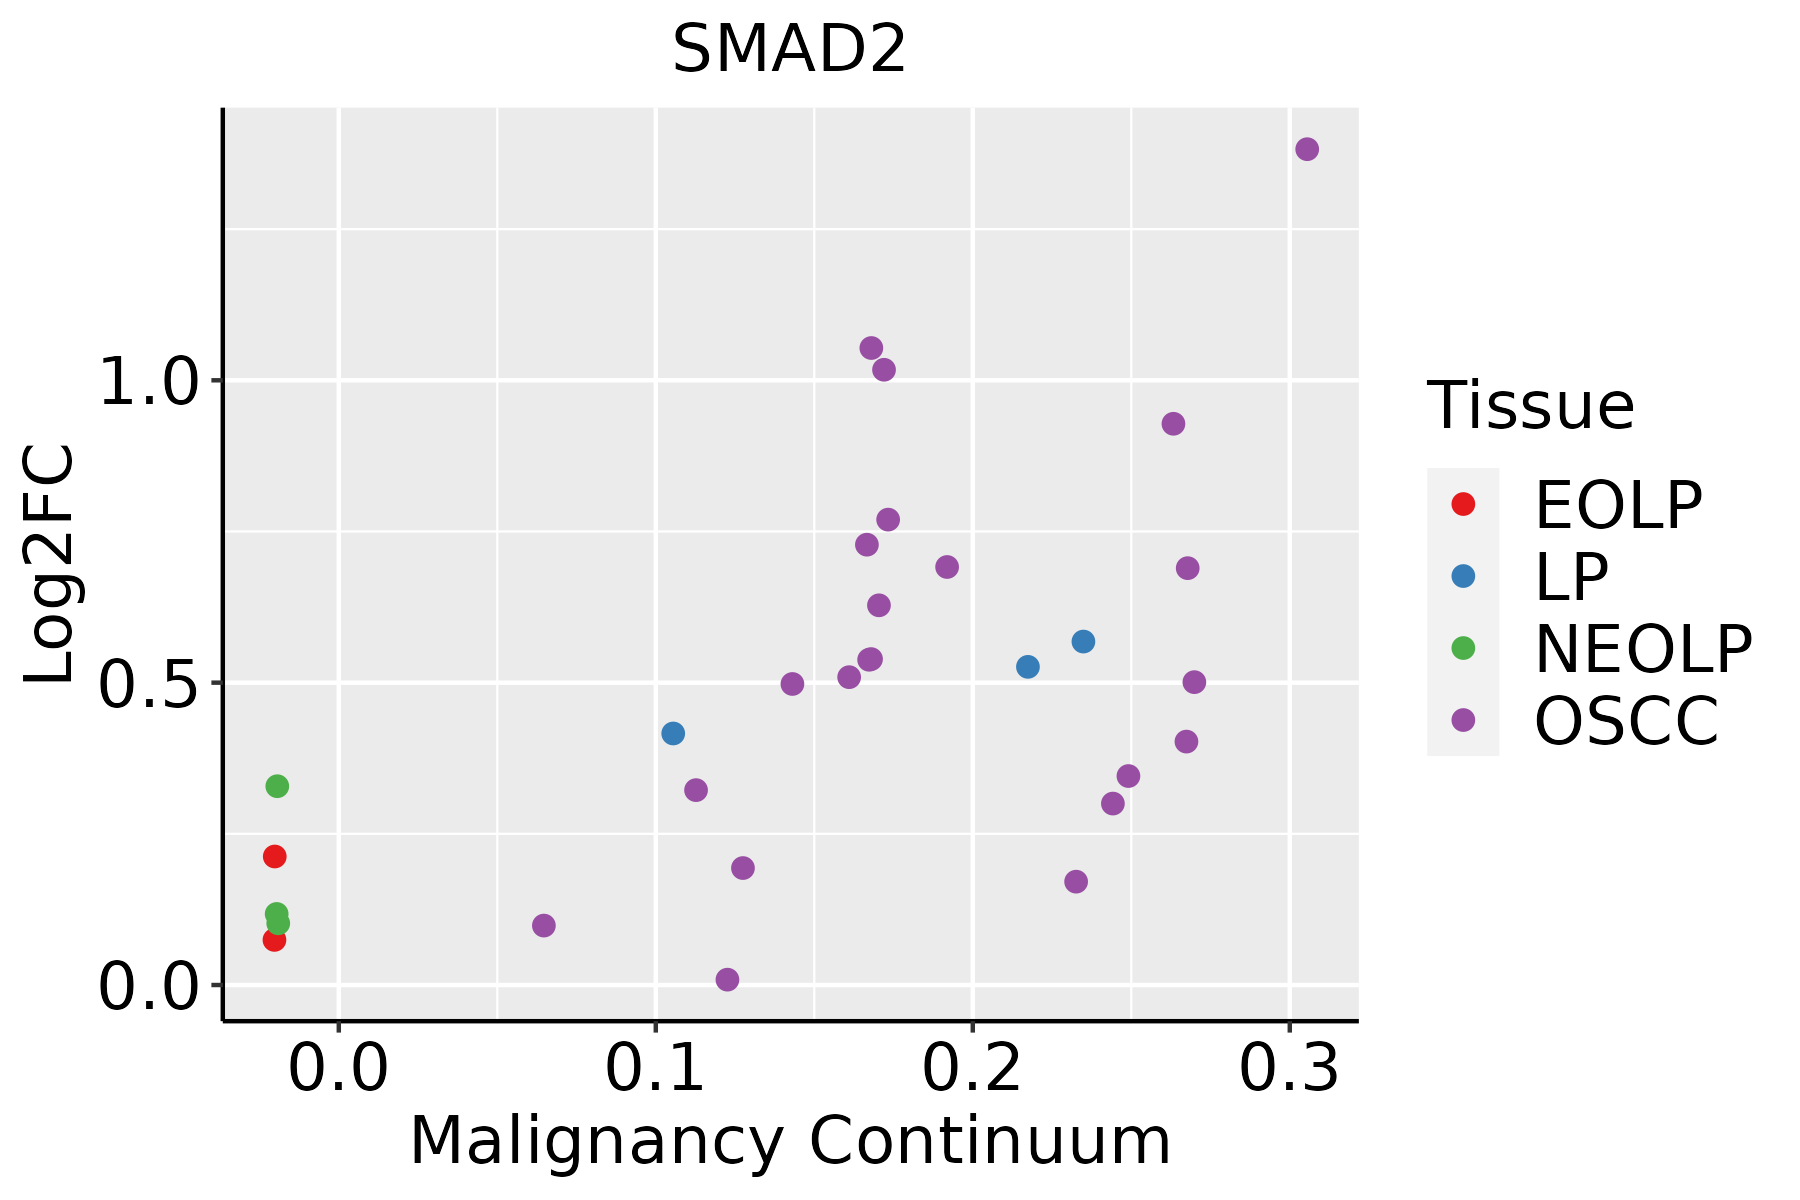 | EOLP: Erosive Oral lichen planus |
| LP: leukoplakia | ||
| NEOLP: Non-erosive oral lichen planus | ||
| OSCC: Oral squamous cell carcinoma | ||
| Skin |  | AK: Actinic keratosis |
| cSCC: Cutaneous squamous cell carcinoma | ||
| SCCIS:squamous cell carcinoma in situ | ||
| Thyroid |  | ATC: Anaplastic thyroid cancer |
| HT: Hashimoto's thyroiditis | ||
| PTC: Papillary thyroid cancer |
| ∗log2FC in expression of this searched gene in stem-like cells from each diseased tissue sample relative to stem-like cells in normal samples in each tissue plotted against the malignancy continuum. Samples are colored based on if they are from different disease stage. |
Top |
Malignant transformation related pathway analysis |
| Find out the enriched GO biological processes and KEGG pathways involved in transition from healthy to precancer to cancer |
| Tissue | Disease Stage | Enriched GO biological Processes |
| Colorectum | AD |  |
| Colorectum | SER |  |
| Colorectum | MSS |  |
| Colorectum | MSI-H |  |
| Colorectum | FAP |  |
| ∗Top 15 enriched GO BP terms are showed in the bar plot of each disease state in each tissue. Each row represents a significant GO biological process which is colored according to the -log10(p.adjust). |
| Page: 1 2 3 4 5 6 7 8 9 |
| GO ID | Tissue | Disease Stage | Description | Gene Ratio | Bg Ratio | pvalue | p.adjust | Count |
| GO:0048732 | Colorectum | AD | gland development | 149/3918 | 436/18723 | 6.07e-11 | 6.33e-09 | 149 |
| GO:0051098 | Colorectum | AD | regulation of binding | 126/3918 | 363/18723 | 6.01e-10 | 4.88e-08 | 126 |
| GO:0009743 | Colorectum | AD | response to carbohydrate | 86/3918 | 253/18723 | 8.43e-07 | 2.90e-05 | 86 |
| GO:0042060 | Colorectum | AD | wound healing | 128/3918 | 422/18723 | 2.73e-06 | 7.89e-05 | 128 |
| GO:0034284 | Colorectum | AD | response to monosaccharide | 76/3918 | 225/18723 | 4.64e-06 | 1.23e-04 | 76 |
| GO:0009746 | Colorectum | AD | response to hexose | 73/3918 | 219/18723 | 1.20e-05 | 2.65e-04 | 73 |
| GO:0009749 | Colorectum | AD | response to glucose | 71/3918 | 212/18723 | 1.31e-05 | 2.85e-04 | 71 |
| GO:0001701 | Colorectum | AD | in utero embryonic development | 110/3918 | 367/18723 | 2.36e-05 | 4.62e-04 | 110 |
| GO:0009306 | Colorectum | AD | protein secretion | 105/3918 | 359/18723 | 1.05e-04 | 1.57e-03 | 105 |
| GO:0035592 | Colorectum | AD | establishment of protein localization to extracellular region | 105/3918 | 360/18723 | 1.18e-04 | 1.73e-03 | 105 |
| GO:0071692 | Colorectum | AD | protein localization to extracellular region | 106/3918 | 368/18723 | 1.86e-04 | 2.49e-03 | 106 |
| GO:0030073 | Colorectum | AD | insulin secretion | 61/3918 | 195/18723 | 4.28e-04 | 4.81e-03 | 61 |
| GO:0015833 | Colorectum | AD | peptide transport | 77/3918 | 264/18723 | 8.90e-04 | 8.60e-03 | 77 |
| GO:0007178 | Colorectum | AD | transmembrane receptor protein serine/threonine kinase signaling pathway | 99/3918 | 355/18723 | 9.92e-04 | 9.28e-03 | 99 |
| GO:0009791 | Colorectum | AD | post-embryonic development | 29/3918 | 80/18723 | 1.13e-03 | 1.03e-02 | 29 |
| GO:0071559 | Colorectum | AD | response to transforming growth factor beta | 74/3918 | 256/18723 | 1.45e-03 | 1.23e-02 | 74 |
| GO:0071560 | Colorectum | AD | cellular response to transforming growth factor beta stimulus | 72/3918 | 250/18723 | 1.85e-03 | 1.52e-02 | 72 |
| GO:0007179 | Colorectum | AD | transforming growth factor beta receptor signaling pathway | 59/3918 | 198/18723 | 1.94e-03 | 1.58e-02 | 59 |
| GO:0030072 | Colorectum | AD | peptide hormone secretion | 68/3918 | 236/18723 | 2.39e-03 | 1.85e-02 | 68 |
| GO:0035196 | Colorectum | AD | production of miRNAs involved in gene silencing by miRNA | 20/3918 | 52/18723 | 2.87e-03 | 2.14e-02 | 20 |
| Page: 1 2 3 4 5 6 7 8 9 10 11 12 13 14 15 16 17 18 19 20 21 22 23 24 25 26 27 28 29 30 31 32 |
| Pathway ID | Tissue | Disease Stage | Description | Gene Ratio | Bg Ratio | pvalue | p.adjust | qvalue | Count |
| hsa05415 | Colorectum | AD | Diabetic cardiomyopathy | 114/2092 | 203/8465 | 3.65e-22 | 3.06e-20 | 1.95e-20 | 114 |
| hsa04144 | Colorectum | AD | Endocytosis | 111/2092 | 251/8465 | 5.95e-12 | 1.42e-10 | 9.08e-11 | 111 |
| hsa05210 | Colorectum | AD | Colorectal cancer | 35/2092 | 86/8465 | 7.54e-04 | 5.49e-03 | 3.50e-03 | 35 |
| hsa05205 | Colorectum | AD | Proteoglycans in cancer | 70/2092 | 205/8465 | 1.37e-03 | 8.46e-03 | 5.39e-03 | 70 |
| hsa05225 | Colorectum | AD | Hepatocellular carcinoma | 59/2092 | 168/8465 | 1.50e-03 | 8.69e-03 | 5.54e-03 | 59 |
| hsa05166 | Colorectum | AD | Human T-cell leukemia virus 1 infection | 72/2092 | 222/8465 | 5.24e-03 | 2.44e-02 | 1.55e-02 | 72 |
| hsa04218 | Colorectum | AD | Cellular senescence | 53/2092 | 156/8465 | 5.55e-03 | 2.48e-02 | 1.58e-02 | 53 |
| hsa05212 | Colorectum | AD | Pancreatic cancer | 29/2092 | 76/8465 | 6.25e-03 | 2.68e-02 | 1.71e-02 | 29 |
| hsa054151 | Colorectum | AD | Diabetic cardiomyopathy | 114/2092 | 203/8465 | 3.65e-22 | 3.06e-20 | 1.95e-20 | 114 |
| hsa041441 | Colorectum | AD | Endocytosis | 111/2092 | 251/8465 | 5.95e-12 | 1.42e-10 | 9.08e-11 | 111 |
| hsa052101 | Colorectum | AD | Colorectal cancer | 35/2092 | 86/8465 | 7.54e-04 | 5.49e-03 | 3.50e-03 | 35 |
| hsa052051 | Colorectum | AD | Proteoglycans in cancer | 70/2092 | 205/8465 | 1.37e-03 | 8.46e-03 | 5.39e-03 | 70 |
| hsa052251 | Colorectum | AD | Hepatocellular carcinoma | 59/2092 | 168/8465 | 1.50e-03 | 8.69e-03 | 5.54e-03 | 59 |
| hsa051661 | Colorectum | AD | Human T-cell leukemia virus 1 infection | 72/2092 | 222/8465 | 5.24e-03 | 2.44e-02 | 1.55e-02 | 72 |
| hsa042181 | Colorectum | AD | Cellular senescence | 53/2092 | 156/8465 | 5.55e-03 | 2.48e-02 | 1.58e-02 | 53 |
| hsa052121 | Colorectum | AD | Pancreatic cancer | 29/2092 | 76/8465 | 6.25e-03 | 2.68e-02 | 1.71e-02 | 29 |
| hsa054152 | Colorectum | SER | Diabetic cardiomyopathy | 103/1580 | 203/8465 | 1.45e-25 | 1.61e-23 | 1.17e-23 | 103 |
| hsa041442 | Colorectum | SER | Endocytosis | 81/1580 | 251/8465 | 1.14e-07 | 2.36e-06 | 1.71e-06 | 81 |
| hsa052052 | Colorectum | SER | Proteoglycans in cancer | 58/1580 | 205/8465 | 4.37e-04 | 3.82e-03 | 2.77e-03 | 58 |
| hsa04350 | Colorectum | SER | TGF-beta signaling pathway | 31/1580 | 108/8465 | 7.00e-03 | 3.77e-02 | 2.74e-02 | 31 |
| Page: 1 2 3 4 5 6 7 8 9 10 11 12 13 14 15 16 |
Top |
Cell-cell communication analysis |
| Identification of potential cell-cell interactions between two cell types and their ligand-receptor pairs for different disease states |
| Ligand | Receptor | LRpair | Pathway | Tissue | Disease Stage |
| Page: 1 |
Top |
Single-cell gene regulatory network inference analysis |
| Find out the significant the regulons (TFs) and the target genes of each regulon across cell types for different disease states |
| TF | Cell Type | Tissue | Disease Stage | Target Gene | RSS | Regulon Activity |
| SMAD2 | CD4TN | Colorectum | CRC | RPAP3,CRTC3-AS1,PRUNE2, etc. | 6.12e-02 |  |
| SMAD2 | TFH | Colorectum | CRC | RPAP3,CRTC3-AS1,PRUNE2, etc. | 9.06e-03 | |
| SMAD2 | CD8TEXINT | Colorectum | MSS | RPAP3,CRTC3-AS1,PRUNE2, etc. | 6.24e-02 |  |
| SMAD2 | ILC | Colorectum | MSS | RPAP3,CRTC3-AS1,PRUNE2, etc. | 4.40e-02 | |
| SMAD2 | cDC | Lung | AAH | FDPS,MSMO1,MARCKSL1, etc. | 6.88e-02 |  |
| ∗The dot plots of a searched regulon are shown for all cell subpopulations in each disease state of each tissue based on the regulon specific score inferred using pySCENIC and by calculating the average expression. |
| Page: 1 |
Top |
Somatic mutation of malignant transformation related genes |
| Annotation of somatic variants for genes involved in malignant transformation |
| Hugo Symbol | Variant Class | Variant Classification | dbSNP RS | HGVSc | HGVSp | HGVSp Short | SWISSPROT | BIOTYPE | SIFT | PolyPhen | Tumor Sample Barcode | Tissue | Histology | Sex | Age | Stage | Therapy Types | Drugs | Outcome |
| SMAD2 | SNV | Missense_Mutation | c.433N>T | p.Ala145Ser | p.A145S | Q15796 | protein_coding | tolerated(0.33) | possibly_damaging(0.51) | TCGA-A8-A07R-01 | Breast | breast invasive carcinoma | Female | >=65 | III/IV | Ancillary | zoledronic | SD | |
| SMAD2 | SNV | Missense_Mutation | c.1324N>G | p.Leu442Val | p.L442V | Q15796 | protein_coding | deleterious(0) | probably_damaging(1) | TCGA-A8-A093-01 | Breast | breast invasive carcinoma | Female | <65 | I/II | Hormone Therapy | tamoxiphen | SD | |
| SMAD2 | SNV | Missense_Mutation | novel | c.159N>T | p.Lys53Asn | p.K53N | Q15796 | protein_coding | deleterious(0.01) | probably_damaging(0.999) | TCGA-AN-A046-01 | Breast | breast invasive carcinoma | Female | >=65 | I/II | Unknown | Unknown | SD |
| SMAD2 | SNV | Missense_Mutation | c.933C>G | p.Phe311Leu | p.F311L | Q15796 | protein_coding | deleterious(0.01) | probably_damaging(1) | TCGA-C8-A274-01 | Breast | breast invasive carcinoma | Female | <65 | I/II | Hormone Therapy | tamoxiphen | SD | |
| SMAD2 | SNV | Missense_Mutation | c.1067N>G | p.Phe356Cys | p.F356C | Q15796 | protein_coding | deleterious(0.01) | probably_damaging(0.999) | TCGA-E2-A152-01 | Breast | breast invasive carcinoma | Female | <65 | I/II | Targeted Molecular therapy | trastuzumab | PD | |
| SMAD2 | insertion | Frame_Shift_Ins | novel | c.430_431insTTTTCTTTTGC | p.Lys144IlefsTer23 | p.K144Ifs*23 | Q15796 | protein_coding | TCGA-A8-A07R-01 | Breast | breast invasive carcinoma | Female | >=65 | III/IV | Ancillary | zoledronic | SD | ||
| SMAD2 | SNV | Missense_Mutation | novel | c.163N>G | p.Thr55Ala | p.T55A | Q15796 | protein_coding | tolerated(0.14) | possibly_damaging(0.491) | TCGA-2W-A8YY-01 | Cervix | cervical & endocervical cancer | Female | <65 | I/II | Chemotherapy | cisplatin | CR |
| SMAD2 | SNV | Missense_Mutation | c.962G>A | p.Arg321Gln | p.R321Q | Q15796 | protein_coding | deleterious(0.03) | probably_damaging(1) | TCGA-A6-A565-01 | Colorectum | colon adenocarcinoma | Female | <65 | III/IV | Unspecific | 5FU | PD | |
| SMAD2 | SNV | Missense_Mutation | c.1283G>A | p.Arg428Lys | p.R428K | Q15796 | protein_coding | deleterious(0) | probably_damaging(0.936) | TCGA-AA-3663-01 | Colorectum | colon adenocarcinoma | Male | <65 | I/II | Unknown | Unknown | SD | |
| SMAD2 | SNV | Missense_Mutation | c.914N>A | p.Pro305Gln | p.P305Q | Q15796 | protein_coding | deleterious(0) | probably_damaging(1) | TCGA-AA-3864-01 | Colorectum | colon adenocarcinoma | Male | >=65 | I/II | Unknown | Unknown | SD |
| Page: 1 2 3 4 5 6 7 8 |
Top |
Related drugs of malignant transformation related genes |
| Identification of chemicals and drugs interact with genes involved in malignant transfromation |
| (DGIdb 4.0) |
| Entrez ID | Symbol | Category | Interaction Types | Drug Claim Name | Drug Name | PMIDs |
| 4087 | SMAD2 | KINASE, CLINICALLY ACTIONABLE, TRANSCRIPTION FACTOR COMPLEX | GERANIIN | GERANIIN | 26169124 | |
| 4087 | SMAD2 | KINASE, CLINICALLY ACTIONABLE, TRANSCRIPTION FACTOR COMPLEX | DEMETHOXYCURCUMIN | DEMETHOXYCURCUMIN | 23145932 | |
| 4087 | SMAD2 | KINASE, CLINICALLY ACTIONABLE, TRANSCRIPTION FACTOR COMPLEX | ATRA | TRETINOIN | 15799023 | |
| 4087 | SMAD2 | KINASE, CLINICALLY ACTIONABLE, TRANSCRIPTION FACTOR COMPLEX | BLEOMYCIN | BLEOMYCIN | 17274978 | |
| 4087 | SMAD2 | KINASE, CLINICALLY ACTIONABLE, TRANSCRIPTION FACTOR COMPLEX | BISDEMETHOXYCURCUMIN | BISDEMETHOXYCURCUMIN | 23145932 | |
| 4087 | SMAD2 | KINASE, CLINICALLY ACTIONABLE, TRANSCRIPTION FACTOR COMPLEX | HYDROCORTISONE | HYDROCORTISONE | 16644034 | |
| 4087 | SMAD2 | KINASE, CLINICALLY ACTIONABLE, TRANSCRIPTION FACTOR COMPLEX | BLM | BLEOMYCIN | 17274978 | |
| 4087 | SMAD2 | KINASE, CLINICALLY ACTIONABLE, TRANSCRIPTION FACTOR COMPLEX | AMIFOSTINE | AMIFOSTINE | 12410567 | |
| 4087 | SMAD2 | KINASE, CLINICALLY ACTIONABLE, TRANSCRIPTION FACTOR COMPLEX | CURCUMIN | CURCUMIN | 23145932 |
| Page: 1 |

Copyright 2023-Present -The University of Texas Health Science Center at Houston |