
|
|||||
|
 | |
| |
| |
| |
| |
| |
|
Gene: SLC3A2 |
Gene summary for SLC3A2 |
| Gene information | Species | Human | Gene symbol | SLC3A2 | Gene ID | 6520 |
| Gene name | solute carrier family 3 member 2 | |
| Gene Alias | 4F2 | |
| Cytomap | 11q12.3 | |
| Gene Type | protein-coding | GO ID | GO:0003333 | UniProtAcc | J3KPF3 |
Top |
Malignant transformation analysis |
| Identification of the aberrant gene expression in precancerous and cancerous lesions by comparing the gene expression of stem-like cells in diseased tissues with normal stem cells |
| Entrez ID | Symbol | Replicates | Species | Organ | Tissue | Adj P-value | Log2FC | Malignancy |
| 6520 | SLC3A2 | P130T-E | Human | Esophagus | ESCC | 3.54e-63 | 2.49e+00 | 0.1676 |
| 6520 | SLC3A2 | S43 | Human | Liver | Cirrhotic | 4.45e-02 | -9.26e-02 | -0.0187 |
| 6520 | SLC3A2 | HCC1_Meng | Human | Liver | HCC | 1.27e-68 | 3.32e-01 | 0.0246 |
| 6520 | SLC3A2 | HCC2_Meng | Human | Liver | HCC | 9.31e-34 | 1.19e-01 | 0.0107 |
| 6520 | SLC3A2 | cirrhotic1 | Human | Liver | Cirrhotic | 5.05e-06 | 1.91e-01 | 0.0202 |
| 6520 | SLC3A2 | cirrhotic2 | Human | Liver | Cirrhotic | 7.70e-04 | 5.28e-02 | 0.0201 |
| 6520 | SLC3A2 | HCC1 | Human | Liver | HCC | 6.70e-07 | 4.79e+00 | 0.5336 |
| 6520 | SLC3A2 | HCC2 | Human | Liver | HCC | 2.23e-19 | 5.85e+00 | 0.5341 |
| 6520 | SLC3A2 | Pt13.b | Human | Liver | HCC | 1.61e-20 | 3.25e-01 | 0.0251 |
| 6520 | SLC3A2 | Pt14.a | Human | Liver | HCC | 4.49e-03 | 1.98e-01 | 0.0169 |
| 6520 | SLC3A2 | S014 | Human | Liver | HCC | 4.50e-38 | 1.83e+00 | 0.2254 |
| 6520 | SLC3A2 | S015 | Human | Liver | HCC | 7.48e-31 | 1.93e+00 | 0.2375 |
| 6520 | SLC3A2 | S016 | Human | Liver | HCC | 1.22e-34 | 1.92e+00 | 0.2243 |
| 6520 | SLC3A2 | S027 | Human | Liver | HCC | 5.22e-22 | 1.55e+00 | 0.2446 |
| 6520 | SLC3A2 | S028 | Human | Liver | HCC | 2.68e-33 | 1.65e+00 | 0.2503 |
| 6520 | SLC3A2 | S029 | Human | Liver | HCC | 4.53e-32 | 2.09e+00 | 0.2581 |
| 6520 | SLC3A2 | C04 | Human | Oral cavity | OSCC | 1.68e-44 | 3.30e+00 | 0.2633 |
| 6520 | SLC3A2 | C21 | Human | Oral cavity | OSCC | 3.76e-58 | 4.07e+00 | 0.2678 |
| 6520 | SLC3A2 | C30 | Human | Oral cavity | OSCC | 3.53e-43 | 4.41e+00 | 0.3055 |
| 6520 | SLC3A2 | C38 | Human | Oral cavity | OSCC | 1.33e-08 | 1.82e+00 | 0.172 |
| Page: 1 2 3 4 5 6 7 8 9 10 11 |
| Tissue | Expression Dynamics | Abbreviation |
| Breast | 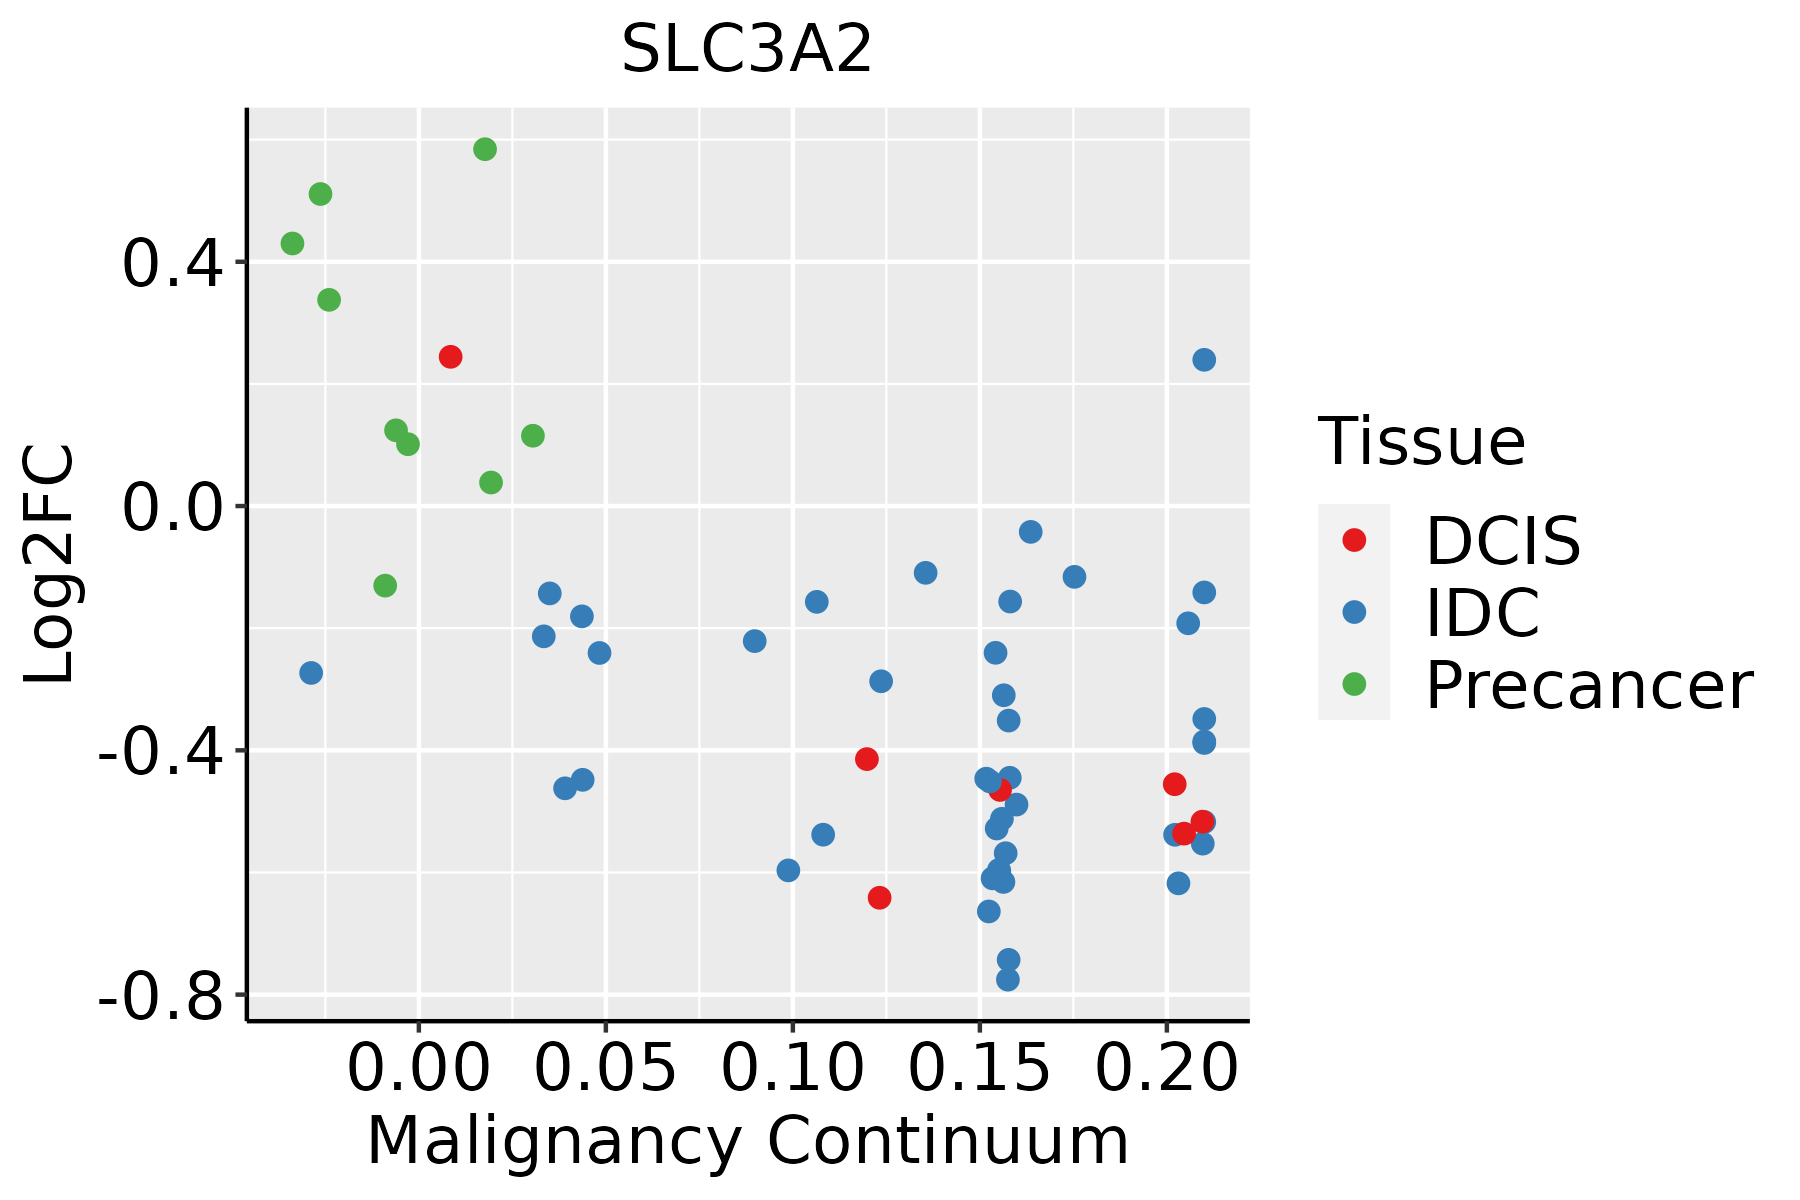 | IDC: Invasive ductal carcinoma |
| DCIS: Ductal carcinoma in situ | ||
| Precancer(BRCA1-mut): Precancerous lesion from BRCA1 mutation carriers | ||
| Colorectum (GSE201348) | 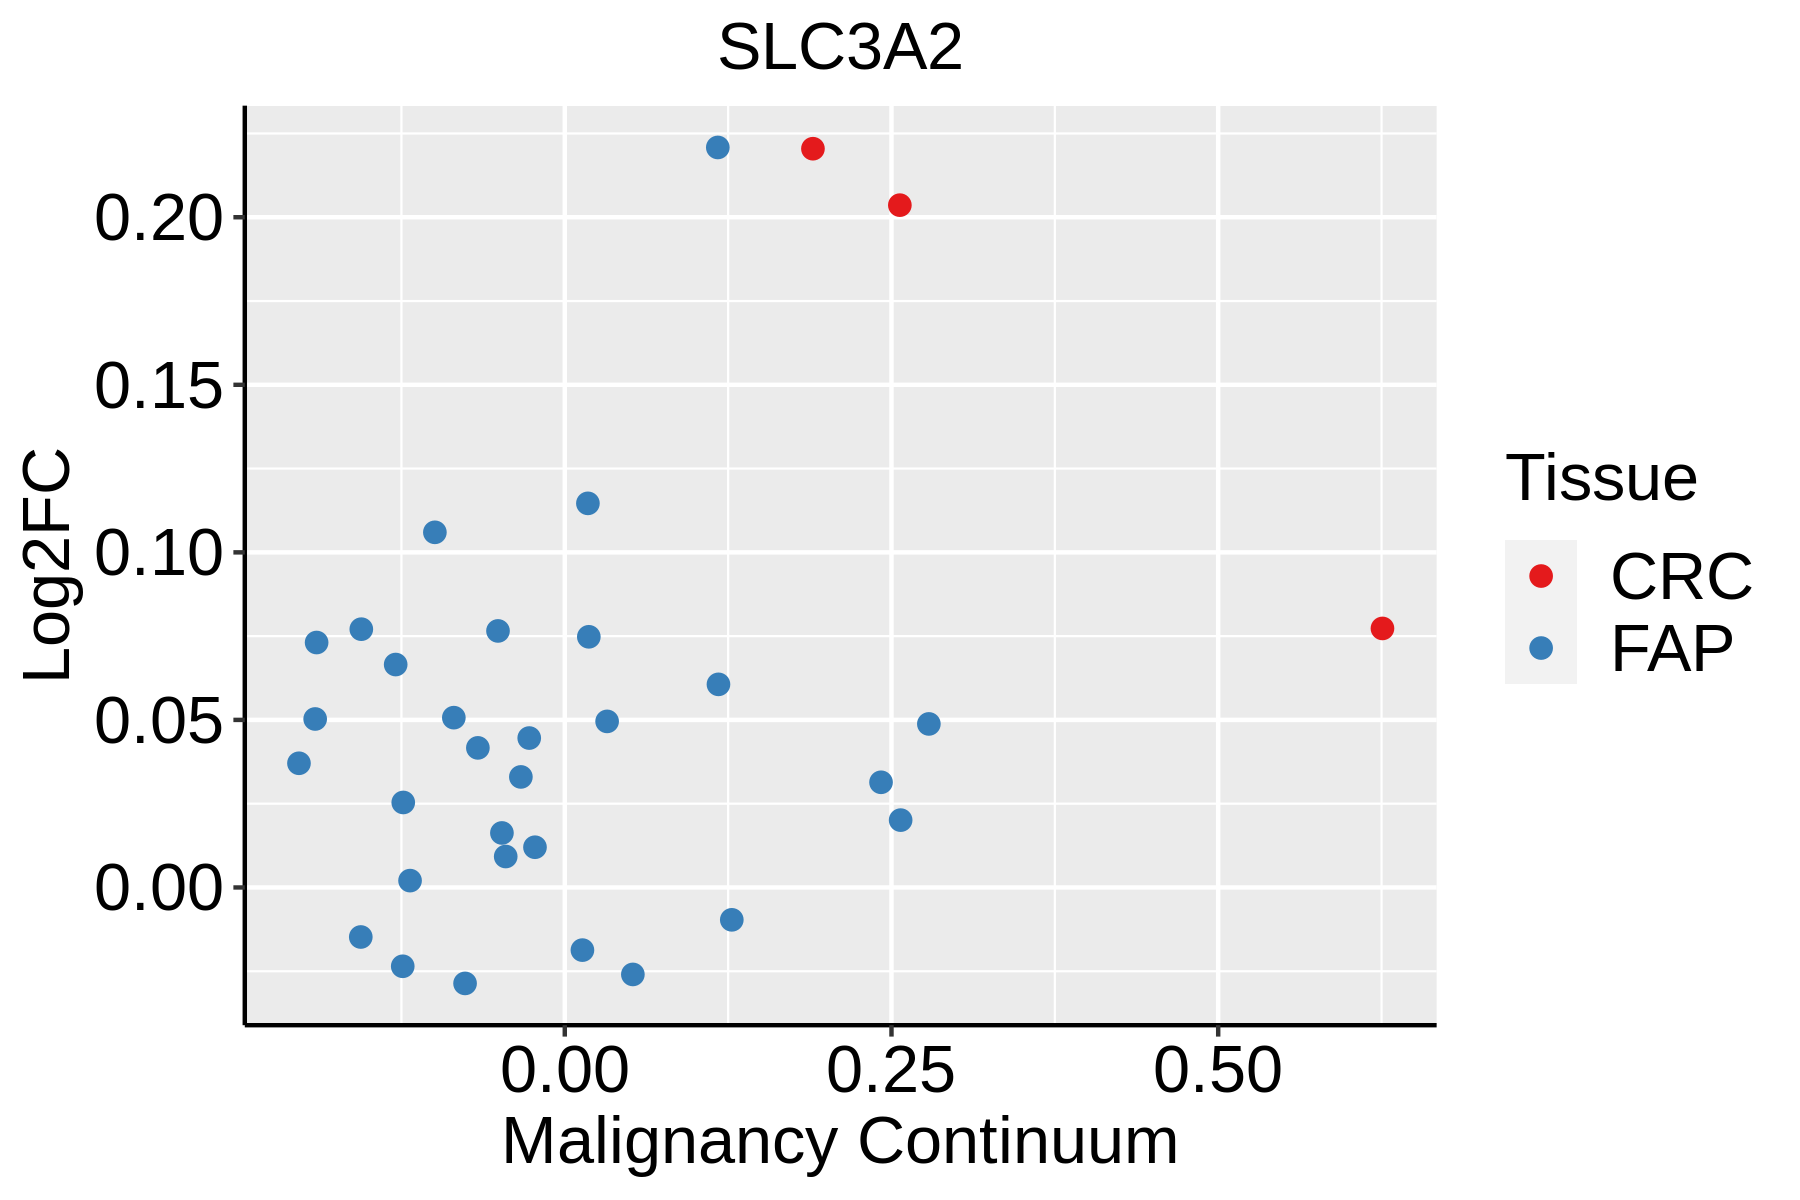 | FAP: Familial adenomatous polyposis |
| CRC: Colorectal cancer | ||
| Colorectum (HTA11) |  | AD: Adenomas |
| SER: Sessile serrated lesions | ||
| MSI-H: Microsatellite-high colorectal cancer | ||
| MSS: Microsatellite stable colorectal cancer | ||
| Endometrium | 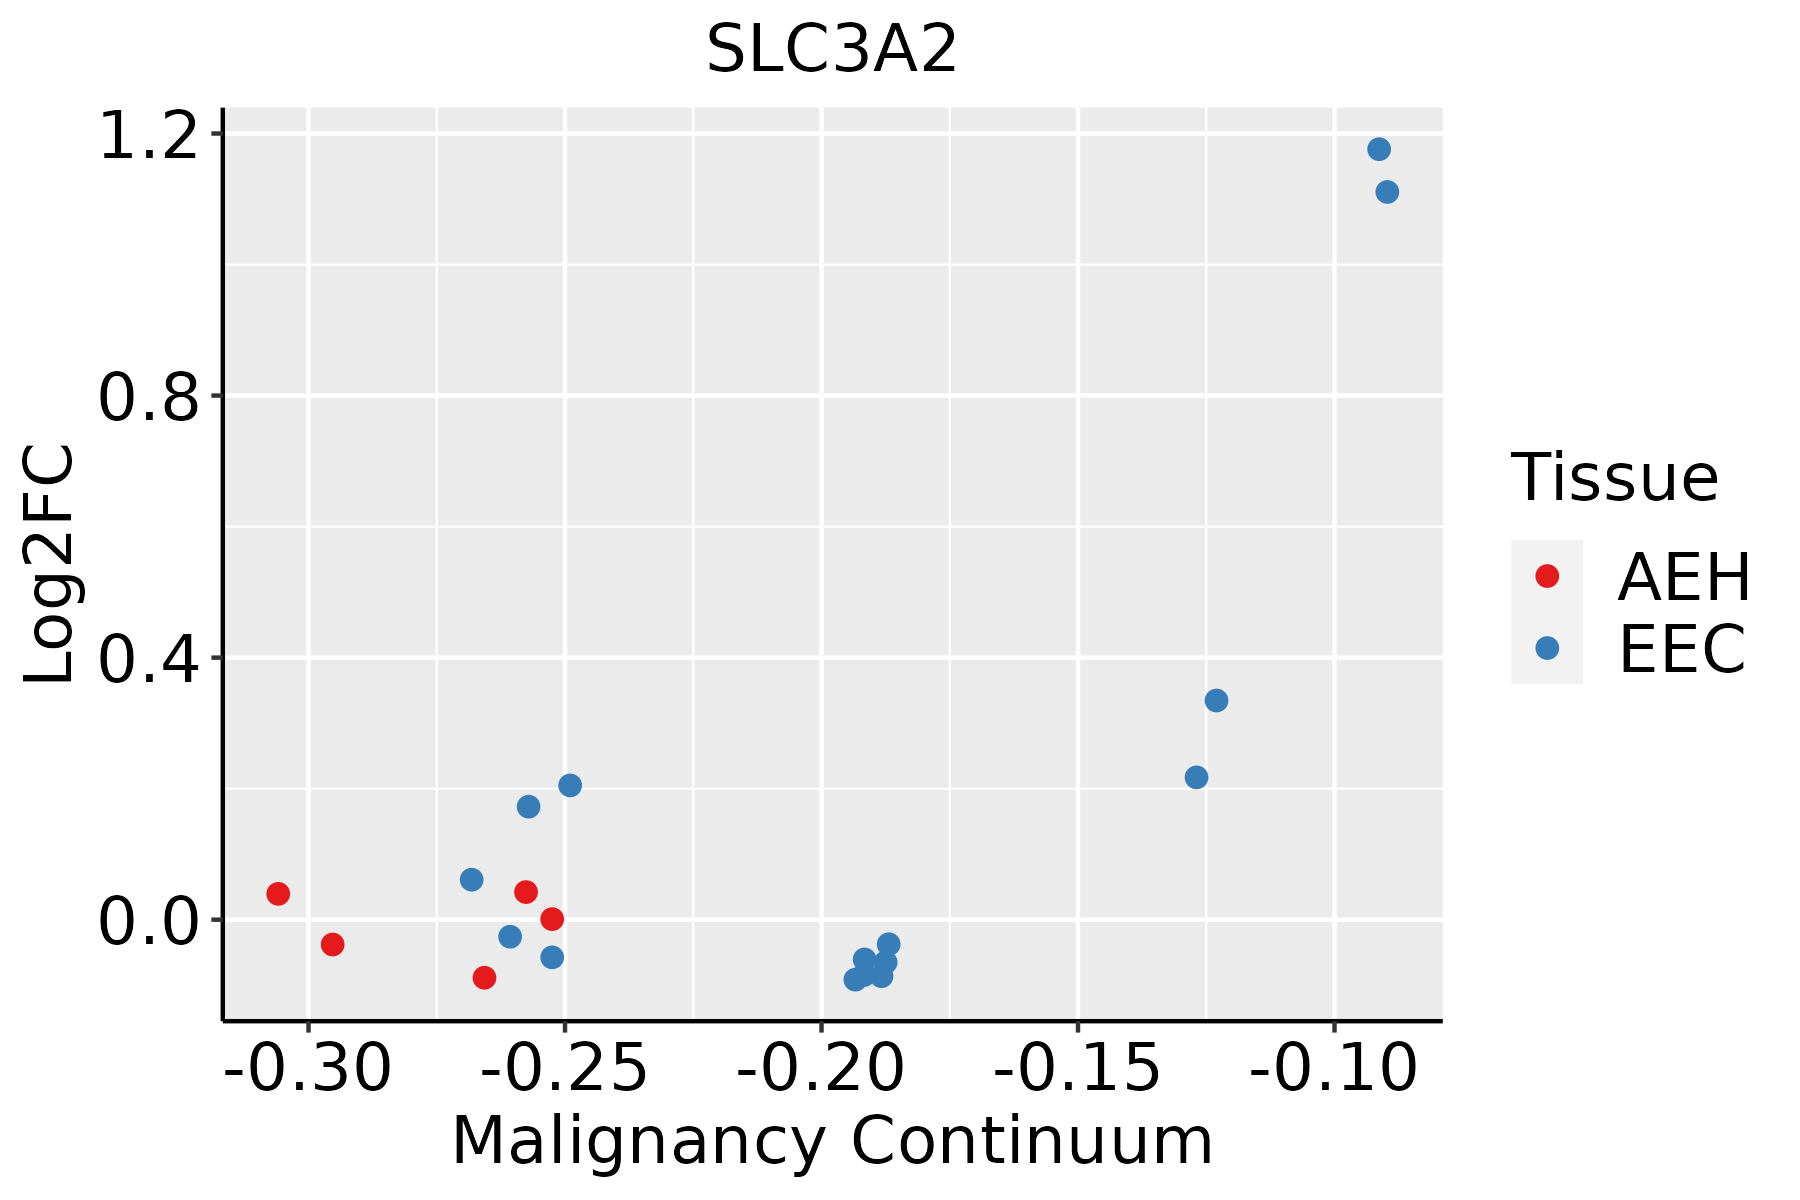 | AEH: Atypical endometrial hyperplasia |
| EEC: Endometrioid Cancer | ||
| Esophagus | 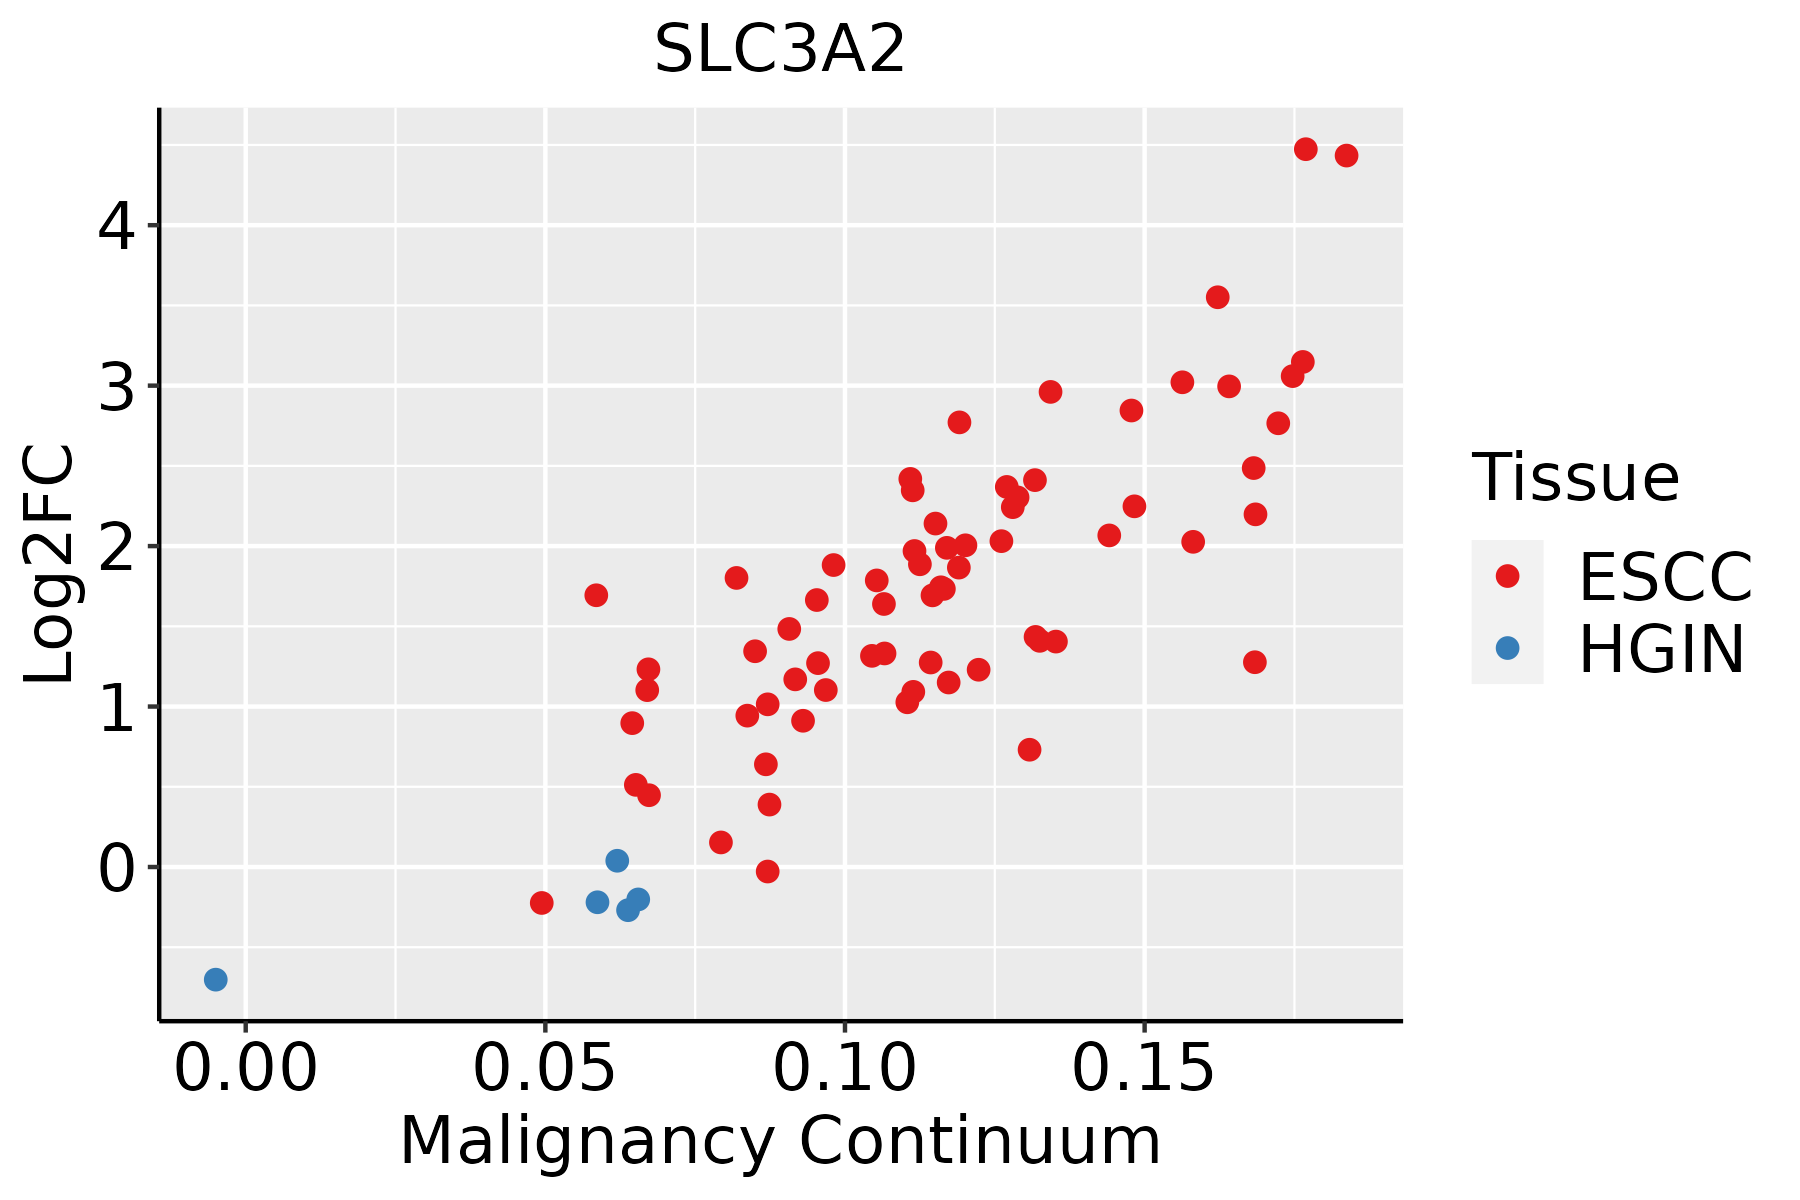 | ESCC: Esophageal squamous cell carcinoma |
| HGIN: High-grade intraepithelial neoplasias | ||
| LGIN: Low-grade intraepithelial neoplasias | ||
| Liver | 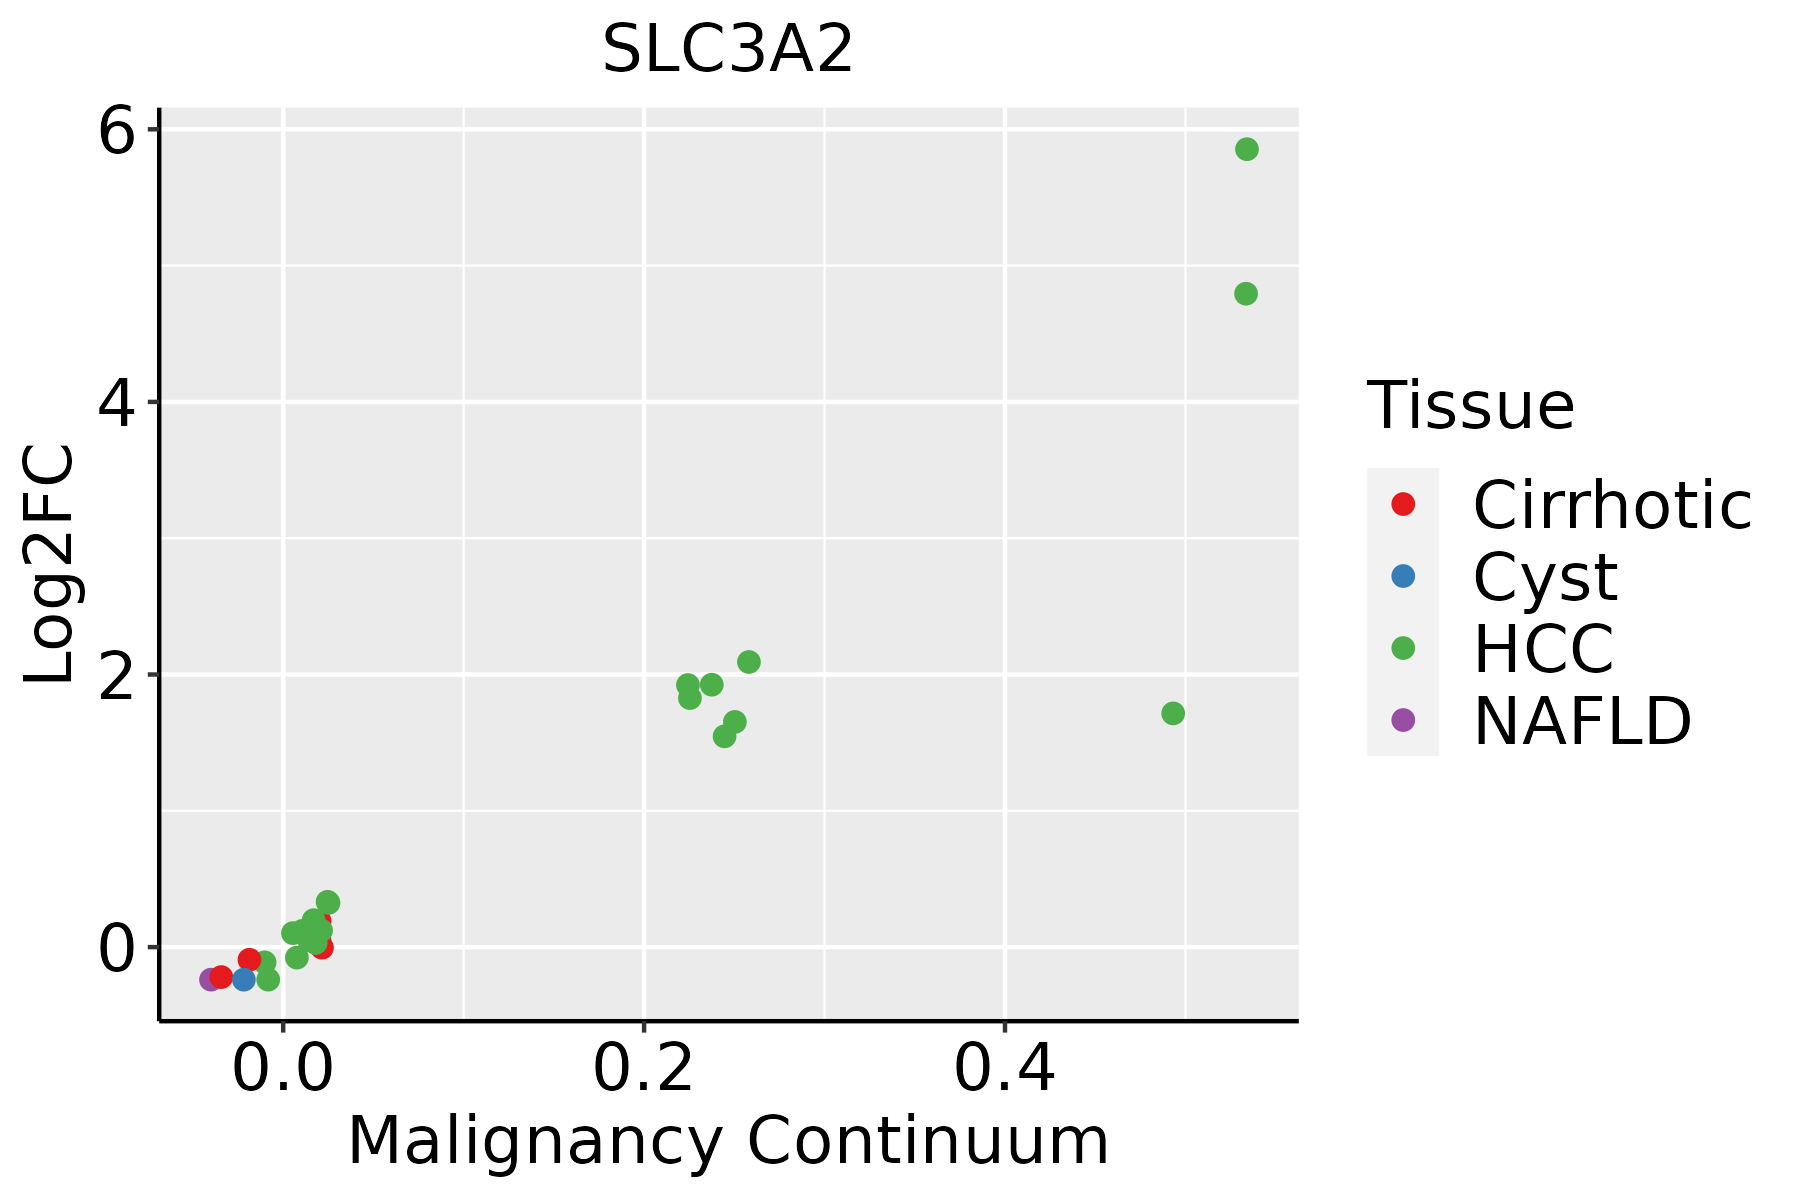 | HCC: Hepatocellular carcinoma |
| NAFLD: Non-alcoholic fatty liver disease | ||
| Oral Cavity | 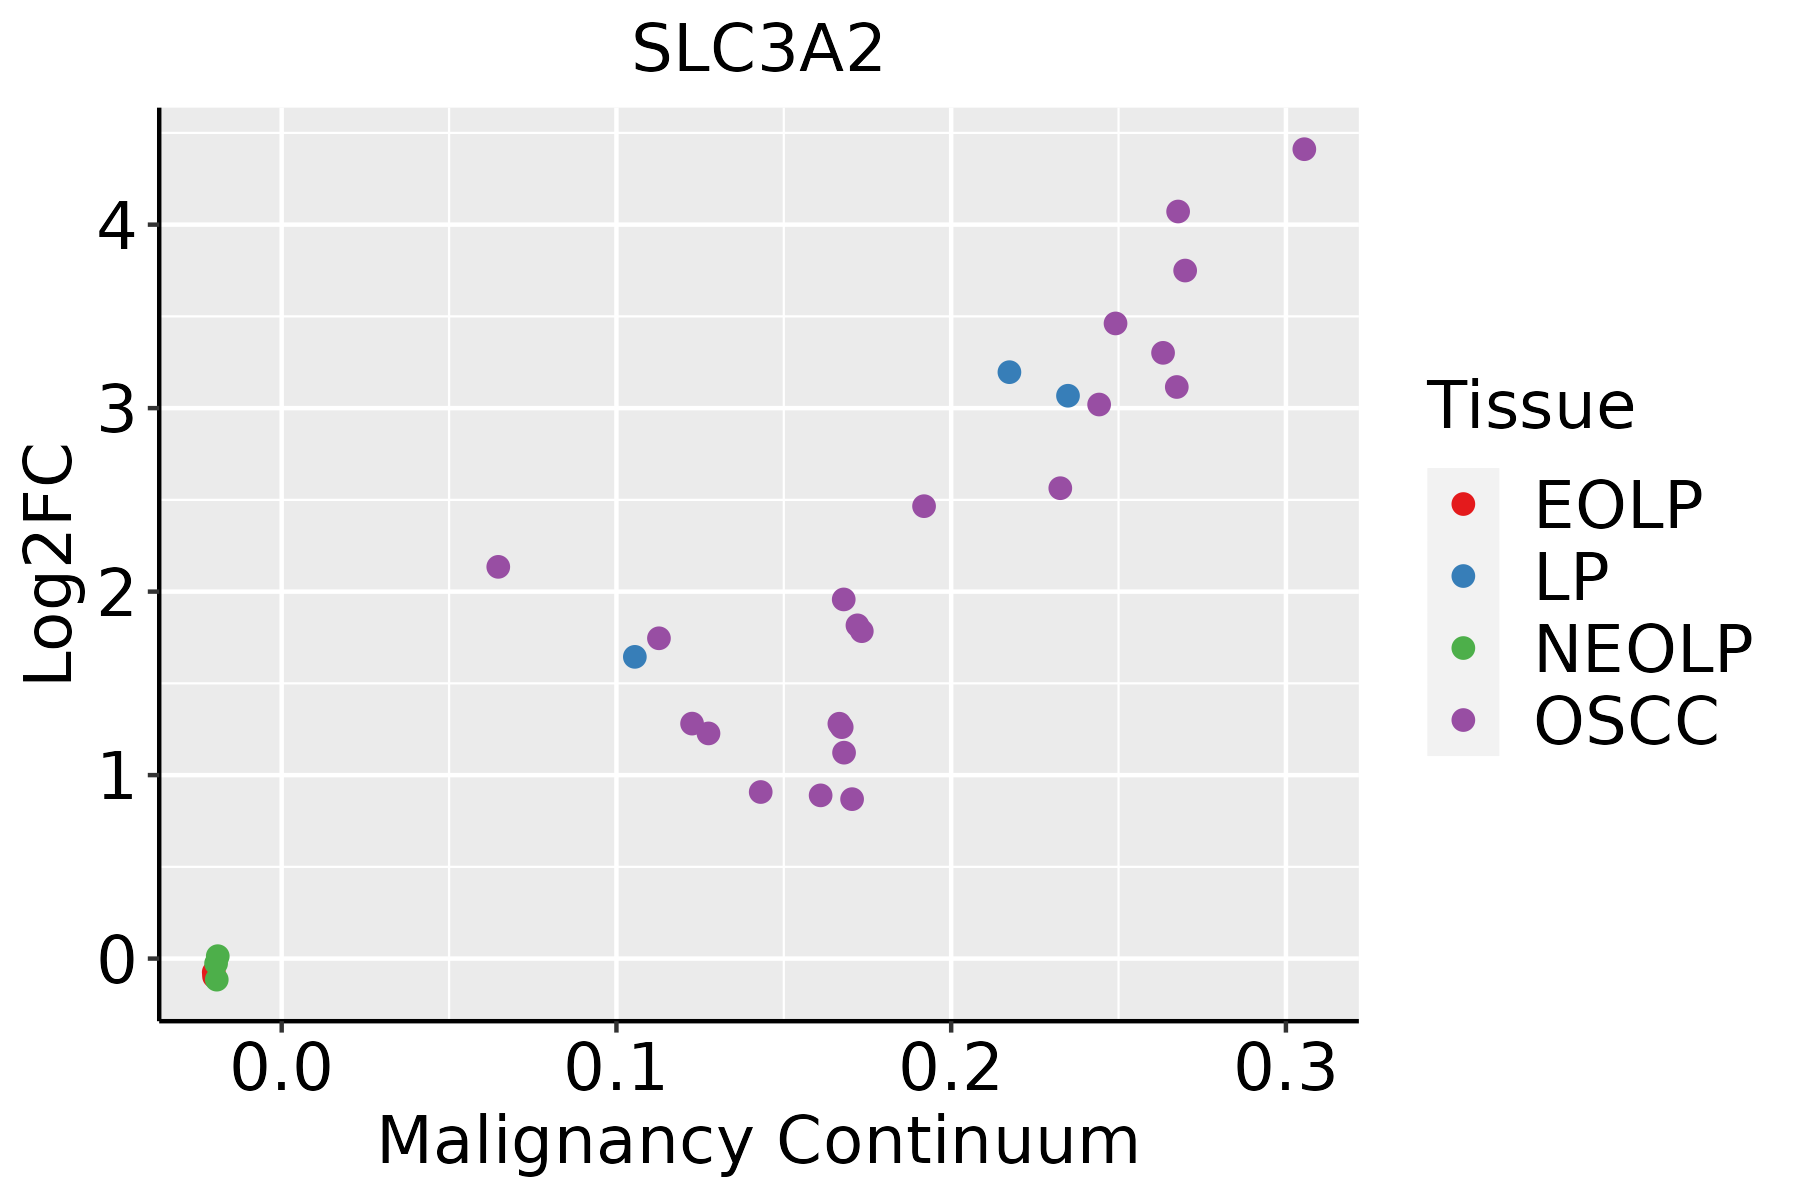 | EOLP: Erosive Oral lichen planus |
| LP: leukoplakia | ||
| NEOLP: Non-erosive oral lichen planus | ||
| OSCC: Oral squamous cell carcinoma | ||
| Prostate | 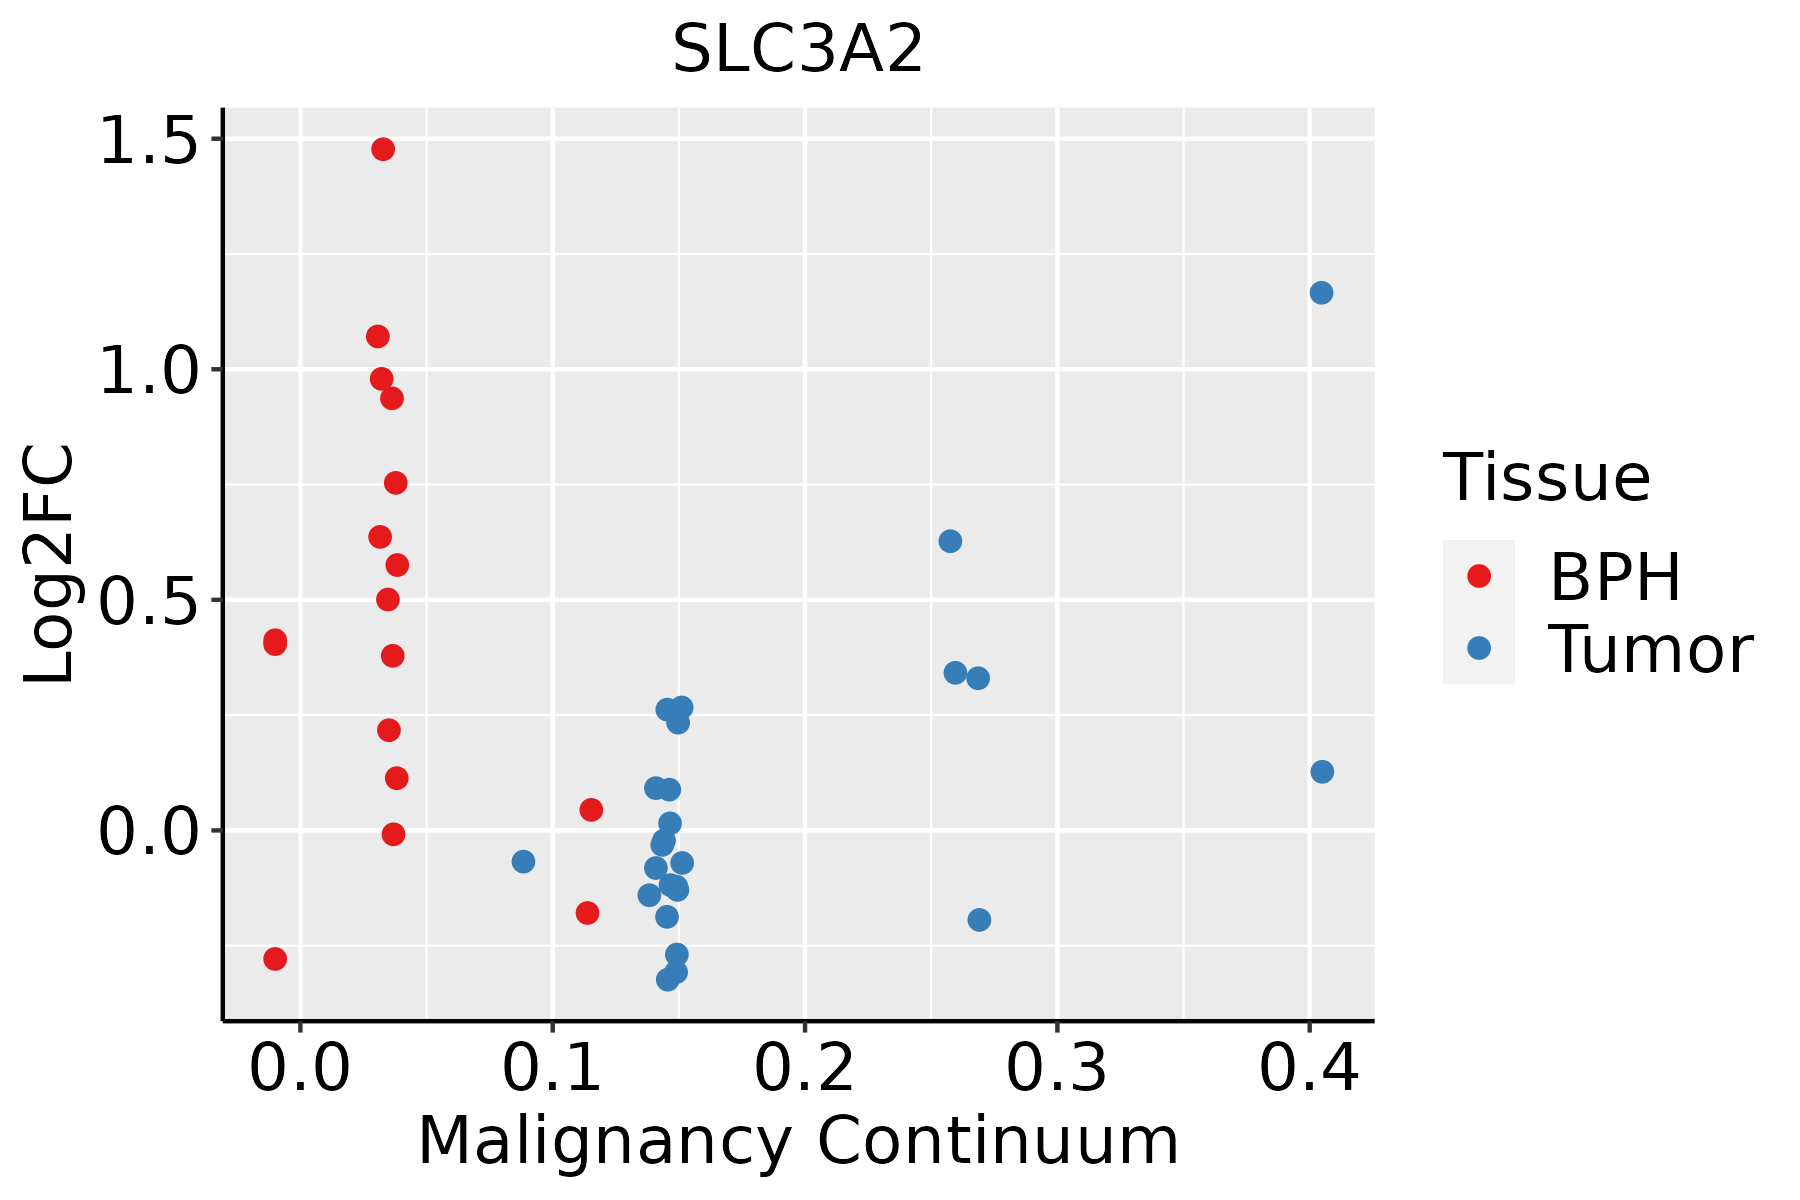 | BPH: Benign Prostatic Hyperplasia |
| Skin | 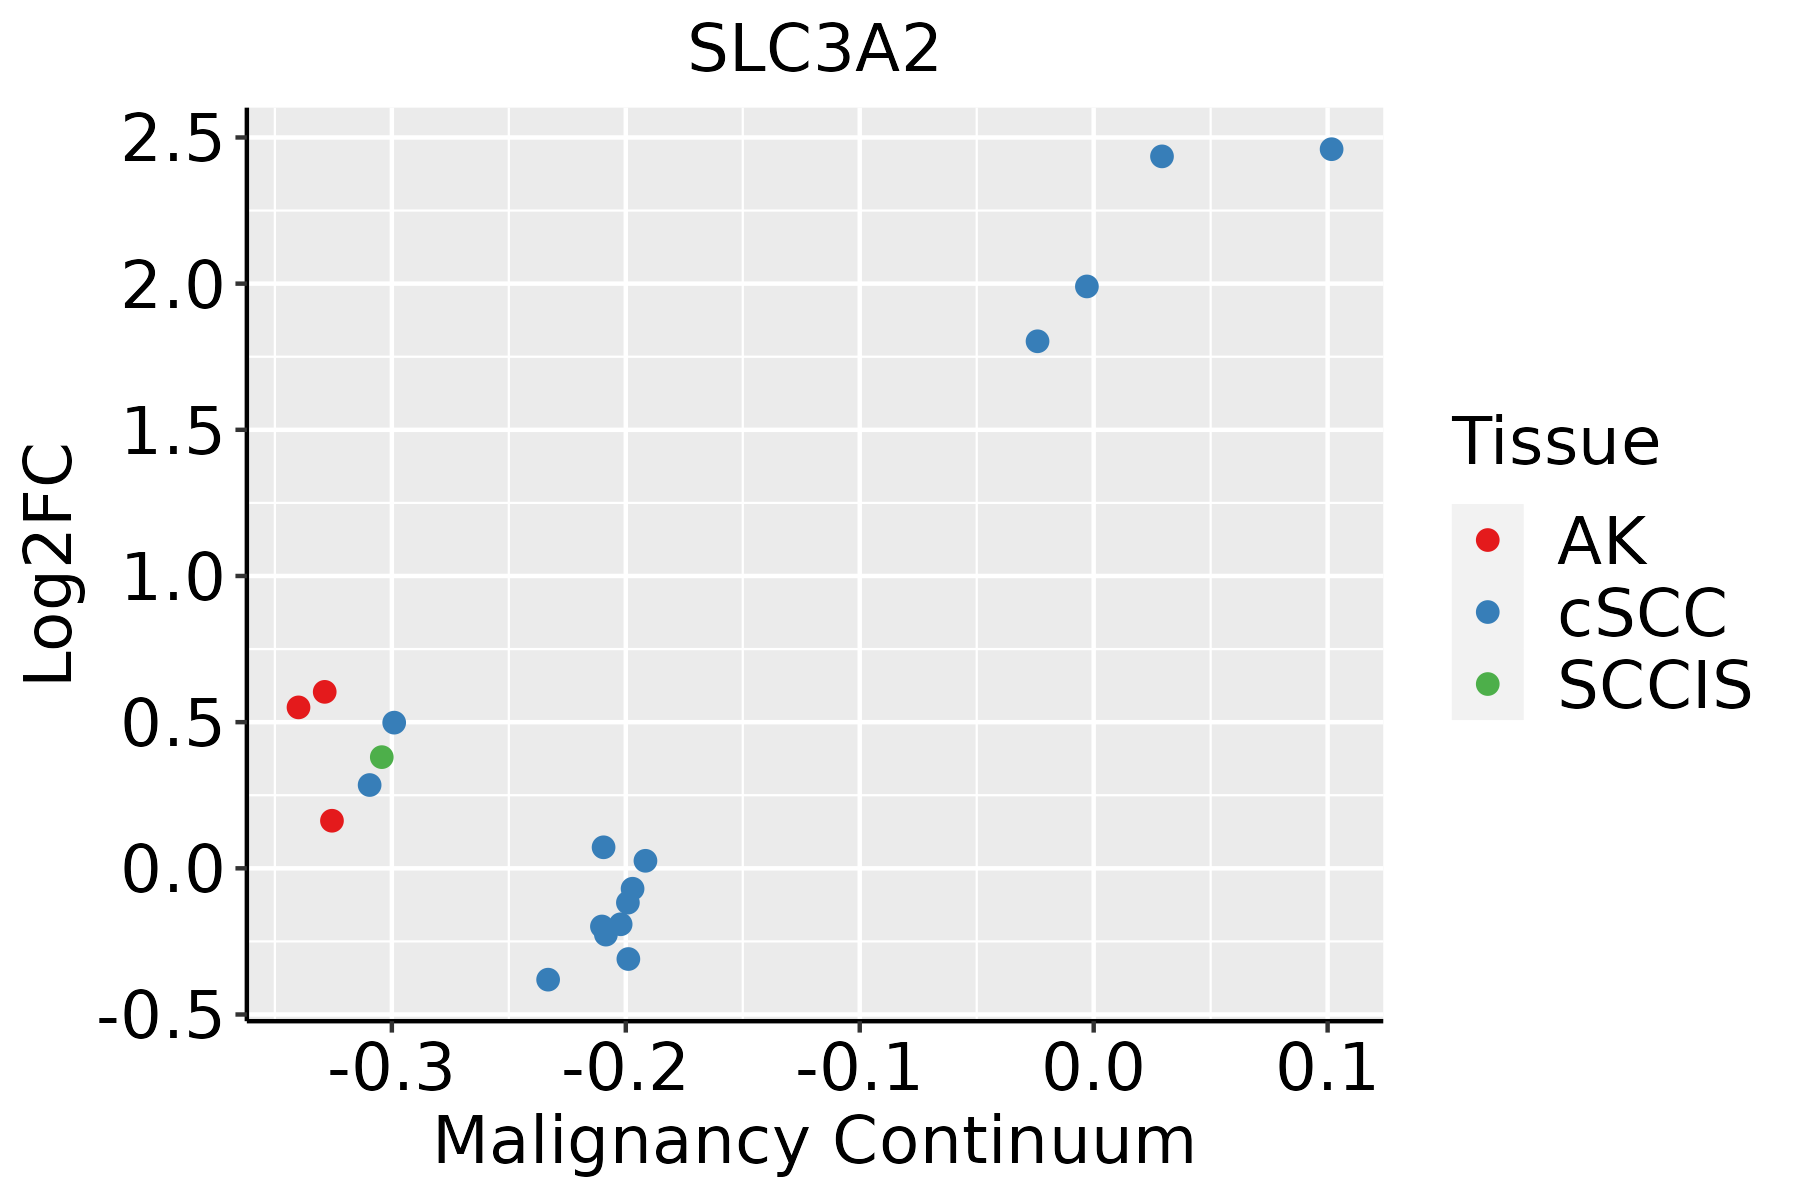 | AK: Actinic keratosis |
| cSCC: Cutaneous squamous cell carcinoma | ||
| SCCIS:squamous cell carcinoma in situ | ||
| Thyroid |  | ATC: Anaplastic thyroid cancer |
| HT: Hashimoto's thyroiditis | ||
| PTC: Papillary thyroid cancer |
| ∗log2FC in expression of this searched gene in stem-like cells from each diseased tissue sample relative to stem-like cells in normal samples in each tissue plotted against the malignancy continuum. Samples are colored based on if they are from different disease stage. |
Top |
Malignant transformation related pathway analysis |
| Find out the enriched GO biological processes and KEGG pathways involved in transition from healthy to precancer to cancer |
| Tissue | Disease Stage | Enriched GO biological Processes |
| Colorectum | AD |  |
| Colorectum | SER |  |
| Colorectum | MSS |  |
| Colorectum | MSI-H |  |
| Colorectum | FAP |  |
| ∗Top 15 enriched GO BP terms are showed in the bar plot of each disease state in each tissue. Each row represents a significant GO biological process which is colored according to the -log10(p.adjust). |
| Page: 1 2 3 4 5 6 7 8 9 |
| GO ID | Tissue | Disease Stage | Description | Gene Ratio | Bg Ratio | pvalue | p.adjust | Count |
| GO:00160329 | Breast | Precancer | viral process | 58/1080 | 415/18723 | 3.42e-10 | 3.16e-08 | 58 |
| GO:00190589 | Breast | Precancer | viral life cycle | 47/1080 | 317/18723 | 2.42e-09 | 1.99e-07 | 47 |
| GO:00444039 | Breast | Precancer | biological process involved in symbiotic interaction | 42/1080 | 290/18723 | 3.40e-08 | 2.11e-06 | 42 |
| GO:00521269 | Breast | Precancer | movement in host environment | 29/1080 | 175/18723 | 2.59e-07 | 1.28e-05 | 29 |
| GO:00517019 | Breast | Precancer | biological process involved in interaction with host | 31/1080 | 203/18723 | 6.52e-07 | 2.71e-05 | 31 |
| GO:00444099 | Breast | Precancer | entry into host | 25/1080 | 151/18723 | 1.74e-06 | 6.19e-05 | 25 |
| GO:00467189 | Breast | Precancer | viral entry into host cell | 24/1080 | 144/18723 | 2.46e-06 | 8.35e-05 | 24 |
| GO:001603214 | Breast | IDC | viral process | 75/1434 | 415/18723 | 1.98e-12 | 4.02e-10 | 75 |
| GO:001905814 | Breast | IDC | viral life cycle | 61/1434 | 317/18723 | 1.61e-11 | 2.77e-09 | 61 |
| GO:004440314 | Breast | IDC | biological process involved in symbiotic interaction | 52/1434 | 290/18723 | 6.55e-09 | 5.03e-07 | 52 |
| GO:005212614 | Breast | IDC | movement in host environment | 32/1434 | 175/18723 | 3.33e-06 | 1.22e-04 | 32 |
| GO:005170114 | Breast | IDC | biological process involved in interaction with host | 35/1434 | 203/18723 | 4.72e-06 | 1.63e-04 | 35 |
| GO:004440914 | Breast | IDC | entry into host | 28/1434 | 151/18723 | 1.02e-05 | 2.82e-04 | 28 |
| GO:004671814 | Breast | IDC | viral entry into host cell | 27/1434 | 144/18723 | 1.18e-05 | 3.14e-04 | 27 |
| GO:001603224 | Breast | DCIS | viral process | 73/1390 | 415/18723 | 3.40e-12 | 6.88e-10 | 73 |
| GO:001905824 | Breast | DCIS | viral life cycle | 59/1390 | 317/18723 | 4.05e-11 | 5.74e-09 | 59 |
| GO:004440323 | Breast | DCIS | biological process involved in symbiotic interaction | 49/1390 | 290/18723 | 4.70e-08 | 2.89e-06 | 49 |
| GO:005212624 | Breast | DCIS | movement in host environment | 31/1390 | 175/18723 | 4.93e-06 | 1.45e-04 | 31 |
| GO:005170124 | Breast | DCIS | biological process involved in interaction with host | 34/1390 | 203/18723 | 6.30e-06 | 1.78e-04 | 34 |
| GO:004440924 | Breast | DCIS | entry into host | 27/1390 | 151/18723 | 1.65e-05 | 4.00e-04 | 27 |
| Page: 1 2 3 4 5 6 7 8 |
| Pathway ID | Tissue | Disease Stage | Description | Gene Ratio | Bg Ratio | pvalue | p.adjust | qvalue | Count |
| hsa0421610 | Breast | Precancer | Ferroptosis | 11/684 | 41/8465 | 2.95e-04 | 2.45e-03 | 1.88e-03 | 11 |
| hsa0421613 | Breast | Precancer | Ferroptosis | 11/684 | 41/8465 | 2.95e-04 | 2.45e-03 | 1.88e-03 | 11 |
| hsa0421623 | Breast | IDC | Ferroptosis | 12/867 | 41/8465 | 5.87e-04 | 4.89e-03 | 3.66e-03 | 12 |
| hsa0421633 | Breast | IDC | Ferroptosis | 12/867 | 41/8465 | 5.87e-04 | 4.89e-03 | 3.66e-03 | 12 |
| hsa0421642 | Breast | DCIS | Ferroptosis | 12/846 | 41/8465 | 4.69e-04 | 3.69e-03 | 2.72e-03 | 12 |
| hsa0421652 | Breast | DCIS | Ferroptosis | 12/846 | 41/8465 | 4.69e-04 | 3.69e-03 | 2.72e-03 | 12 |
| hsa042162 | Colorectum | MSS | Ferroptosis | 18/1875 | 41/8465 | 1.53e-03 | 8.53e-03 | 5.23e-03 | 18 |
| hsa04150 | Colorectum | MSS | mTOR signaling pathway | 47/1875 | 156/8465 | 1.19e-02 | 3.99e-02 | 2.44e-02 | 47 |
| hsa042163 | Colorectum | MSS | Ferroptosis | 18/1875 | 41/8465 | 1.53e-03 | 8.53e-03 | 5.23e-03 | 18 |
| hsa041501 | Colorectum | MSS | mTOR signaling pathway | 47/1875 | 156/8465 | 1.19e-02 | 3.99e-02 | 2.44e-02 | 47 |
| hsa0421616 | Endometrium | AEH | Ferroptosis | 15/1197 | 41/8465 | 2.83e-04 | 2.30e-03 | 1.68e-03 | 15 |
| hsa0421617 | Endometrium | AEH | Ferroptosis | 15/1197 | 41/8465 | 2.83e-04 | 2.30e-03 | 1.68e-03 | 15 |
| hsa0421625 | Endometrium | EEC | Ferroptosis | 16/1237 | 41/8465 | 1.09e-04 | 1.08e-03 | 8.08e-04 | 16 |
| hsa0421635 | Endometrium | EEC | Ferroptosis | 16/1237 | 41/8465 | 1.09e-04 | 1.08e-03 | 8.08e-04 | 16 |
| hsa0421628 | Esophagus | HGIN | Ferroptosis | 15/1383 | 41/8465 | 1.35e-03 | 1.26e-02 | 1.00e-02 | 15 |
| hsa04216111 | Esophagus | HGIN | Ferroptosis | 15/1383 | 41/8465 | 1.35e-03 | 1.26e-02 | 1.00e-02 | 15 |
| hsa0421629 | Esophagus | ESCC | Ferroptosis | 33/4205 | 41/8465 | 4.58e-05 | 1.99e-04 | 1.02e-04 | 33 |
| hsa041505 | Esophagus | ESCC | mTOR signaling pathway | 98/4205 | 156/8465 | 5.81e-04 | 1.95e-03 | 9.97e-04 | 98 |
| hsa0421638 | Esophagus | ESCC | Ferroptosis | 33/4205 | 41/8465 | 4.58e-05 | 1.99e-04 | 1.02e-04 | 33 |
| hsa0415013 | Esophagus | ESCC | mTOR signaling pathway | 98/4205 | 156/8465 | 5.81e-04 | 1.95e-03 | 9.97e-04 | 98 |
| Page: 1 2 |
Top |
Cell-cell communication analysis |
| Identification of potential cell-cell interactions between two cell types and their ligand-receptor pairs for different disease states |
| Ligand | Receptor | LRpair | Pathway | Tissue | Disease Stage |
| Page: 1 |
Top |
Single-cell gene regulatory network inference analysis |
| Find out the significant the regulons (TFs) and the target genes of each regulon across cell types for different disease states |
| TF | Cell Type | Tissue | Disease Stage | Target Gene | RSS | Regulon Activity |
| ∗The dot plots of a searched regulon are shown for all cell subpopulations in each disease state of each tissue based on the regulon specific score inferred using pySCENIC and by calculating the average expression. |
| Page: 1 |
Top |
Somatic mutation of malignant transformation related genes |
| Annotation of somatic variants for genes involved in malignant transformation |
| Hugo Symbol | Variant Class | Variant Classification | dbSNP RS | HGVSc | HGVSp | HGVSp Short | SWISSPROT | BIOTYPE | SIFT | PolyPhen | Tumor Sample Barcode | Tissue | Histology | Sex | Age | Stage | Therapy Types | Drugs | Outcome |
| SLC3A2 | SNV | Missense_Mutation | c.1810C>G | p.Arg604Gly | p.R604G | protein_coding | tolerated(0.13) | probably_damaging(0.954) | TCGA-A8-A07R-01 | Breast | breast invasive carcinoma | Female | >=65 | III/IV | Ancillary | zoledronic | SD | ||
| SLC3A2 | SNV | Missense_Mutation | c.26C>T | p.Ser9Leu | p.S9L | protein_coding | tolerated_low_confidence(1) | benign(0.003) | TCGA-A8-A093-01 | Breast | breast invasive carcinoma | Female | <65 | I/II | Hormone Therapy | tamoxiphen | SD | ||
| SLC3A2 | SNV | Missense_Mutation | c.1336T>G | p.Leu446Val | p.L446V | protein_coding | tolerated(1) | benign(0.003) | TCGA-GM-A2DB-01 | Breast | breast invasive carcinoma | Female | <65 | I/II | Chemotherapy | taxol | CR | ||
| SLC3A2 | insertion | In_Frame_Ins | novel | c.84_85insGAAACTCCGTTT | p.Val28_Gln29insGluThrProPhe | p.V28_Q29insETPF | protein_coding | TCGA-A8-A06X-01 | Breast | breast invasive carcinoma | Female | >=65 | I/II | Unknown | Unknown | SD | |||
| SLC3A2 | insertion | In_Frame_Ins | novel | c.86_87insAAAAAATAAAATAAAAAGCATAATTTGGCT | p.Gln29_Gly30insLysAsnLysIleLysSerIleIleTrpLeu | p.Q29_G30insKNKIKSIIWL | protein_coding | TCGA-A8-A06X-01 | Breast | breast invasive carcinoma | Female | >=65 | I/II | Unknown | Unknown | SD | |||
| SLC3A2 | insertion | Nonsense_Mutation | novel | c.1835_1836insCCCTCACACGCTTCTGCTATGTTTTTATCATTCTTAG | p.Glu613ProfsTer12 | p.E613Pfs*12 | protein_coding | TCGA-A8-A0A4-01 | Breast | breast invasive carcinoma | Female | >=65 | I/II | Hormone Therapy | tamoxiphen | CR | |||
| SLC3A2 | SNV | Missense_Mutation | novel | c.856N>A | p.Gly286Ser | p.G286S | protein_coding | deleterious(0) | probably_damaging(1) | TCGA-2W-A8YY-01 | Cervix | cervical & endocervical cancer | Female | <65 | I/II | Chemotherapy | cisplatin | CR | |
| SLC3A2 | SNV | Missense_Mutation | rs751067361 | c.1153N>A | p.Asp385Asn | p.D385N | protein_coding | tolerated(0.28) | benign(0.011) | TCGA-2W-A8YY-01 | Cervix | cervical & endocervical cancer | Female | <65 | I/II | Chemotherapy | cisplatin | CR | |
| SLC3A2 | SNV | Missense_Mutation | c.997N>A | p.Asp333Asn | p.D333N | protein_coding | tolerated(0.2) | benign(0.005) | TCGA-EK-A2PM-01 | Cervix | cervical & endocervical cancer | Female | >=65 | I/II | Unknown | Unknown | SD | ||
| SLC3A2 | insertion | Frame_Shift_Ins | novel | c.531_532insTACCT | p.Gly178TyrfsTer29 | p.G178Yfs*29 | protein_coding | TCGA-DS-A1OB-01 | Cervix | cervical & endocervical cancer | Female | <65 | I/II | Chemotherapy | carboplatin | PD |
| Page: 1 2 3 4 5 6 |
Top |
Related drugs of malignant transformation related genes |
| Identification of chemicals and drugs interact with genes involved in malignant transfromation |
| (DGIdb 4.0) |
| Entrez ID | Symbol | Category | Interaction Types | Drug Claim Name | Drug Name | PMIDs |
| 6520 | SLC3A2 | DRUGGABLE GENOME, CELL SURFACE, EXTERNAL SIDE OF PLASMA MEMBRANE, TRANSPORTER | IGN523 | |||
| 6520 | SLC3A2 | DRUGGABLE GENOME, CELL SURFACE, EXTERNAL SIDE OF PLASMA MEMBRANE, TRANSPORTER | antibody | 252827395 |
| Page: 1 |

Copyright 2023-Present -The University of Texas Health Science Center at Houston |