
|
|||||
|
 | |
| |
| |
| |
| |
| |
|
Gene: SLC22A18 |
Gene summary for SLC22A18 |
| Gene information | Species | Human | Gene symbol | SLC22A18 | Gene ID | 5002 |
| Gene name | solute carrier family 22 member 18 | |
| Gene Alias | BWR1A | |
| Cytomap | 11p15.4 | |
| Gene Type | protein-coding | GO ID | GO:0003008 | UniProtAcc | Q96BI1 |
Top |
Malignant transformation analysis |
| Identification of the aberrant gene expression in precancerous and cancerous lesions by comparing the gene expression of stem-like cells in diseased tissues with normal stem cells |
| Entrez ID | Symbol | Replicates | Species | Organ | Tissue | Adj P-value | Log2FC | Malignancy |
| 5002 | SLC22A18 | Pat12-B | Human | Stomach | GC | 6.78e-11 | 2.69e-01 | 0.0325 |
| 5002 | SLC22A18 | Pat13-B | Human | Stomach | GC | 3.38e-07 | 2.94e-01 | 0.0555 |
| 5002 | SLC22A18 | Pat16-B | Human | Stomach | GC | 4.36e-08 | 2.61e-01 | 0.1918 |
| 5002 | SLC22A18 | Pat17-B | Human | Stomach | GC | 8.45e-20 | 5.43e-01 | 0.3109 |
| 5002 | SLC22A18 | Pat18-B | Human | Stomach | GC | 2.48e-09 | 3.20e-01 | -0.0432 |
| 5002 | SLC22A18 | Pat19-B | Human | Stomach | GC | 1.70e-10 | 3.91e-01 | 0.0826 |
| 5002 | SLC22A18 | Pat22-B | Human | Stomach | GC | 3.34e-16 | 3.29e-01 | -0.1042 |
| 5002 | SLC22A18 | Pat24-B | Human | Stomach | GC | 6.03e-03 | 1.75e-01 | -0.1184 |
| 5002 | SLC22A18 | Pat25-A | Human | Stomach | CAG with IM | 1.69e-12 | 2.39e-01 | -0.1648 |
| 5002 | SLC22A18 | Pat26-A | Human | Stomach | CSG | 9.31e-09 | 1.63e-01 | -0.2402 |
| 5002 | SLC22A18 | WIM_2 | Human | Stomach | WIM | 1.87e-06 | 4.64e-01 | 0.1159 |
| 5002 | SLC22A18 | SIM_1 | Human | Stomach | SIM | 2.40e-16 | 4.96e-01 | 0.3573 |
| 5002 | SLC22A18 | SIM_2 | Human | Stomach | SIM | 5.05e-24 | 5.32e-01 | 0.3139 |
| 5002 | SLC22A18 | SIM_4 | Human | Stomach | SIM | 1.41e-06 | 3.55e-01 | 0.2664 |
| 5002 | SLC22A18 | male-WTA | Human | Thyroid | PTC | 2.45e-08 | 1.34e-01 | 0.1037 |
| 5002 | SLC22A18 | PTC01 | Human | Thyroid | PTC | 4.23e-28 | 4.48e-01 | 0.1899 |
| 5002 | SLC22A18 | PTC03 | Human | Thyroid | PTC | 1.35e-02 | 2.25e-01 | 0.1784 |
| 5002 | SLC22A18 | PTC04 | Human | Thyroid | PTC | 9.23e-23 | 4.56e-01 | 0.1927 |
| 5002 | SLC22A18 | PTC05 | Human | Thyroid | PTC | 1.07e-19 | 5.94e-01 | 0.2065 |
| 5002 | SLC22A18 | PTC06 | Human | Thyroid | PTC | 2.46e-26 | 5.97e-01 | 0.2057 |
| Page: 1 2 3 4 5 6 7 8 |
| Tissue | Expression Dynamics | Abbreviation |
| Colorectum (GSE201348) |  | FAP: Familial adenomatous polyposis |
| CRC: Colorectal cancer | ||
| Colorectum (HTA11) |  | AD: Adenomas |
| SER: Sessile serrated lesions | ||
| MSI-H: Microsatellite-high colorectal cancer | ||
| MSS: Microsatellite stable colorectal cancer | ||
| Esophagus | 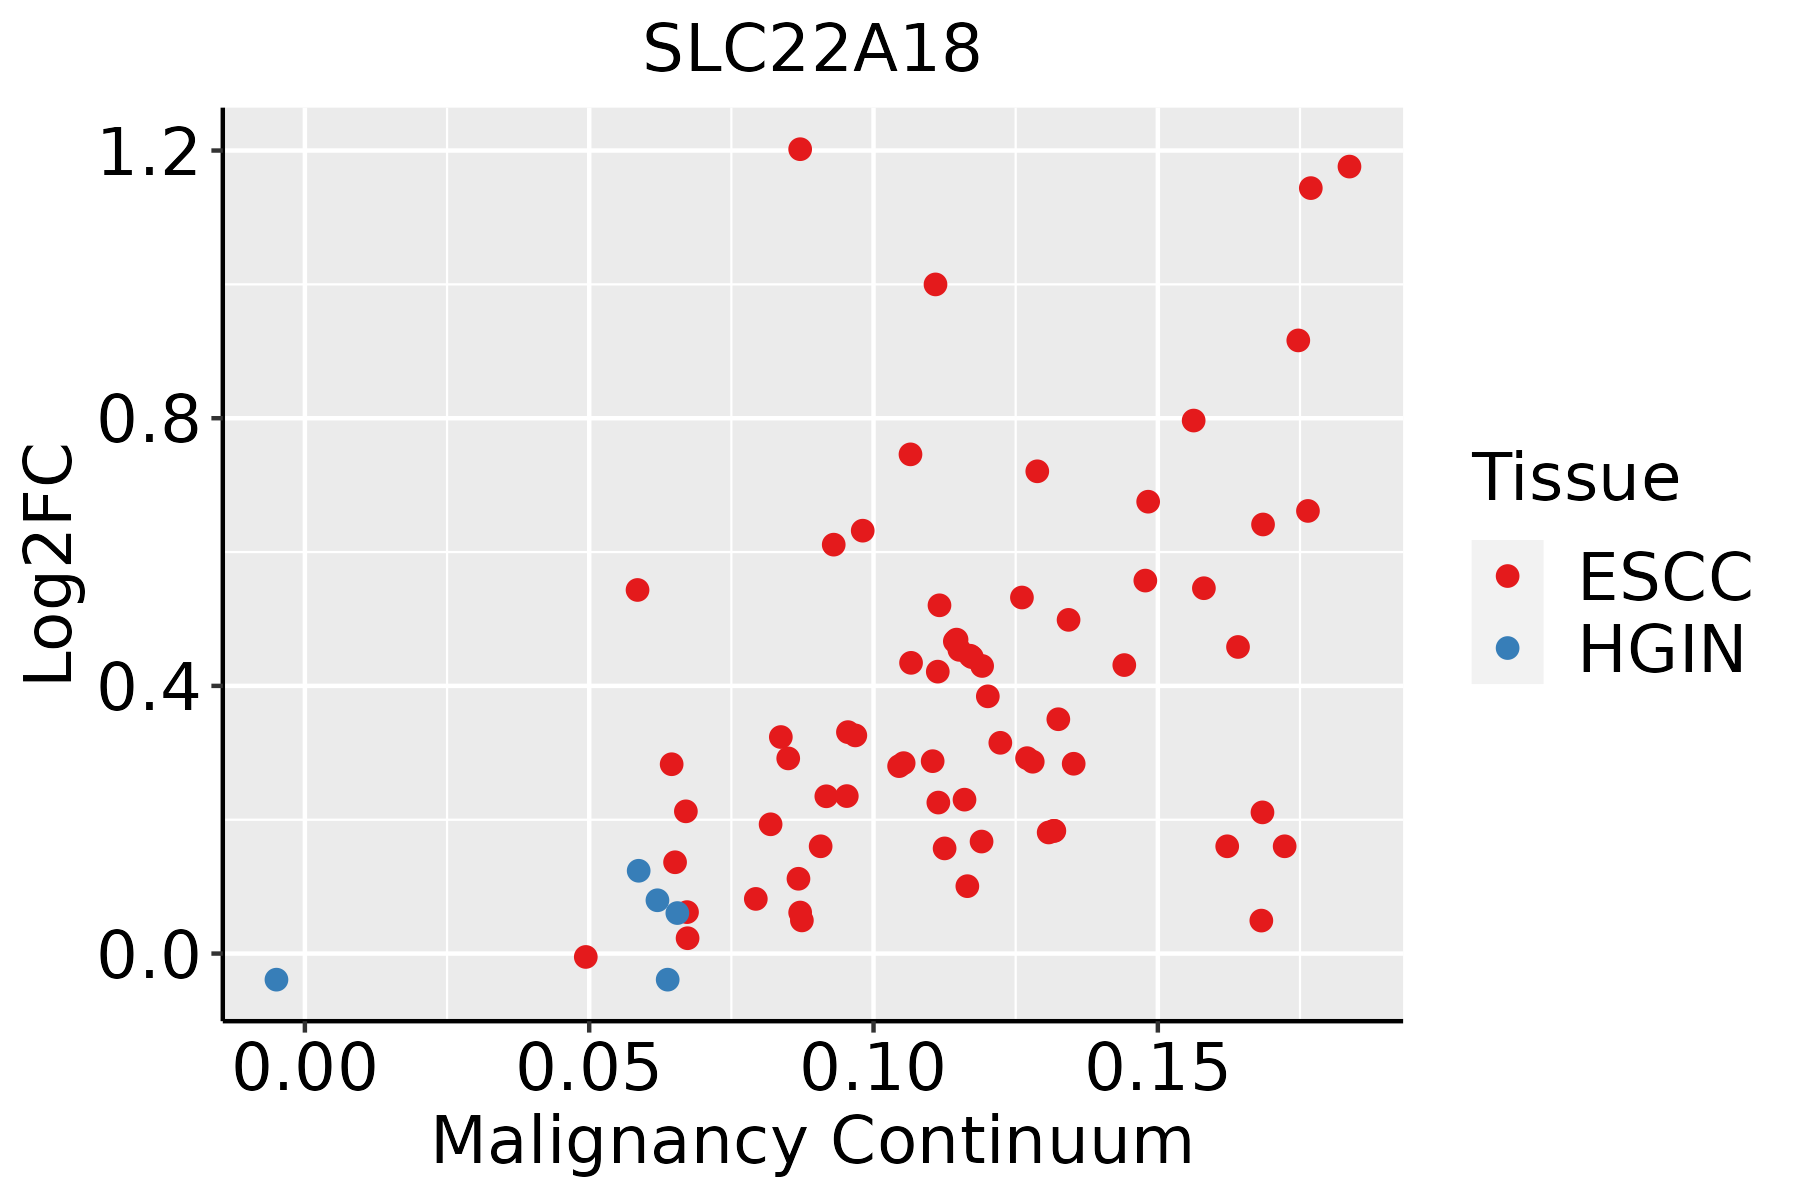 | ESCC: Esophageal squamous cell carcinoma |
| HGIN: High-grade intraepithelial neoplasias | ||
| LGIN: Low-grade intraepithelial neoplasias | ||
| GC | 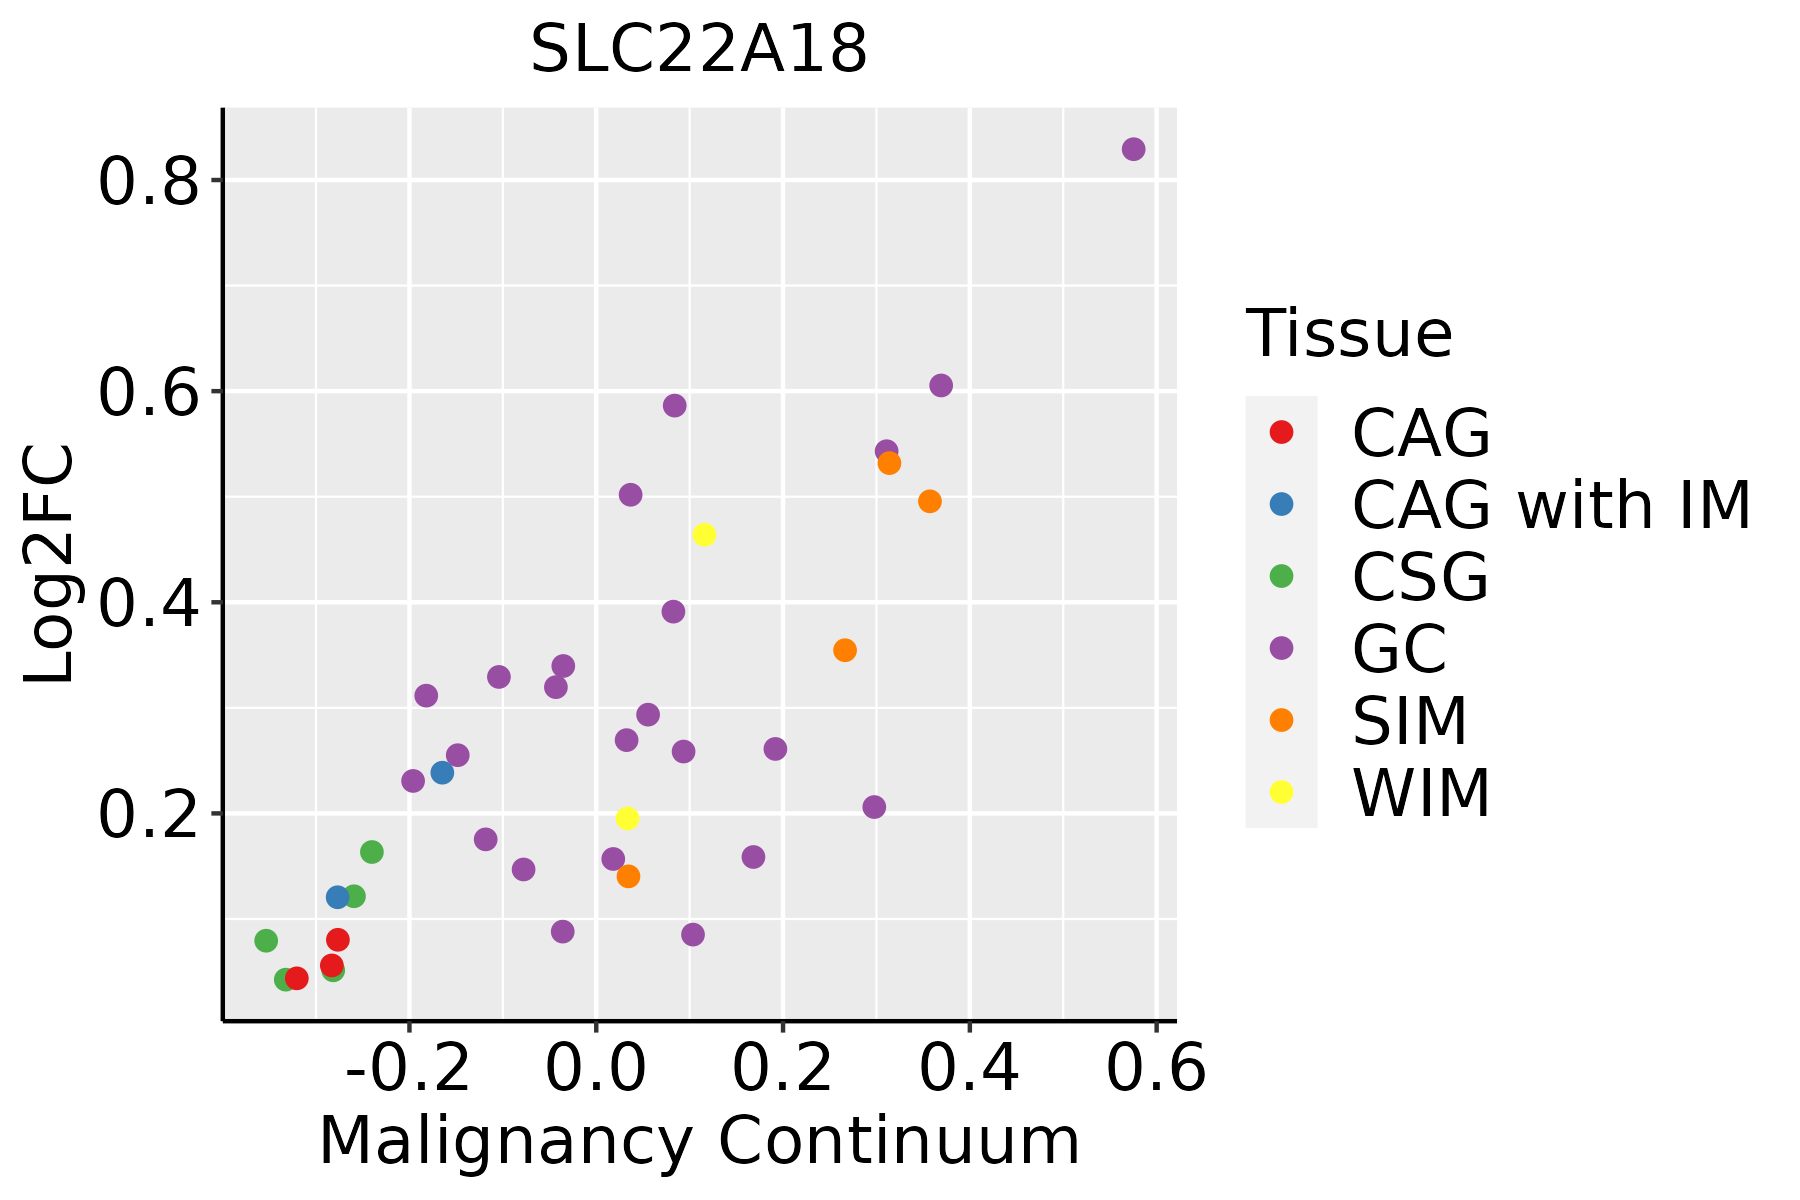 | CAG: Chronic atrophic gastritis |
| CAG with IM: Chronic atrophic gastritis with intestinal metaplasia | ||
| CSG: Chronic superficial gastritis | ||
| GC: Gastric cancer | ||
| SIM: Severe intestinal metaplasia | ||
| WIM: Wild intestinal metaplasia | ||
| Liver |  | HCC: Hepatocellular carcinoma |
| NAFLD: Non-alcoholic fatty liver disease | ||
| Oral Cavity | 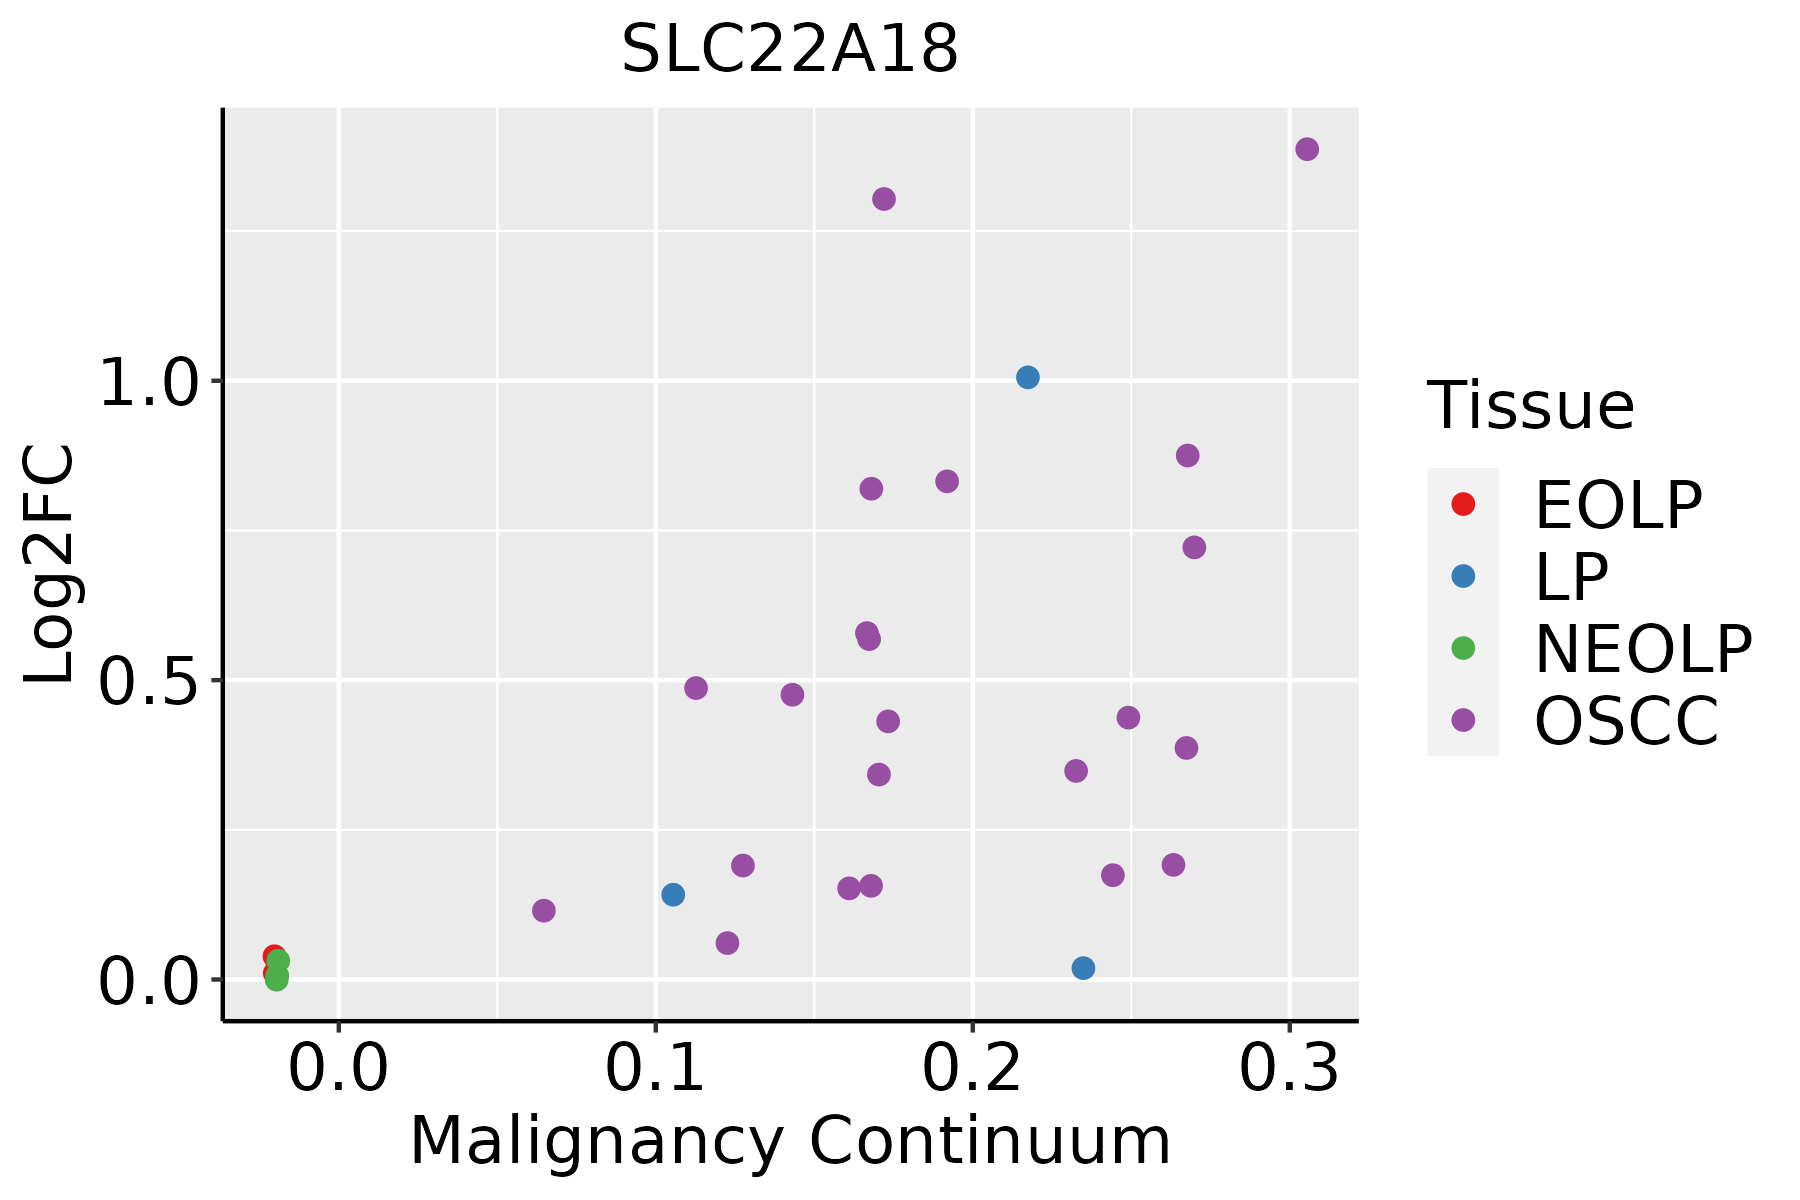 | EOLP: Erosive Oral lichen planus |
| LP: leukoplakia | ||
| NEOLP: Non-erosive oral lichen planus | ||
| OSCC: Oral squamous cell carcinoma | ||
| Thyroid |  | ATC: Anaplastic thyroid cancer |
| HT: Hashimoto's thyroiditis | ||
| PTC: Papillary thyroid cancer |
| ∗log2FC in expression of this searched gene in stem-like cells from each diseased tissue sample relative to stem-like cells in normal samples in each tissue plotted against the malignancy continuum. Samples are colored based on if they are from different disease stage. |
Top |
Malignant transformation related pathway analysis |
| Find out the enriched GO biological processes and KEGG pathways involved in transition from healthy to precancer to cancer |
| Tissue | Disease Stage | Enriched GO biological Processes |
| Colorectum | AD |  |
| Colorectum | SER |  |
| Colorectum | MSS |  |
| Colorectum | MSI-H |  |
| Colorectum | FAP |  |
| ∗Top 15 enriched GO BP terms are showed in the bar plot of each disease state in each tissue. Each row represents a significant GO biological process which is colored according to the -log10(p.adjust). |
| Page: 1 2 3 4 5 6 7 8 9 |
| GO ID | Tissue | Disease Stage | Description | Gene Ratio | Bg Ratio | pvalue | p.adjust | Count |
| GO:1902600 | Colorectum | AD | proton transmembrane transport | 66/3918 | 157/18723 | 1.59e-09 | 1.17e-07 | 66 |
| GO:0009636 | Colorectum | AD | response to toxic substance | 88/3918 | 262/18723 | 1.12e-06 | 3.72e-05 | 88 |
| GO:0098754 | Colorectum | AD | detoxification | 53/3918 | 152/18723 | 4.63e-05 | 7.98e-04 | 53 |
| GO:19026001 | Colorectum | SER | proton transmembrane transport | 60/2897 | 157/18723 | 3.12e-12 | 7.08e-10 | 60 |
| GO:00096361 | Colorectum | SER | response to toxic substance | 71/2897 | 262/18723 | 8.63e-07 | 4.07e-05 | 71 |
| GO:00987541 | Colorectum | SER | detoxification | 46/2897 | 152/18723 | 3.02e-06 | 1.20e-04 | 46 |
| GO:19026002 | Colorectum | MSS | proton transmembrane transport | 57/3467 | 157/18723 | 1.00e-07 | 4.81e-06 | 57 |
| GO:00096362 | Colorectum | MSS | response to toxic substance | 73/3467 | 262/18723 | 1.26e-04 | 1.94e-03 | 73 |
| GO:00987542 | Colorectum | MSS | detoxification | 41/3467 | 152/18723 | 6.41e-03 | 4.27e-02 | 41 |
| GO:19026004 | Colorectum | FAP | proton transmembrane transport | 39/2622 | 157/18723 | 2.03e-04 | 2.92e-03 | 39 |
| GO:00096363 | Colorectum | FAP | response to toxic substance | 53/2622 | 262/18723 | 3.35e-03 | 2.46e-02 | 53 |
| GO:000963620 | Esophagus | ESCC | response to toxic substance | 150/8552 | 262/18723 | 1.00e-04 | 7.12e-04 | 150 |
| GO:190260018 | Esophagus | ESCC | proton transmembrane transport | 88/8552 | 157/18723 | 5.62e-03 | 2.10e-02 | 88 |
| GO:000963612 | Liver | Cirrhotic | response to toxic substance | 104/4634 | 262/18723 | 5.63e-08 | 1.74e-06 | 104 |
| GO:00987547 | Liver | Cirrhotic | detoxification | 60/4634 | 152/18723 | 4.09e-05 | 4.86e-04 | 60 |
| GO:000963622 | Liver | HCC | response to toxic substance | 153/7958 | 262/18723 | 1.37e-07 | 2.58e-06 | 153 |
| GO:009875412 | Liver | HCC | detoxification | 87/7958 | 152/18723 | 1.70e-04 | 1.35e-03 | 87 |
| GO:19026007 | Liver | HCC | proton transmembrane transport | 87/7958 | 157/18723 | 7.27e-04 | 4.42e-03 | 87 |
| GO:000963618 | Oral cavity | OSCC | response to toxic substance | 137/7305 | 262/18723 | 7.94e-06 | 8.52e-05 | 137 |
| GO:009875418 | Oral cavity | OSCC | detoxification | 75/7305 | 152/18723 | 5.99e-03 | 2.28e-02 | 75 |
| Page: 1 2 3 |
| Pathway ID | Tissue | Disease Stage | Description | Gene Ratio | Bg Ratio | pvalue | p.adjust | qvalue | Count |
| Page: 1 |
Top |
Cell-cell communication analysis |
| Identification of potential cell-cell interactions between two cell types and their ligand-receptor pairs for different disease states |
| Ligand | Receptor | LRpair | Pathway | Tissue | Disease Stage |
| Page: 1 |
Top |
Single-cell gene regulatory network inference analysis |
| Find out the significant the regulons (TFs) and the target genes of each regulon across cell types for different disease states |
| TF | Cell Type | Tissue | Disease Stage | Target Gene | RSS | Regulon Activity |
| ∗The dot plots of a searched regulon are shown for all cell subpopulations in each disease state of each tissue based on the regulon specific score inferred using pySCENIC and by calculating the average expression. |
| Page: 1 |
Top |
Somatic mutation of malignant transformation related genes |
| Annotation of somatic variants for genes involved in malignant transformation |
| Hugo Symbol | Variant Class | Variant Classification | dbSNP RS | HGVSc | HGVSp | HGVSp Short | SWISSPROT | BIOTYPE | SIFT | PolyPhen | Tumor Sample Barcode | Tissue | Histology | Sex | Age | Stage | Therapy Types | Drugs | Outcome |
| SLC22A18 | SNV | Missense_Mutation | novel | c.25N>T | p.Asp9Tyr | p.D9Y | Q96BI1 | protein_coding | deleterious(0.03) | benign(0.094) | TCGA-AC-A6IW-01 | Breast | breast invasive carcinoma | Female | >=65 | I/II | Unknown | Unknown | SD |
| SLC22A18 | SNV | Missense_Mutation | novel | c.653N>T | p.Pro218Leu | p.P218L | Q96BI1 | protein_coding | deleterious(0.04) | benign(0.089) | TCGA-OL-A5D7-01 | Breast | breast invasive carcinoma | Female | >=65 | I/II | Chemotherapy | cytoxan | CR |
| SLC22A18 | SNV | Missense_Mutation | rs780830210 | c.994N>C | p.Cys332Arg | p.C332R | Q96BI1 | protein_coding | deleterious(0) | possibly_damaging(0.774) | TCGA-2W-A8YY-01 | Cervix | cervical & endocervical cancer | Female | <65 | I/II | Chemotherapy | cisplatin | CR |
| SLC22A18 | SNV | Missense_Mutation | novel | c.937N>G | p.Leu313Val | p.L313V | Q96BI1 | protein_coding | tolerated(0.25) | benign(0.07) | TCGA-AA-3531-01 | Colorectum | colon adenocarcinoma | Female | >=65 | I/II | Unknown | Unknown | SD |
| SLC22A18 | SNV | Missense_Mutation | c.763N>T | p.Gly255Trp | p.G255W | Q96BI1 | protein_coding | deleterious(0.01) | probably_damaging(0.994) | TCGA-G4-6588-01 | Colorectum | colon adenocarcinoma | Female | <65 | I/II | Unknown | Unknown | SD | |
| SLC22A18 | SNV | Missense_Mutation | c.451N>A | p.Ala151Thr | p.A151T | Q96BI1 | protein_coding | tolerated(0.5) | benign(0.096) | TCGA-WS-AB45-01 | Colorectum | colon adenocarcinoma | Female | <65 | I/II | Unknown | Unknown | SD | |
| SLC22A18 | deletion | Frame_Shift_Del | c.1136_1137delNN | p.Leu379ArgfsTer? | p.L379Rfs*? | Q96BI1 | protein_coding | TCGA-AZ-6598-01 | Colorectum | colon adenocarcinoma | Female | >=65 | I/II | Unknown | Unknown | SD | |||
| SLC22A18 | SNV | Missense_Mutation | novel | c.799N>A | p.Asp267Asn | p.D267N | Q96BI1 | protein_coding | tolerated(0.11) | benign(0.078) | TCGA-A5-A0G2-01 | Endometrium | uterine corpus endometrioid carcinoma | Female | <65 | III/IV | Unknown | Unknown | SD |
| SLC22A18 | SNV | Missense_Mutation | novel | c.220N>A | p.Leu74Met | p.L74M | Q96BI1 | protein_coding | deleterious(0.01) | possibly_damaging(0.625) | TCGA-A5-A1OF-01 | Endometrium | uterine corpus endometrioid carcinoma | Female | <65 | I/II | Unknown | Unknown | SD |
| SLC22A18 | SNV | Missense_Mutation | rs770154192 | c.694N>A | p.Ala232Thr | p.A232T | Q96BI1 | protein_coding | tolerated(1) | benign(0) | TCGA-A5-A1OF-01 | Endometrium | uterine corpus endometrioid carcinoma | Female | <65 | I/II | Unknown | Unknown | SD |
| Page: 1 2 3 |
Top |
Related drugs of malignant transformation related genes |
| Identification of chemicals and drugs interact with genes involved in malignant transfromation |
| (DGIdb 4.0) |
| Entrez ID | Symbol | Category | Interaction Types | Drug Claim Name | Drug Name | PMIDs |
| Page: 1 |

Copyright 2023-Present -The University of Texas Health Science Center at Houston |