Schematic overview of the cellular and molecular mechanisms involved in the cancer progression, including the proposed cellular and molecular mechanisms in cancer cells trajectory. AT1: alveolar type 1 cells; AT2: alveolar type 2 cells; AAH: atypical adenomatous hyperplasia; AIS: adenocarcinoma in situ; MIA: minimally invasive adenocarcinoma; IA: invasive adenocarcinoma; EMT: epithelial-mesenchymal transition

Home

Download

Statistics

Help

Contact

Center for Computational Systems Medicine
leaf

Gene summary

leaf

Malignant transformation analysis

leaf

Malignant transformation related pathway analysis

leaf

Cell-cell communication analysis

leaf

Single-cell gene regulatory network inference analysis

leaf

Somatic mutation of malignant transformation related genes

leaf

Related drugs of malignant transformation related genes

Gene: PTPRK

Gene summary for PTPRK

check button Gene summary.

Gene informationSpeciesHuman
Gene symbol

PTPRK

Gene ID

5796

Gene nameprotein tyrosine phosphatase receptor type K
Gene AliasR-PTP-kappa
Cytomap6q22.33
Gene Typeprotein-coding
GO ID

GO:0000302

UniProtAcc

Q15262


Top

Malignant transformation analysis

check button Identification of the aberrant gene expression in precancerous and cancerous lesions by comparing the gene expression of stem-like cells in diseased tissues with normal stem cells
check button Malignant transformation involving gene list.
Entrez IDSymbolReplicatesSpeciesOrganTissueAdj P-valueLog2FCMalignancy
5796PTPRKP76T-EHumanEsophagusESCC2.44e-459.74e-010.1207
5796PTPRKP79T-EHumanEsophagusESCC3.66e-397.21e-010.1154
5796PTPRKP80T-EHumanEsophagusESCC5.15e-421.48e+000.155
5796PTPRKP82T-EHumanEsophagusESCC3.91e-181.48e+000.1072
5796PTPRKP83T-EHumanEsophagusESCC6.45e-471.59e+000.1738
5796PTPRKP84T-EHumanEsophagusESCC1.26e-271.37e+000.0933
5796PTPRKP89T-EHumanEsophagusESCC3.02e-192.32e+000.1752
5796PTPRKP91T-EHumanEsophagusESCC6.57e-121.68e+000.1828
5796PTPRKP104T-EHumanEsophagusESCC5.81e-107.70e-010.0931
5796PTPRKP107T-EHumanEsophagusESCC4.61e-541.83e+000.171
5796PTPRKP126T-EHumanEsophagusESCC5.70e-061.19e+000.1125
5796PTPRKP127T-EHumanEsophagusESCC2.51e-154.67e-010.0826
5796PTPRKP128T-EHumanEsophagusESCC5.20e-532.07e+000.1241
5796PTPRKP130T-EHumanEsophagusESCC1.28e-601.43e+000.1676
5796PTPRKNAFLD1HumanLiverNAFLD5.00e-101.15e+00-0.04
5796PTPRKS43HumanLiverCirrhotic1.31e-09-9.90e-02-0.0187
5796PTPRKHCC1_MengHumanLiverHCC1.61e-59-4.72e-010.0246
5796PTPRKHCC2_MengHumanLiverHCC4.32e-56-1.24e-020.0107
5796PTPRKcirrhotic1HumanLiverCirrhotic6.98e-11-5.05e-020.0202
5796PTPRKcirrhotic2HumanLiverCirrhotic1.47e-10-2.04e-010.0201
Page: 1 2 3 4 5 6 7 8 9 10 11 12 13 14 

check button Transcriptomic changes along malignancy continuum.
TissueExpression DynamicsAbbreviation
CervixThe image shows the transcriptomic changes along malignancy continuum.log2FC in expression of this searched gene in stem-like cells from each diseased tissue sample relative to stem-like cells in normal samples in each tissue plotted against the malignancy continuum. Samples are colored based on if they are from different disease stage.CC: Cervix cancer
HSIL_HPV: HPV-infected high-grade squamous intraepithelial lesions
N_HPV: HPV-infected normal cervix
Colorectum (GSE201348)The image shows the transcriptomic changes along malignancy continuum.log2FC in expression of this searched gene in stem-like cells from each diseased tissue sample relative to stem-like cells in normal samples in each tissue plotted against the malignancy continuum. Samples are colored based on if they are from different disease stage.FAP: Familial adenomatous polyposis
CRC: Colorectal cancer
Colorectum (HTA11)The image shows the transcriptomic changes along malignancy continuum.log2FC in expression of this searched gene in stem-like cells from each diseased tissue sample relative to stem-like cells in normal samples in each tissue plotted against the malignancy continuum. Samples are colored based on if they are from different disease stage.AD: Adenomas
SER: Sessile serrated lesions
MSI-H: Microsatellite-high colorectal cancer
MSS: Microsatellite stable colorectal cancer
EndometriumThe image shows the transcriptomic changes along malignancy continuum.log2FC in expression of this searched gene in stem-like cells from each diseased tissue sample relative to stem-like cells in normal samples in each tissue plotted against the malignancy continuum. Samples are colored based on if they are from different disease stage.
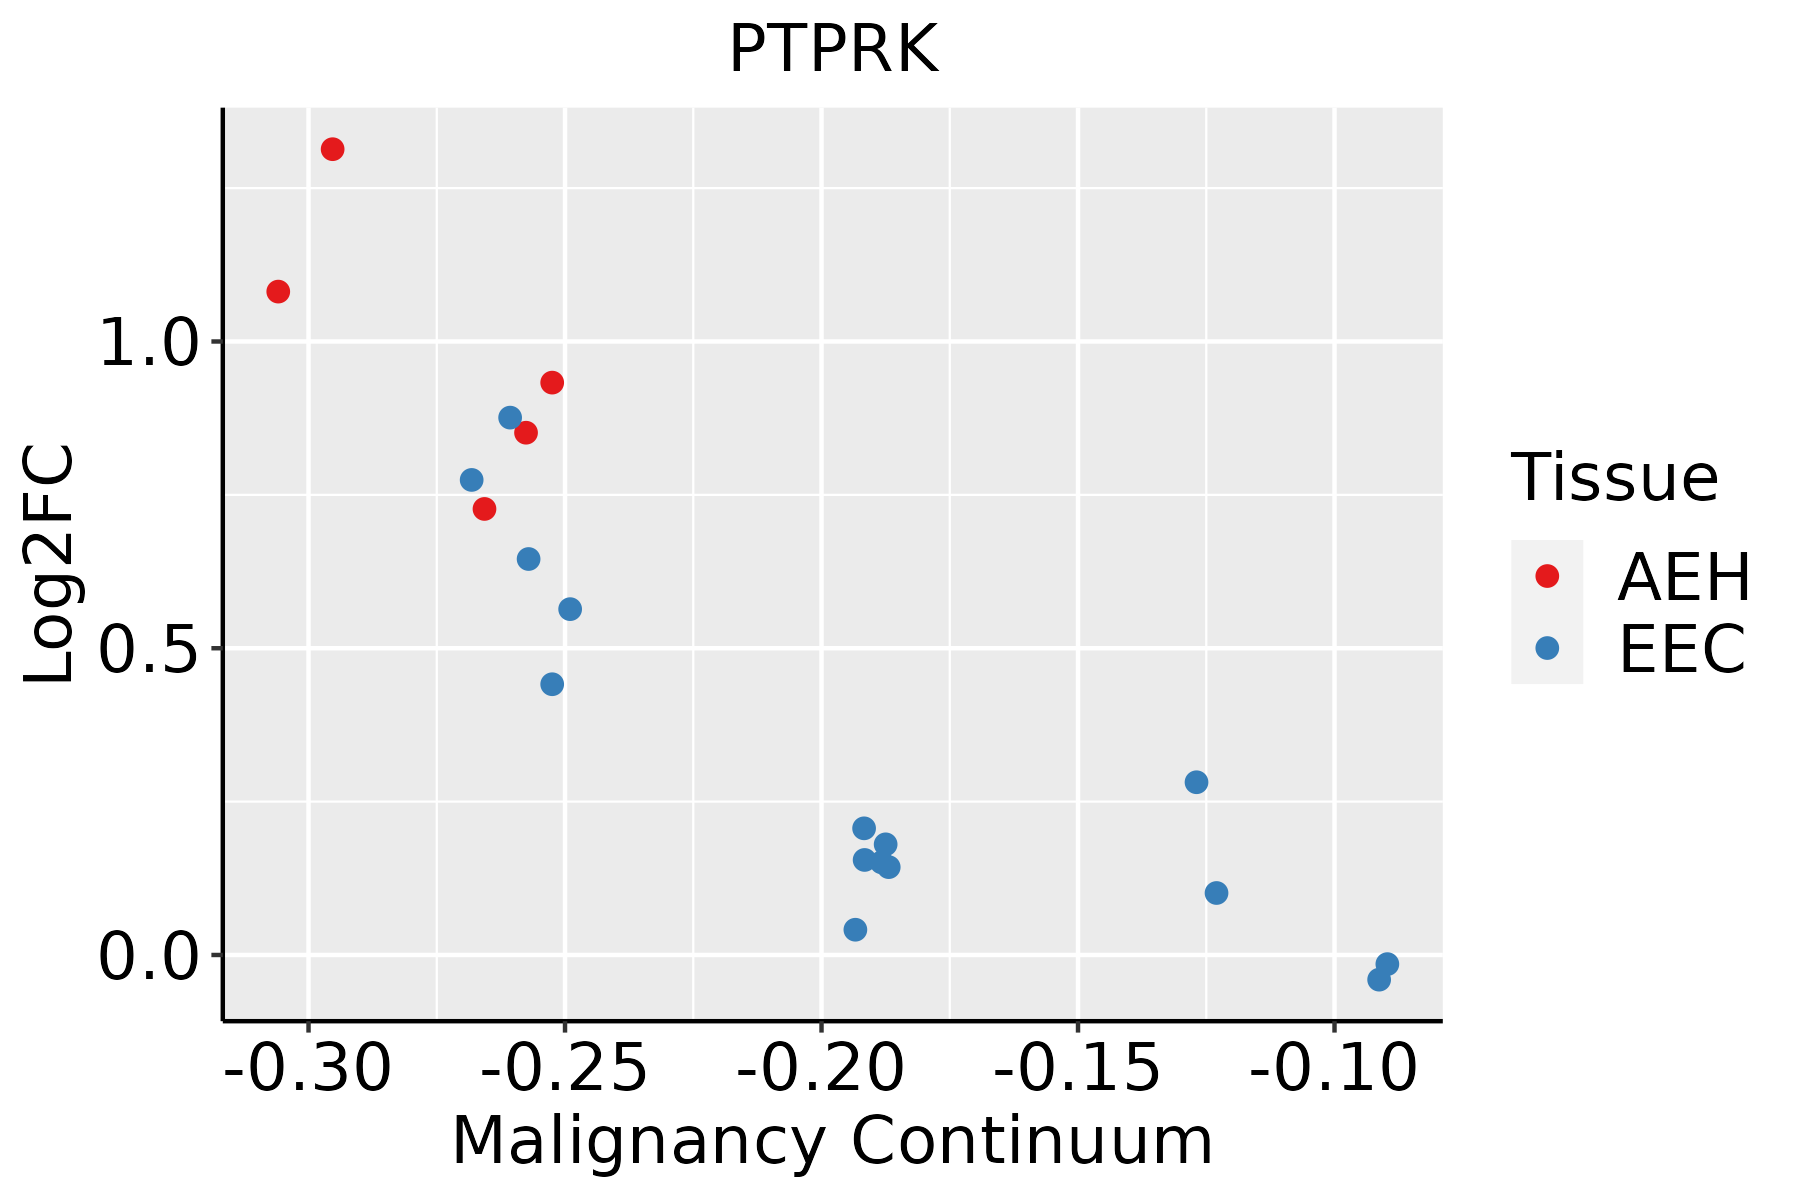
AEH: Atypical endometrial hyperplasia
EEC: Endometrioid Cancer
EsophagusThe image shows the transcriptomic changes along malignancy continuum.log2FC in expression of this searched gene in stem-like cells from each diseased tissue sample relative to stem-like cells in normal samples in each tissue plotted against the malignancy continuum. Samples are colored based on if they are from different disease stage.
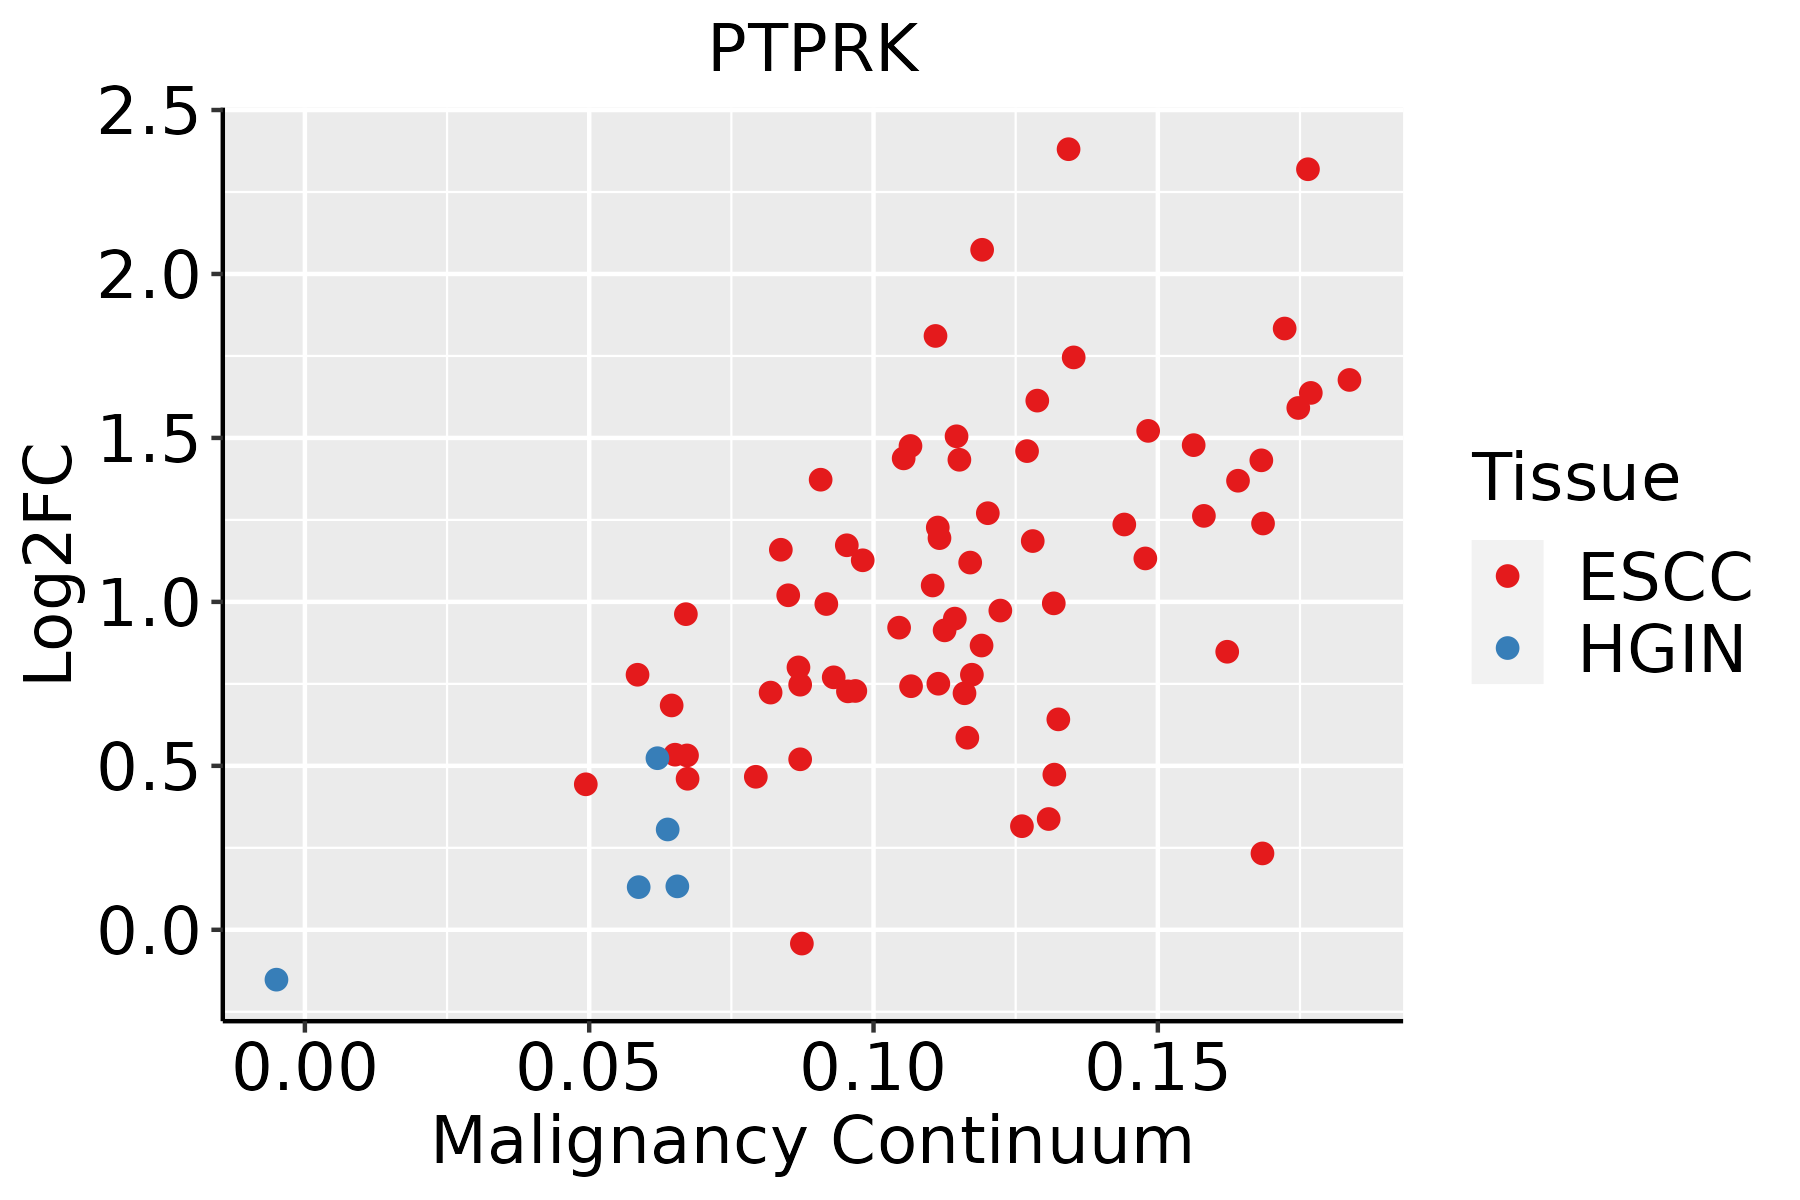
ESCC: Esophageal squamous cell carcinoma
HGIN: High-grade intraepithelial neoplasias
LGIN: Low-grade intraepithelial neoplasias
GCThe image shows the transcriptomic changes along malignancy continuum.log2FC in expression of this searched gene in stem-like cells from each diseased tissue sample relative to stem-like cells in normal samples in each tissue plotted against the malignancy continuum. Samples are colored based on if they are from different disease stage.CAG: Chronic atrophic gastritis
CAG with IM: Chronic atrophic gastritis with intestinal metaplasia
CSG: Chronic superficial gastritis
GC: Gastric cancer
SIM: Severe intestinal metaplasia
WIM: Wild intestinal metaplasia
LiverThe image shows the transcriptomic changes along malignancy continuum.log2FC in expression of this searched gene in stem-like cells from each diseased tissue sample relative to stem-like cells in normal samples in each tissue plotted against the malignancy continuum. Samples are colored based on if they are from different disease stage.HCC: Hepatocellular carcinoma
NAFLD: Non-alcoholic fatty liver disease
LungThe image shows the transcriptomic changes along malignancy continuum.log2FC in expression of this searched gene in stem-like cells from each diseased tissue sample relative to stem-like cells in normal samples in each tissue plotted against the malignancy continuum. Samples are colored based on if they are from different disease stage.AAH: Atypical adenomatous hyperplasia
AIS: Adenocarcinoma in situ
IAC: Invasive lung adenocarcinoma
MIA: Minimally invasive adenocarcinoma
Oral CavityThe image shows the transcriptomic changes along malignancy continuum.log2FC in expression of this searched gene in stem-like cells from each diseased tissue sample relative to stem-like cells in normal samples in each tissue plotted against the malignancy continuum. Samples are colored based on if they are from different disease stage.
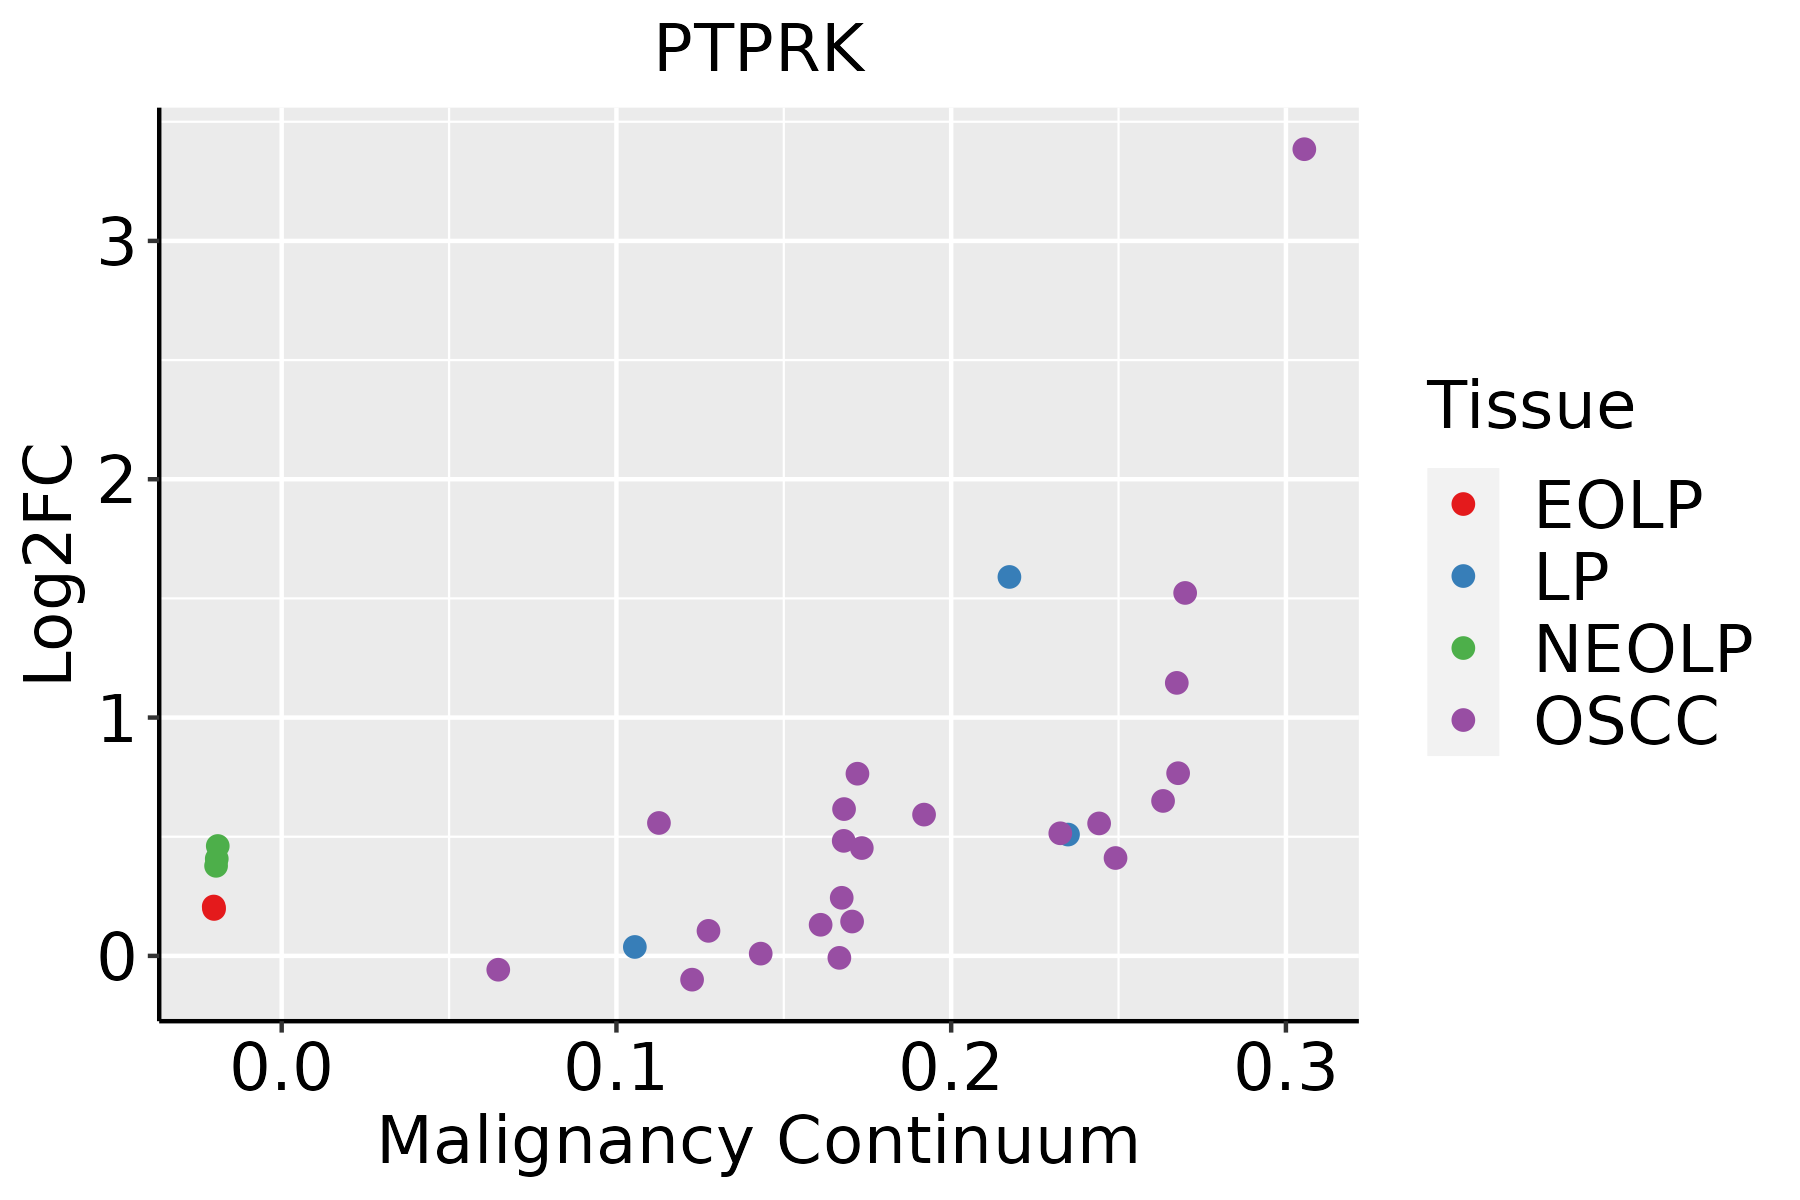
EOLP: Erosive Oral lichen planus
LP: leukoplakia
NEOLP: Non-erosive oral lichen planus
OSCC: Oral squamous cell carcinoma
ProstateThe image shows the transcriptomic changes along malignancy continuum.log2FC in expression of this searched gene in stem-like cells from each diseased tissue sample relative to stem-like cells in normal samples in each tissue plotted against the malignancy continuum. Samples are colored based on if they are from different disease stage.BPH: Benign Prostatic Hyperplasia
SkinThe image shows the transcriptomic changes along malignancy continuum.log2FC in expression of this searched gene in stem-like cells from each diseased tissue sample relative to stem-like cells in normal samples in each tissue plotted against the malignancy continuum. Samples are colored based on if they are from different disease stage.
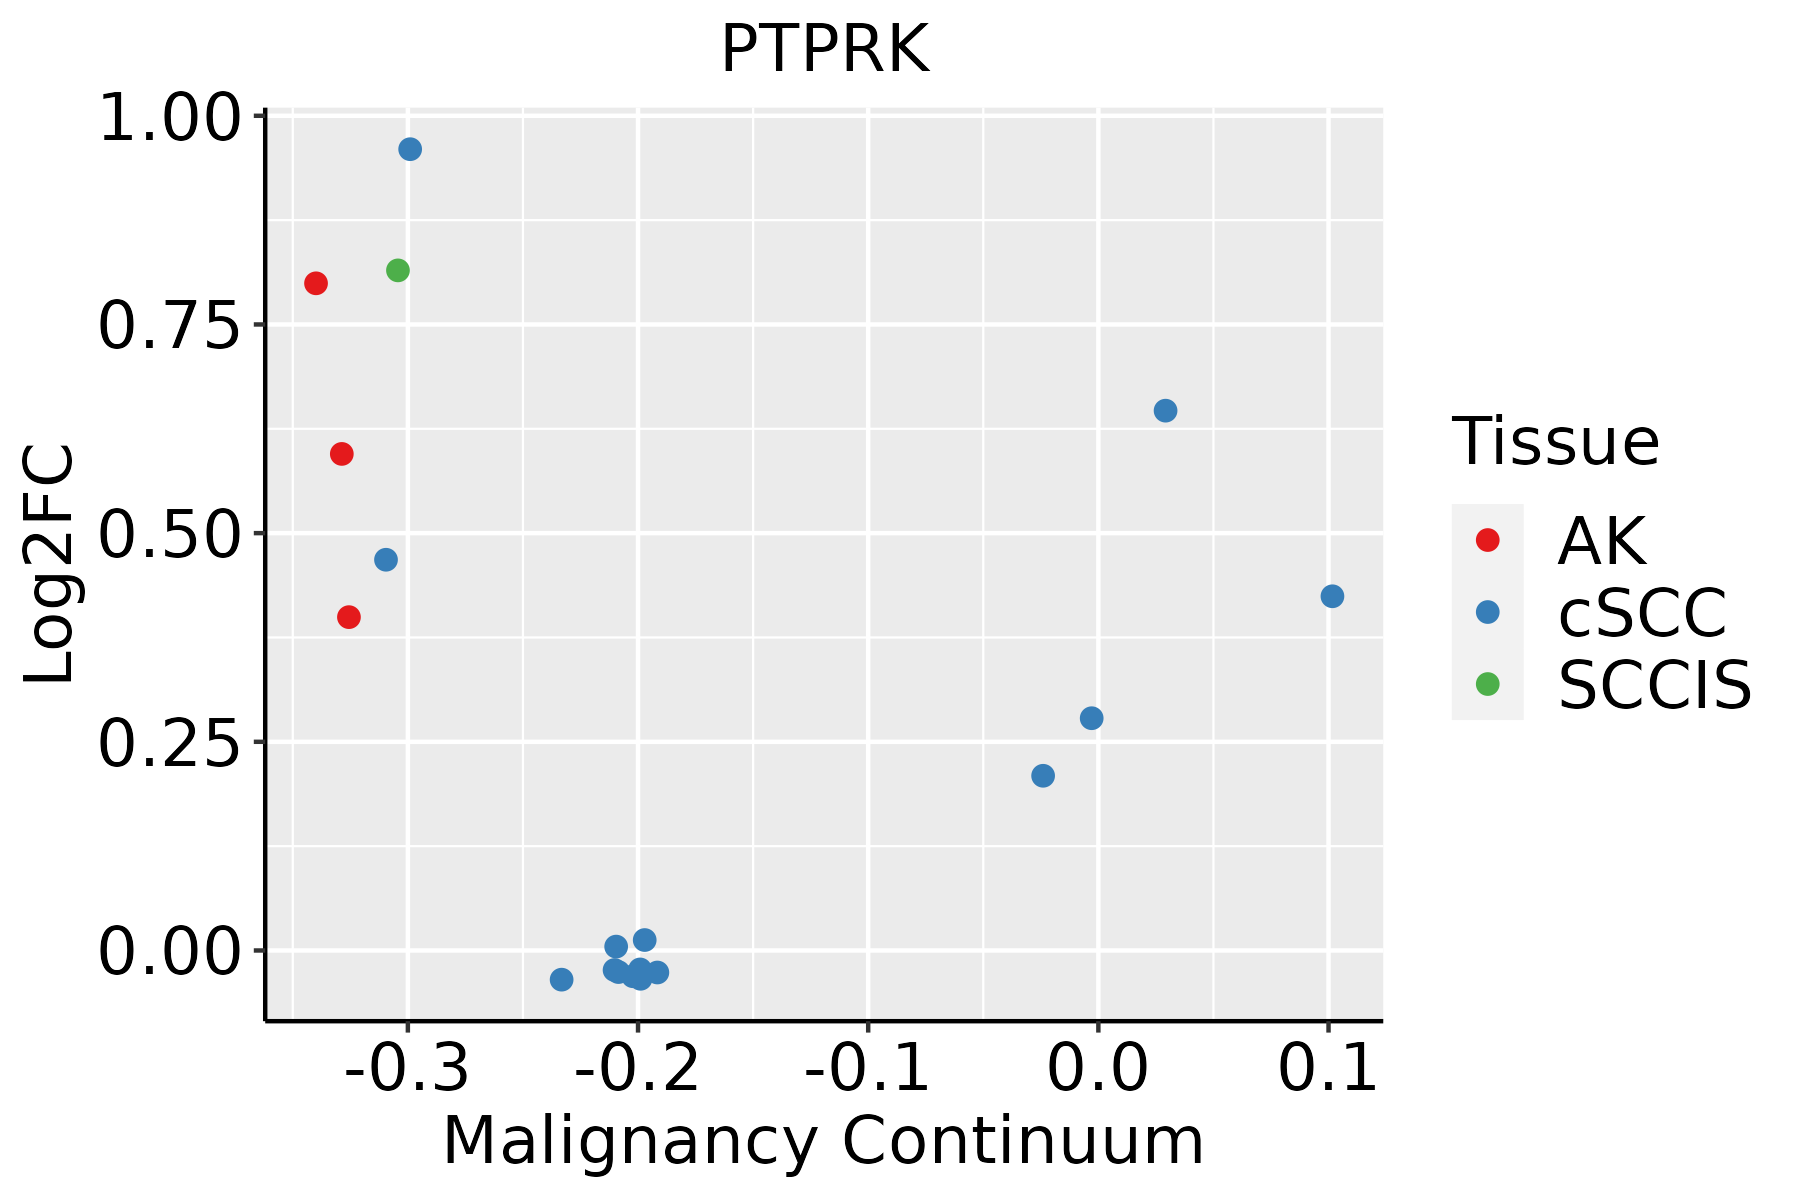
AK: Actinic keratosis
cSCC: Cutaneous squamous cell carcinoma
SCCIS:squamous cell carcinoma in situ
ThyroidThe image shows the transcriptomic changes along malignancy continuum.log2FC in expression of this searched gene in stem-like cells from each diseased tissue sample relative to stem-like cells in normal samples in each tissue plotted against the malignancy continuum. Samples are colored based on if they are from different disease stage.ATC: Anaplastic thyroid cancer
HT: Hashimoto's thyroiditis
PTC: Papillary thyroid cancer
∗log2FC in expression of this searched gene in stem-like cells from each diseased tissue sample relative to stem-like cells in normal samples in each tissue plotted against the malignancy continuum. Samples are colored based on if they are from different disease stage.

Top

Malignant transformation related pathway analysis

check buttonFind out the enriched GO biological processes and KEGG pathways involved in transition from healthy to precancer to cancer
check button Figure of enriched GO biological processes.
TissueDisease StageEnriched GO biological Processes
ColorectumADGO analysis - Figure of enriched GO biological processes: Top 15 enriched GO BP terms are showed in the bar plot of each disease state in each tissue. Each row represents a significant GO biological process which is colored according to the -log10(p.adjust).
ColorectumSERGO analysis - Figure of enriched GO biological processes: Top 15 enriched GO BP terms are showed in the bar plot of each disease state in each tissue. Each row represents a significant GO biological process which is colored according to the -log10(p.adjust).
ColorectumMSSGO analysis - Figure of enriched GO biological processes: Top 15 enriched GO BP terms are showed in the bar plot of each disease state in each tissue. Each row represents a significant GO biological process which is colored according to the -log10(p.adjust).
ColorectumMSI-HGO analysis - Figure of enriched GO biological processes: Top 15 enriched GO BP terms are showed in the bar plot of each disease state in each tissue. Each row represents a significant GO biological process which is colored according to the -log10(p.adjust).
ColorectumFAPGO analysis - Figure of enriched GO biological processes: Top 15 enriched GO BP terms are showed in the bar plot of each disease state in each tissue. Each row represents a significant GO biological process which is colored according to the -log10(p.adjust).
∗Top 15 enriched GO BP terms are showed in the bar plot of each disease state in each tissue. Each row represents a significant GO biological process which is colored according to the -log10(p.adjust).
Page: 1 2 3 4 5 6 7 8 9 

check button Enriched GO biological processes.
GO IDTissueDisease StageDescriptionGene RatioBg Ratiopvaluep.adjustCount
GO:00315898CervixCCcell-substrate adhesion96/2311363/187231.48e-138.85e-1196
GO:000697910CervixCCresponse to oxidative stress102/2311446/187232.99e-104.36e-08102
GO:01501159CervixCCcell-substrate junction organization37/2311101/187233.20e-104.46e-0837
GO:00421108CervixCCT cell activation107/2311487/187231.24e-091.46e-07107
GO:00506737CervixCCepithelial cell proliferation98/2311437/187232.01e-092.15e-0798
GO:00070448CervixCCcell-substrate junction assembly34/231195/187233.35e-093.45e-0734
GO:00071608CervixCCcell-matrix adhesion60/2311233/187231.58e-081.23e-0660
GO:000030210CervixCCresponse to reactive oxygen species56/2311222/187231.00e-075.25e-0656
GO:006219710CervixCCcellular response to chemical stress76/2311337/187231.01e-075.25e-0676
GO:00506787CervixCCregulation of epithelial cell proliferation83/2311381/187231.31e-076.42e-0683
GO:00343298CervixCCcell junction assembly88/2311420/187233.42e-071.38e-0588
GO:00480417CervixCCfocal adhesion assembly28/231187/187239.86e-073.45e-0528
GO:003459910CervixCCcellular response to oxidative stress63/2311288/187233.58e-069.50e-0563
GO:00712148CervixCCcellular response to abiotic stimulus69/2311331/187237.36e-061.73e-0469
GO:01040048CervixCCcellular response to environmental stimulus69/2311331/187237.36e-061.73e-0469
GO:00064708CervixCCprotein dephosphorylation60/2311281/187231.33e-052.68e-0460
GO:00512713CervixCCnegative regulation of cellular component movement73/2311367/187232.22e-053.95e-0473
GO:00400133CervixCCnegative regulation of locomotion76/2311391/187233.47e-055.60e-0476
GO:20001463CervixCCnegative regulation of cell motility71/2311359/187233.47e-055.60e-0471
GO:00093149CervixCCresponse to radiation86/2311456/187233.50e-055.63e-0486
Page: 1 2 3 4 5 6 7 8 9 10 11 12 13 14 15 16 17 18 19 20 21 22 23 24 25 26 27 28 29 30 31 32 33 34 35 36 37 38 

check button Enriched KEGG pathways.
Pathway IDTissueDisease StageDescriptionGene RatioBg Ratiopvaluep.adjustqvalueCount
Page: 1 

Top

Cell-cell communication analysis

check buttonIdentification of potential cell-cell interactions between two cell types and their ligand-receptor pairs for different disease states
LigandReceptorLRpairPathwayTissueDisease Stage
Page: 1 

Top

Single-cell gene regulatory network inference analysis

check buttonFind out the significant the regulons (TFs) and the target genes of each regulon across cell types for different disease states
TFCell TypeTissueDisease StageTarget GeneRSSRegulon Activity
∗The dot plots of a searched regulon are shown for all cell subpopulations in each disease state of each tissue based on the regulon specific score inferred using pySCENIC and by calculating the average expression.
Page: 1 

Top

Somatic mutation of malignant transformation related genes

check buttonAnnotation of somatic variants for genes involved in malignant transformation
Hugo SymbolVariant ClassVariant ClassificationdbSNP RSHGVScHGVSpHGVSp ShortSWISSPROTBIOTYPESIFTPolyPhenTumor Sample BarcodeTissueHistologySexAgeStageTherapy TypesDrugsOutcome
PTPRKSNVMissense_Mutationc.4103N>Ap.Pro1368Hisp.P1368HQ15262protein_codingdeleterious(0)probably_damaging(1)TCGA-A2-A25A-01Breastbreast invasive carcinomaFemale<65I/IIUnspecificCytoxanSD
PTPRKSNVMissense_Mutationnovelc.1970N>Ap.Thr657Lysp.T657KQ15262protein_codingdeleterious(0.02)benign(0.15)TCGA-A7-A3IZ-01Breastbreast invasive carcinomaFemale<65I/IIChemotherapycytoxanSD
PTPRKSNVMissense_Mutationrs372899705c.2630N>Tp.Thr877Ilep.T877IQ15262protein_codingdeleterious(0)probably_damaging(0.979)TCGA-AN-A0AK-01Breastbreast invasive carcinomaFemale>=65I/IIUnknownUnknownSD
PTPRKSNVMissense_Mutationc.1345N>Tp.Ala449Serp.A449SQ15262protein_codingtolerated(1)benign(0.099)TCGA-BH-A0EB-01Breastbreast invasive carcinomaFemale>=65I/IIHormone TherapyarimidexSD
PTPRKSNVMissense_Mutationc.3706G>Ap.Asp1236Asnp.D1236NQ15262protein_codingdeleterious(0)probably_damaging(0.996)TCGA-GM-A2D9-01Breastbreast invasive carcinomaFemale>=65I/IIHormone TherapyarimidexSD
PTPRKSNVMissense_Mutationrs375206155c.2650N>Gp.Ile884Valp.I884VQ15262protein_codingtolerated(0.6)benign(0.001)TCGA-PE-A5DD-01Breastbreast invasive carcinomaFemale<65I/IIChemotherapyCR
PTPRKinsertionFrame_Shift_Insnovelc.3787_3788insGAGGp.Gln1263ArgfsTer26p.Q1263Rfs*26Q15262protein_codingTCGA-AO-A03R-01Breastbreast invasive carcinomaFemale<65I/IIChemotherapydoxorubicinSD
PTPRKinsertionFrame_Shift_Insnovelc.3786_3787insTGGAAAAGTGGCAGGAGGAATGp.Gln1263TrpfsTer32p.Q1263Wfs*32Q15262protein_codingTCGA-AO-A03R-01Breastbreast invasive carcinomaFemale<65I/IIChemotherapydoxorubicinSD
PTPRKinsertionFrame_Shift_Insnovelc.315_316insTTp.Ile106LeufsTer14p.I106Lfs*14Q15262protein_codingTCGA-AQ-A04J-01Breastbreast invasive carcinomaFemale<65I/IIChemotherapycytoxanSD
PTPRKinsertionFrame_Shift_Insnovelc.314_315insGTGGTTTGACAAAGAGCTAp.Cys105TrpfsTer9p.C105Wfs*9Q15262protein_codingTCGA-AQ-A04J-01Breastbreast invasive carcinomaFemale<65I/IIChemotherapycytoxanSD
Page: 1 2 3 4 5 6 7 8 9 10 11 12 13 14 15 16 17 18 19 

Top

Related drugs of malignant transformation related genes

check buttonIdentification of chemicals and drugs interact with genes involved in malignant transfromation
(DGIdb 4.0)
Entrez IDSymbolCategoryInteraction TypesDrug Claim NameDrug NamePMIDs
Page: 1