
|
|||||
|
 | |
| |
| |
| |
| |
| |
|
Gene: PRKAR2A |
Gene summary for PRKAR2A |
| Gene information | Species | Human | Gene symbol | PRKAR2A | Gene ID | 5576 |
| Gene name | protein kinase cAMP-dependent type II regulatory subunit alpha | |
| Gene Alias | PKR2 | |
| Cytomap | 3p21.31 | |
| Gene Type | protein-coding | GO ID | GO:0001932 | UniProtAcc | A0A024R2W3 |
Top |
Malignant transformation analysis |
| Identification of the aberrant gene expression in precancerous and cancerous lesions by comparing the gene expression of stem-like cells in diseased tissues with normal stem cells |
| Entrez ID | Symbol | Replicates | Species | Organ | Tissue | Adj P-value | Log2FC | Malignancy |
| 5576 | PRKAR2A | NEOLP-3 | Human | Oral cavity | NEOLP | 4.57e-03 | 1.81e-01 | -0.0191 |
| 5576 | PRKAR2A | SYSMH1 | Human | Oral cavity | OSCC | 2.44e-06 | 2.29e-01 | 0.1127 |
| 5576 | PRKAR2A | SYSMH2 | Human | Oral cavity | OSCC | 8.95e-07 | 3.23e-01 | 0.2326 |
| 5576 | PRKAR2A | SYSMH3 | Human | Oral cavity | OSCC | 6.77e-24 | 6.68e-01 | 0.2442 |
| 5576 | PRKAR2A | SYSMH5 | Human | Oral cavity | OSCC | 3.84e-04 | 1.85e-01 | 0.0647 |
| 5576 | PRKAR2A | SYSMH6 | Human | Oral cavity | OSCC | 1.31e-04 | 1.54e-01 | 0.1275 |
| 5576 | PRKAR2A | P4_S8_cSCC | Human | Skin | cSCC | 3.66e-04 | 1.73e-01 | -0.3095 |
| 5576 | PRKAR2A | P5_S10_cSCC | Human | Skin | cSCC | 6.96e-04 | 7.02e-02 | -0.299 |
| 5576 | PRKAR2A | P1_cSCC | Human | Skin | cSCC | 2.64e-23 | 8.15e-01 | 0.0292 |
| 5576 | PRKAR2A | P2_cSCC | Human | Skin | cSCC | 4.59e-09 | 3.95e-01 | -0.024 |
| 5576 | PRKAR2A | P4_cSCC | Human | Skin | cSCC | 1.26e-14 | 4.44e-01 | -0.00290000000000005 |
| 5576 | PRKAR2A | P10_cSCC | Human | Skin | cSCC | 2.45e-16 | 6.15e-01 | 0.1017 |
| 5576 | PRKAR2A | cSCC_p8 | Human | Skin | cSCC | 8.71e-03 | 8.04e-02 | -0.1971 |
| 5576 | PRKAR2A | male-WTA | Human | Thyroid | PTC | 1.31e-28 | 7.55e-02 | 0.1037 |
| 5576 | PRKAR2A | PTC01 | Human | Thyroid | PTC | 1.78e-13 | 8.70e-02 | 0.1899 |
| 5576 | PRKAR2A | PTC03 | Human | Thyroid | PTC | 1.73e-03 | 1.21e-01 | 0.1784 |
| 5576 | PRKAR2A | PTC04 | Human | Thyroid | PTC | 2.90e-17 | 1.95e-01 | 0.1927 |
| 5576 | PRKAR2A | PTC05 | Human | Thyroid | PTC | 2.43e-08 | 4.31e-01 | 0.2065 |
| 5576 | PRKAR2A | PTC06 | Human | Thyroid | PTC | 1.81e-23 | 5.33e-01 | 0.2057 |
| 5576 | PRKAR2A | PTC07 | Human | Thyroid | PTC | 3.48e-14 | 3.43e-01 | 0.2044 |
| Page: 1 2 3 4 5 6 7 8 |
| Tissue | Expression Dynamics | Abbreviation |
| Colorectum (GSE201348) |  | FAP: Familial adenomatous polyposis |
| CRC: Colorectal cancer | ||
| Colorectum (HTA11) |  | AD: Adenomas |
| SER: Sessile serrated lesions | ||
| MSI-H: Microsatellite-high colorectal cancer | ||
| MSS: Microsatellite stable colorectal cancer | ||
| Esophagus | 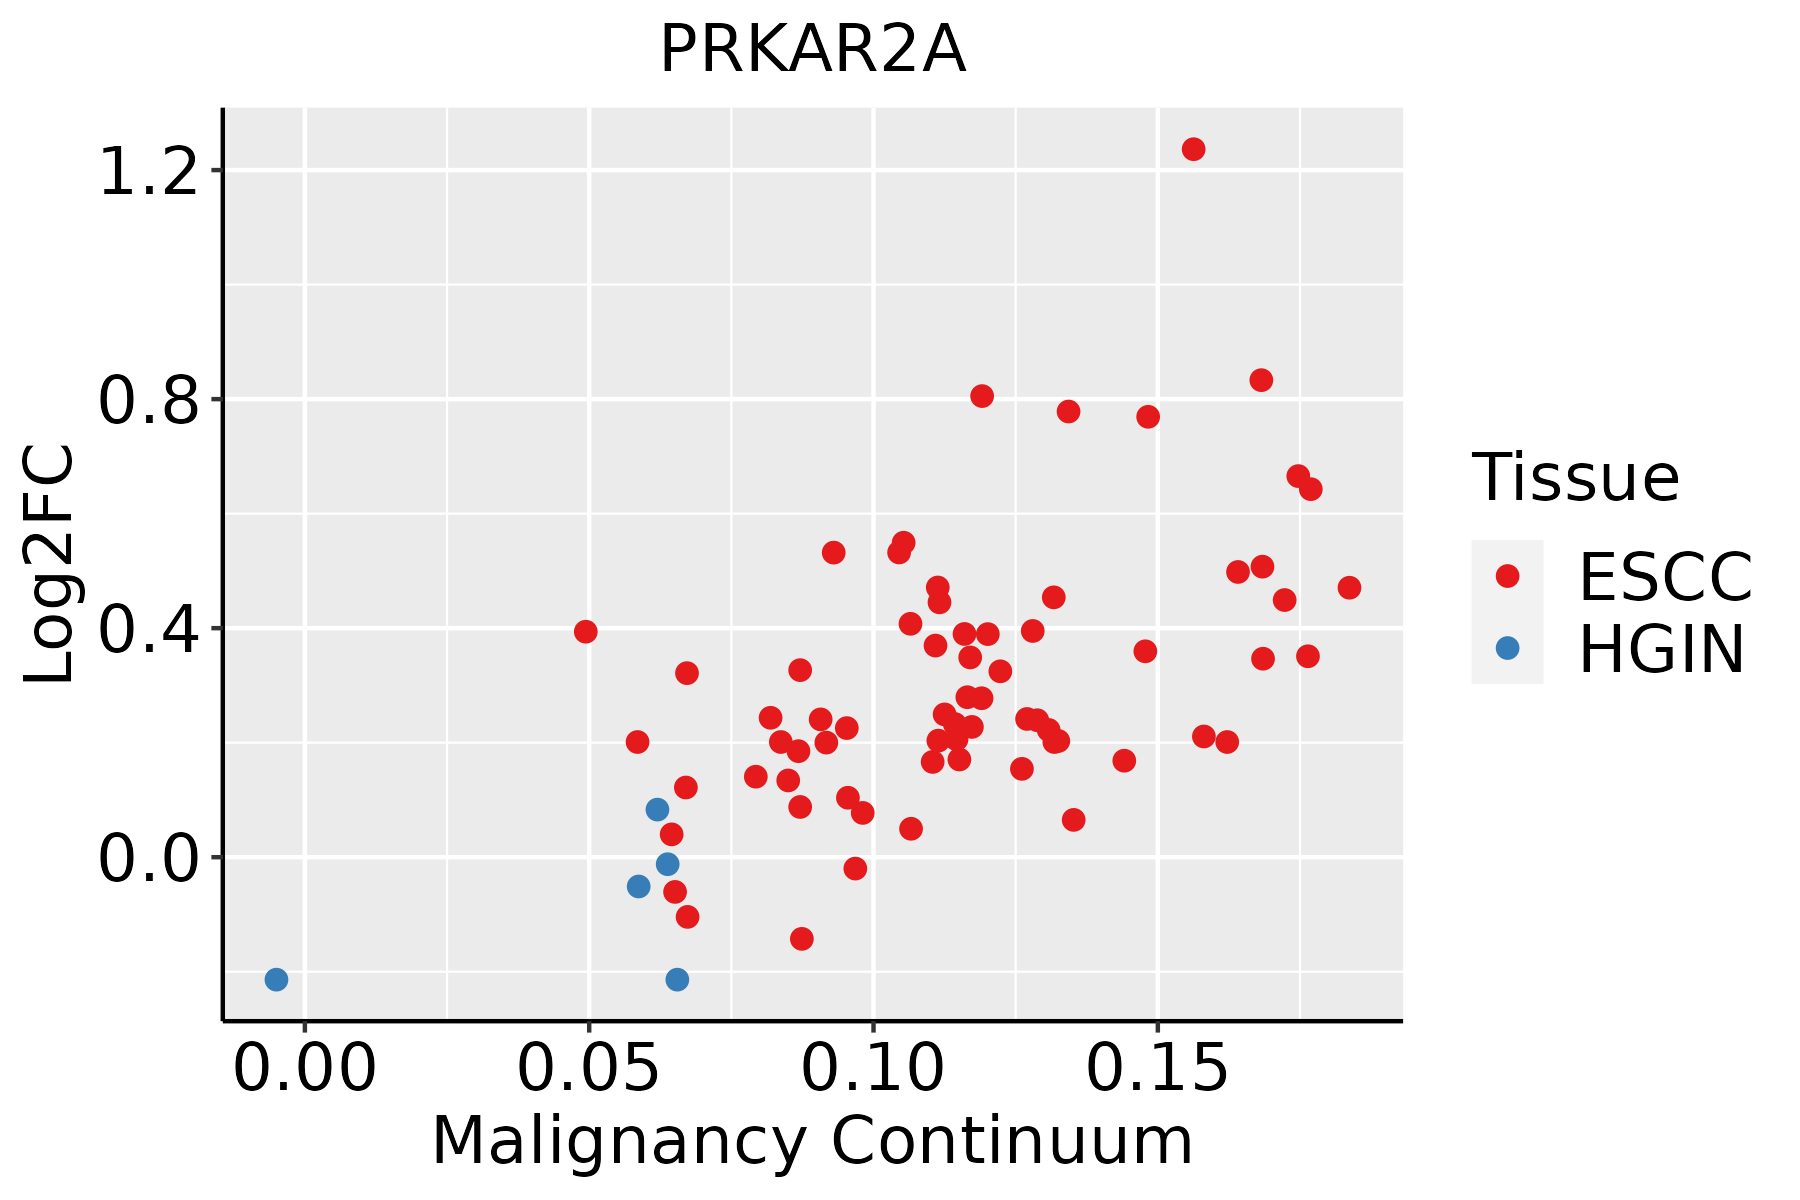 | ESCC: Esophageal squamous cell carcinoma |
| HGIN: High-grade intraepithelial neoplasias | ||
| LGIN: Low-grade intraepithelial neoplasias | ||
| Liver | 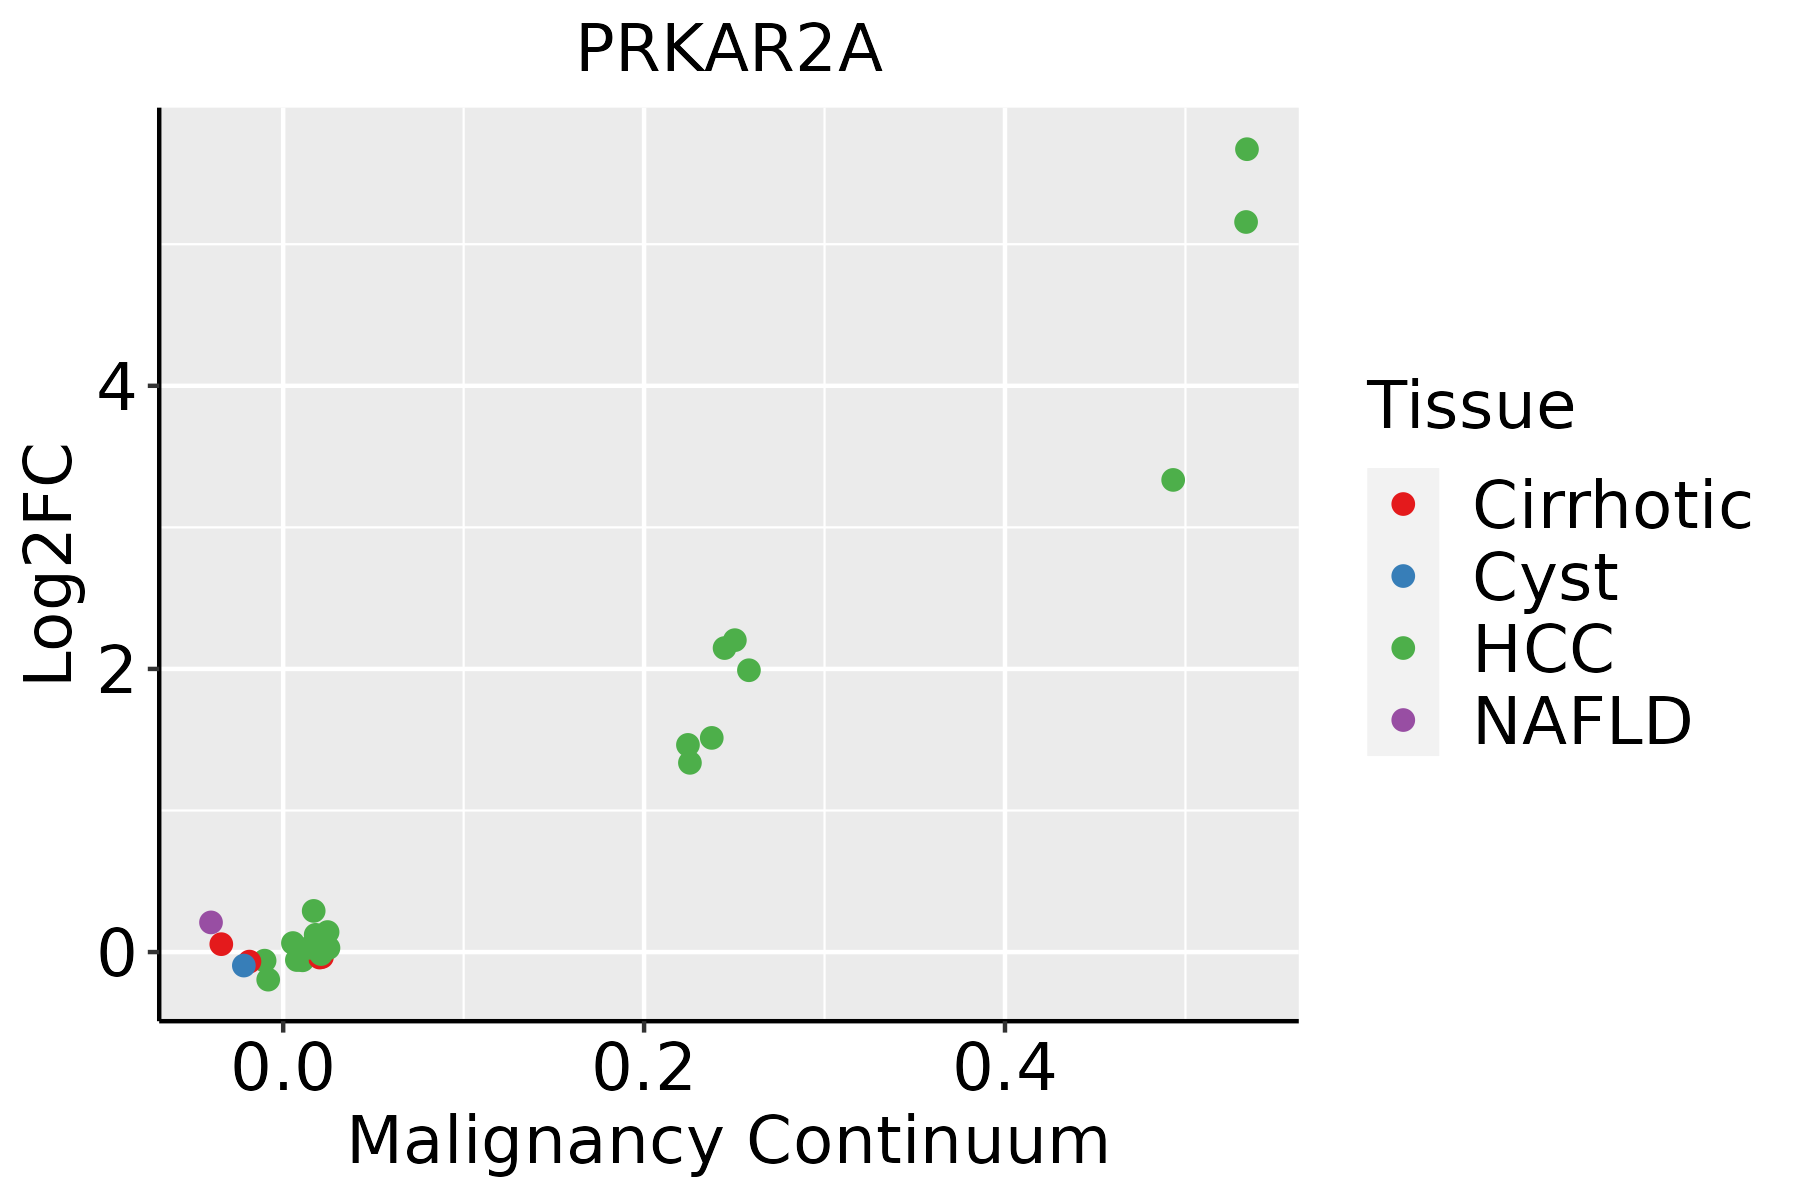 | HCC: Hepatocellular carcinoma |
| NAFLD: Non-alcoholic fatty liver disease | ||
| Oral Cavity |  | EOLP: Erosive Oral lichen planus |
| LP: leukoplakia | ||
| NEOLP: Non-erosive oral lichen planus | ||
| OSCC: Oral squamous cell carcinoma | ||
| Prostate | 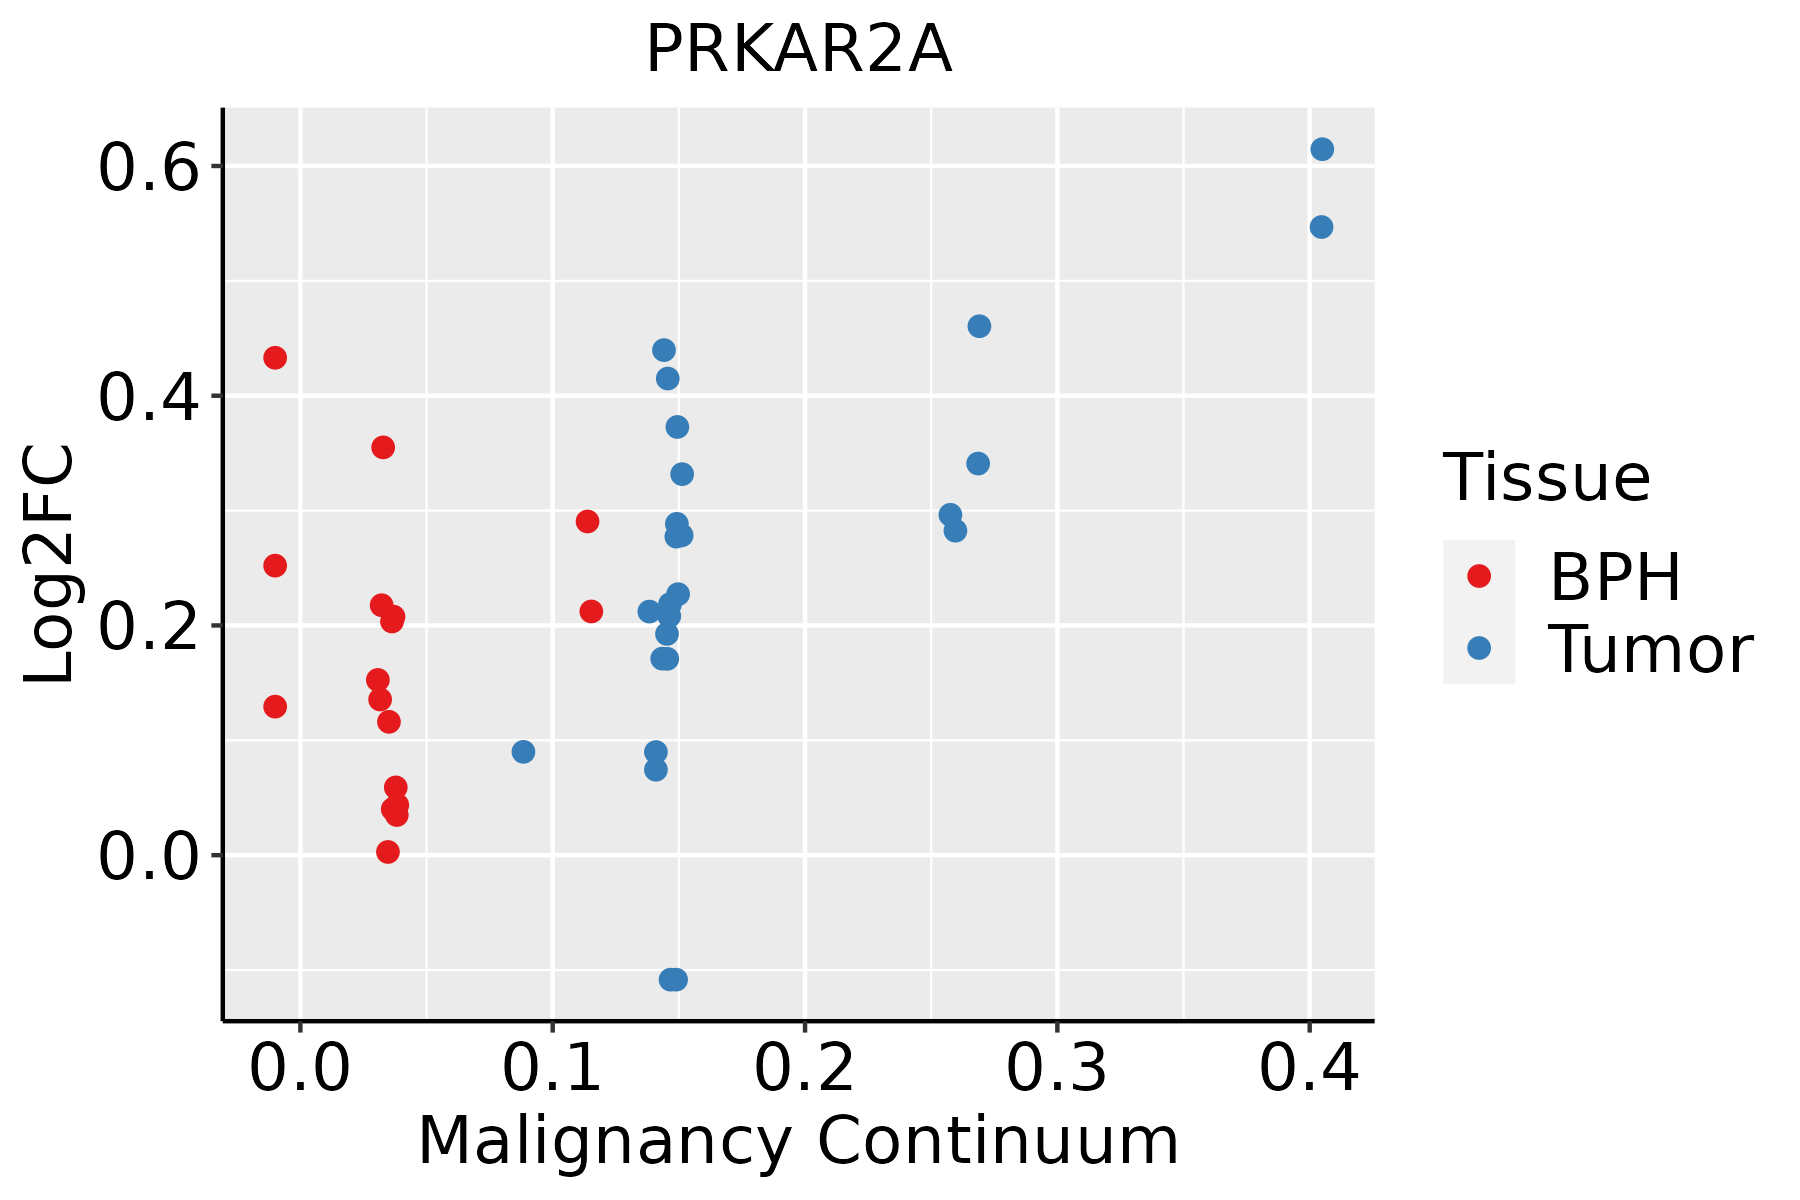 | BPH: Benign Prostatic Hyperplasia |
| Skin | 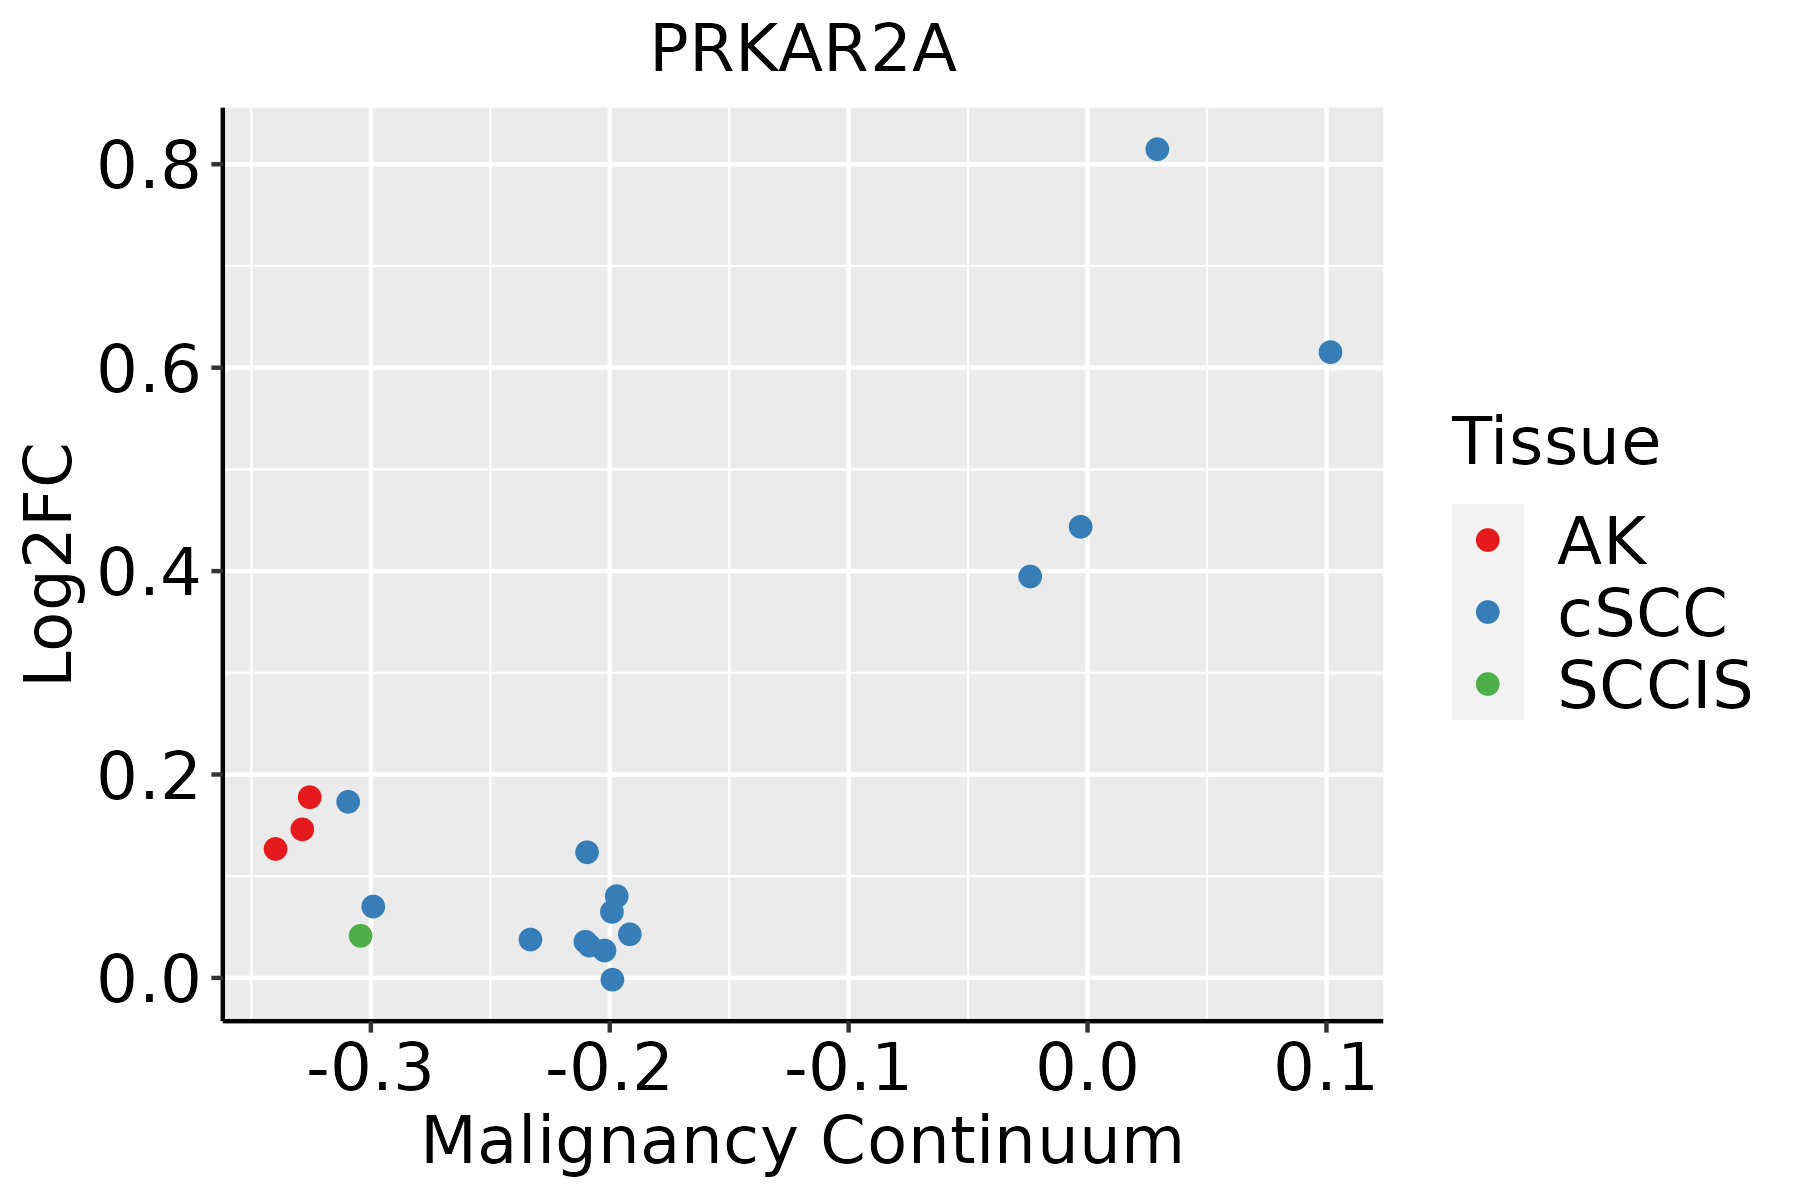 | AK: Actinic keratosis |
| cSCC: Cutaneous squamous cell carcinoma | ||
| SCCIS:squamous cell carcinoma in situ | ||
| Thyroid | 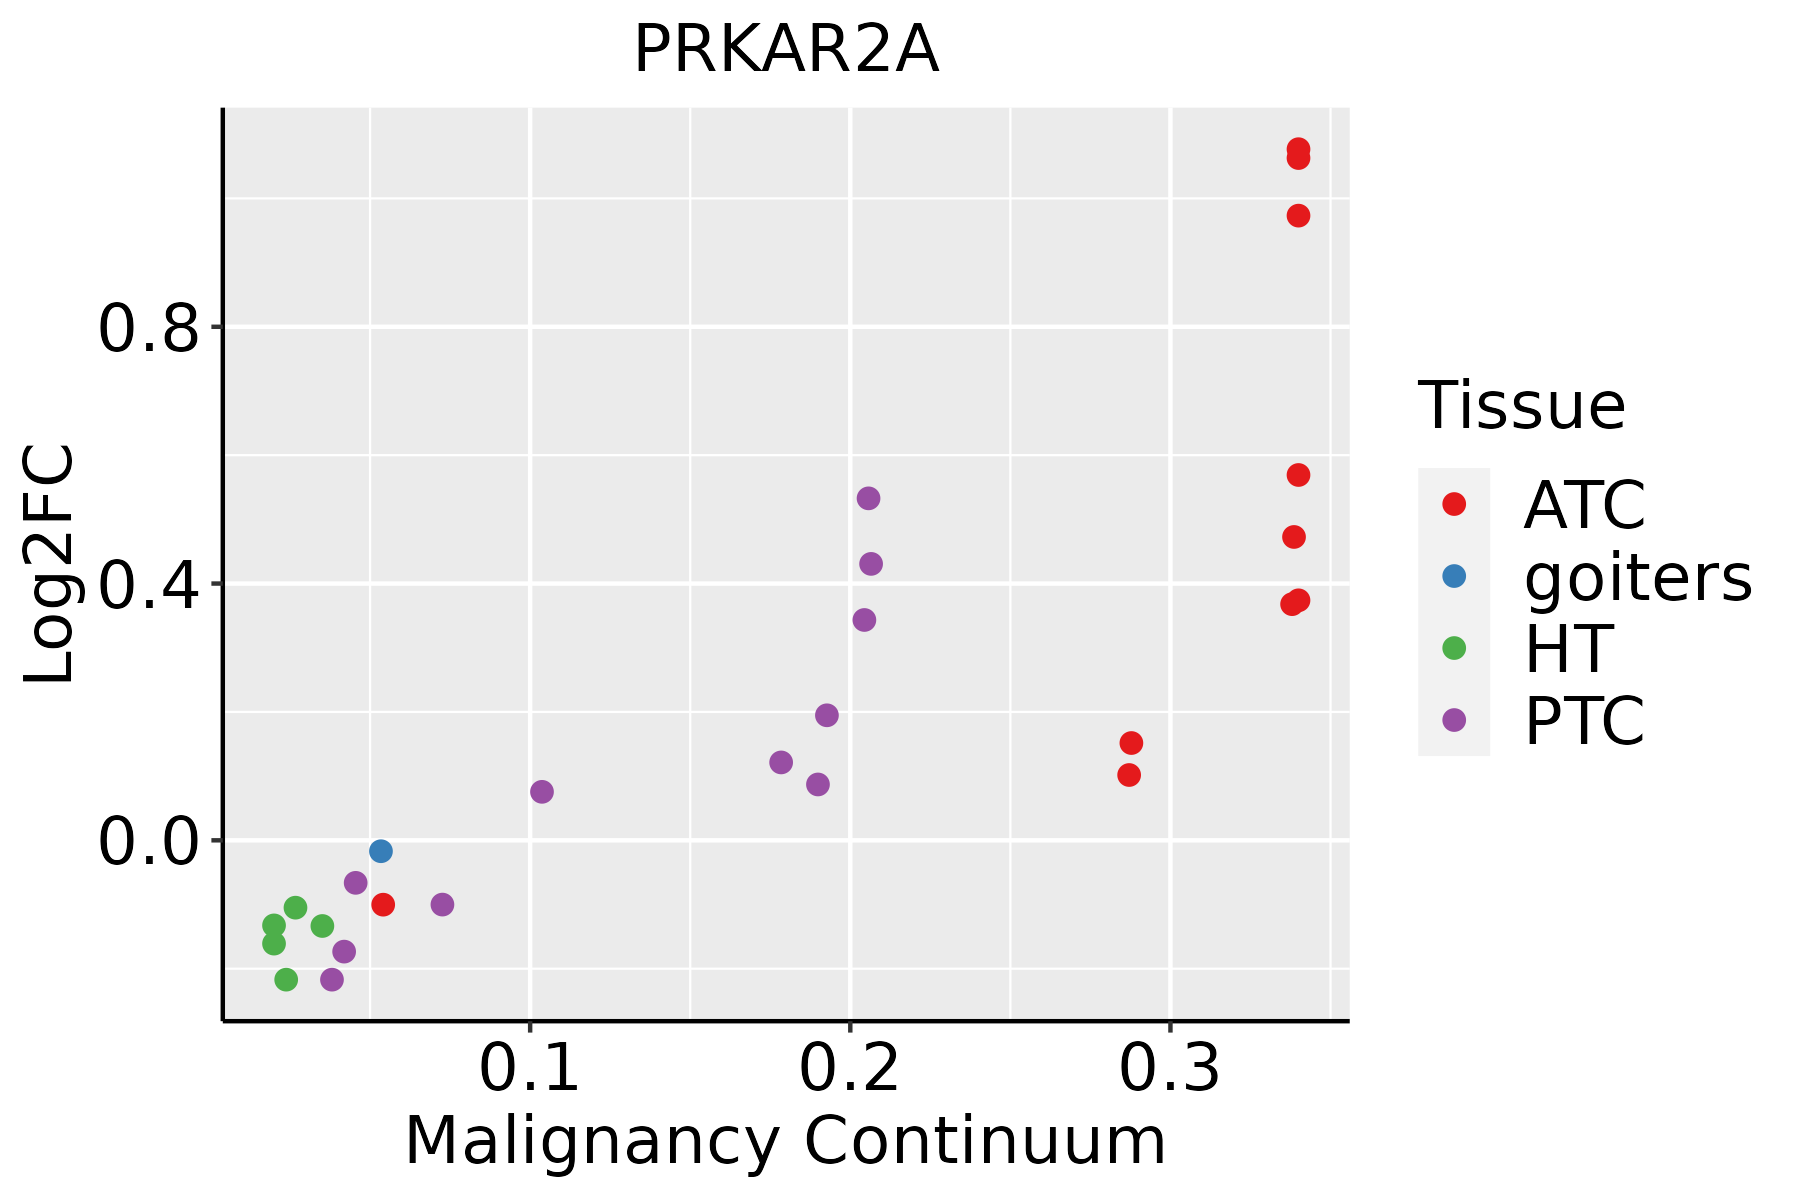 | ATC: Anaplastic thyroid cancer |
| HT: Hashimoto's thyroiditis | ||
| PTC: Papillary thyroid cancer |
| ∗log2FC in expression of this searched gene in stem-like cells from each diseased tissue sample relative to stem-like cells in normal samples in each tissue plotted against the malignancy continuum. Samples are colored based on if they are from different disease stage. |
Top |
Malignant transformation related pathway analysis |
| Find out the enriched GO biological processes and KEGG pathways involved in transition from healthy to precancer to cancer |
| Tissue | Disease Stage | Enriched GO biological Processes |
| Colorectum | AD |  |
| Colorectum | SER |  |
| Colorectum | MSS |  |
| Colorectum | MSI-H |  |
| Colorectum | FAP |  |
| ∗Top 15 enriched GO BP terms are showed in the bar plot of each disease state in each tissue. Each row represents a significant GO biological process which is colored according to the -log10(p.adjust). |
| Page: 1 2 3 4 5 6 7 8 9 |
| GO ID | Tissue | Disease Stage | Description | Gene Ratio | Bg Ratio | pvalue | p.adjust | Count |
| GO:0010563 | Colorectum | AD | negative regulation of phosphorus metabolic process | 130/3918 | 442/18723 | 1.26e-05 | 2.76e-04 | 130 |
| GO:0045936 | Colorectum | AD | negative regulation of phosphate metabolic process | 129/3918 | 441/18723 | 1.81e-05 | 3.76e-04 | 129 |
| GO:0051348 | Colorectum | AD | negative regulation of transferase activity | 85/3918 | 268/18723 | 2.07e-05 | 4.19e-04 | 85 |
| GO:0042326 | Colorectum | AD | negative regulation of phosphorylation | 112/3918 | 385/18723 | 8.02e-05 | 1.27e-03 | 112 |
| GO:0001933 | Colorectum | AD | negative regulation of protein phosphorylation | 101/3918 | 342/18723 | 9.39e-05 | 1.42e-03 | 101 |
| GO:0006469 | Colorectum | AD | negative regulation of protein kinase activity | 65/3918 | 212/18723 | 5.21e-04 | 5.62e-03 | 65 |
| GO:0033673 | Colorectum | AD | negative regulation of kinase activity | 71/3918 | 237/18723 | 6.18e-04 | 6.47e-03 | 71 |
| GO:0071900 | Colorectum | AD | regulation of protein serine/threonine kinase activity | 98/3918 | 359/18723 | 2.18e-03 | 1.73e-02 | 98 |
| GO:00513481 | Colorectum | SER | negative regulation of transferase activity | 70/2897 | 268/18723 | 4.27e-06 | 1.62e-04 | 70 |
| GO:00105631 | Colorectum | SER | negative regulation of phosphorus metabolic process | 101/2897 | 442/18723 | 2.39e-05 | 6.70e-04 | 101 |
| GO:00459361 | Colorectum | SER | negative regulation of phosphate metabolic process | 100/2897 | 441/18723 | 3.62e-05 | 9.39e-04 | 100 |
| GO:00019331 | Colorectum | SER | negative regulation of protein phosphorylation | 79/2897 | 342/18723 | 1.21e-04 | 2.49e-03 | 79 |
| GO:00423261 | Colorectum | SER | negative regulation of phosphorylation | 86/2897 | 385/18723 | 2.10e-04 | 3.78e-03 | 86 |
| GO:00336731 | Colorectum | SER | negative regulation of kinase activity | 57/2897 | 237/18723 | 3.48e-04 | 5.46e-03 | 57 |
| GO:00064691 | Colorectum | SER | negative regulation of protein kinase activity | 52/2897 | 212/18723 | 3.75e-04 | 5.74e-03 | 52 |
| GO:00719001 | Colorectum | SER | regulation of protein serine/threonine kinase activity | 74/2897 | 359/18723 | 5.22e-03 | 3.96e-02 | 74 |
| GO:00513482 | Colorectum | MSS | negative regulation of transferase activity | 80/3467 | 268/18723 | 4.06e-06 | 1.17e-04 | 80 |
| GO:00105632 | Colorectum | MSS | negative regulation of phosphorus metabolic process | 118/3467 | 442/18723 | 1.18e-05 | 2.77e-04 | 118 |
| GO:00459362 | Colorectum | MSS | negative regulation of phosphate metabolic process | 117/3467 | 441/18723 | 1.74e-05 | 3.84e-04 | 117 |
| GO:00423262 | Colorectum | MSS | negative regulation of phosphorylation | 103/3467 | 385/18723 | 3.76e-05 | 7.17e-04 | 103 |
| Page: 1 2 3 4 5 6 7 |
| Pathway ID | Tissue | Disease Stage | Description | Gene Ratio | Bg Ratio | pvalue | p.adjust | qvalue | Count |
| hsa04910 | Colorectum | MSS | Insulin signaling pathway | 43/1875 | 137/8465 | 7.37e-03 | 2.84e-02 | 1.74e-02 | 43 |
| hsa049101 | Colorectum | MSS | Insulin signaling pathway | 43/1875 | 137/8465 | 7.37e-03 | 2.84e-02 | 1.74e-02 | 43 |
| hsa049102 | Colorectum | FAP | Insulin signaling pathway | 36/1404 | 137/8465 | 2.51e-03 | 1.18e-02 | 7.18e-03 | 36 |
| hsa049103 | Colorectum | FAP | Insulin signaling pathway | 36/1404 | 137/8465 | 2.51e-03 | 1.18e-02 | 7.18e-03 | 36 |
| hsa049104 | Colorectum | CRC | Insulin signaling pathway | 31/1091 | 137/8465 | 1.07e-03 | 8.91e-03 | 6.03e-03 | 31 |
| hsa049105 | Colorectum | CRC | Insulin signaling pathway | 31/1091 | 137/8465 | 1.07e-03 | 8.91e-03 | 6.03e-03 | 31 |
| hsa049109 | Esophagus | ESCC | Insulin signaling pathway | 89/4205 | 137/8465 | 1.97e-04 | 7.32e-04 | 3.75e-04 | 89 |
| hsa0491014 | Esophagus | ESCC | Insulin signaling pathway | 89/4205 | 137/8465 | 1.97e-04 | 7.32e-04 | 3.75e-04 | 89 |
| hsa0491021 | Liver | Cirrhotic | Insulin signaling pathway | 56/2530 | 137/8465 | 3.74e-03 | 1.50e-02 | 9.26e-03 | 56 |
| hsa0491031 | Liver | Cirrhotic | Insulin signaling pathway | 56/2530 | 137/8465 | 3.74e-03 | 1.50e-02 | 9.26e-03 | 56 |
| hsa0491041 | Liver | HCC | Insulin signaling pathway | 95/4020 | 137/8465 | 1.53e-07 | 1.97e-06 | 1.10e-06 | 95 |
| hsa0491051 | Liver | HCC | Insulin signaling pathway | 95/4020 | 137/8465 | 1.53e-07 | 1.97e-06 | 1.10e-06 | 95 |
| hsa049108 | Oral cavity | OSCC | Insulin signaling pathway | 83/3704 | 137/8465 | 4.83e-05 | 2.00e-04 | 1.02e-04 | 83 |
| hsa0491013 | Oral cavity | OSCC | Insulin signaling pathway | 83/3704 | 137/8465 | 4.83e-05 | 2.00e-04 | 1.02e-04 | 83 |
| hsa0491023 | Oral cavity | EOLP | Insulin signaling pathway | 33/1218 | 137/8465 | 1.61e-03 | 5.60e-03 | 3.30e-03 | 33 |
| hsa0491033 | Oral cavity | EOLP | Insulin signaling pathway | 33/1218 | 137/8465 | 1.61e-03 | 5.60e-03 | 3.30e-03 | 33 |
| hsa0491022 | Prostate | Tumor | Insulin signaling pathway | 44/1791 | 137/8465 | 1.69e-03 | 7.10e-03 | 4.40e-03 | 44 |
| hsa0491032 | Prostate | Tumor | Insulin signaling pathway | 44/1791 | 137/8465 | 1.69e-03 | 7.10e-03 | 4.40e-03 | 44 |
| Page: 1 |
Top |
Cell-cell communication analysis |
| Identification of potential cell-cell interactions between two cell types and their ligand-receptor pairs for different disease states |
| Ligand | Receptor | LRpair | Pathway | Tissue | Disease Stage |
| Page: 1 |
Top |
Single-cell gene regulatory network inference analysis |
| Find out the significant the regulons (TFs) and the target genes of each regulon across cell types for different disease states |
| TF | Cell Type | Tissue | Disease Stage | Target Gene | RSS | Regulon Activity |
| ∗The dot plots of a searched regulon are shown for all cell subpopulations in each disease state of each tissue based on the regulon specific score inferred using pySCENIC and by calculating the average expression. |
| Page: 1 |
Top |
Somatic mutation of malignant transformation related genes |
| Annotation of somatic variants for genes involved in malignant transformation |
| Hugo Symbol | Variant Class | Variant Classification | dbSNP RS | HGVSc | HGVSp | HGVSp Short | SWISSPROT | BIOTYPE | SIFT | PolyPhen | Tumor Sample Barcode | Tissue | Histology | Sex | Age | Stage | Therapy Types | Drugs | Outcome |
| PRKAR2A | SNV | Missense_Mutation | c.1019N>T | p.Ala340Val | p.A340V | P13861 | protein_coding | deleterious(0) | probably_damaging(1) | TCGA-AO-A128-01 | Breast | breast invasive carcinoma | Female | <65 | I/II | Chemotherapy | doxorubicin | SD | |
| PRKAR2A | SNV | Missense_Mutation | rs748812211 | c.355N>G | p.Ile119Val | p.I119V | P13861 | protein_coding | tolerated(1) | benign(0) | TCGA-AQ-A04H-01 | Breast | breast invasive carcinoma | Female | <65 | III/IV | Chemotherapy | taxotere | SD |
| PRKAR2A | SNV | Missense_Mutation | c.886G>C | p.Asp296His | p.D296H | P13861 | protein_coding | deleterious(0) | possibly_damaging(0.709) | TCGA-BH-A2L8-01 | Breast | breast invasive carcinoma | Female | <65 | I/II | Chemotherapy | cytoxan | CR | |
| PRKAR2A | SNV | Missense_Mutation | rs768785168 | c.124N>A | p.Glu42Lys | p.E42K | P13861 | protein_coding | tolerated(0.11) | benign(0.228) | TCGA-EA-A43B-01 | Cervix | cervical & endocervical cancer | Female | <65 | I/II | Chemotherapy | cisplatin | CR |
| PRKAR2A | SNV | Missense_Mutation | c.580N>G | p.Thr194Ala | p.T194A | P13861 | protein_coding | tolerated(0.65) | benign(0) | TCGA-A6-6780-01 | Colorectum | colon adenocarcinoma | Male | >=65 | I/II | Unknown | Unknown | SD | |
| PRKAR2A | SNV | Missense_Mutation | rs748448191 | c.112A>C | p.Thr38Pro | p.T38P | P13861 | protein_coding | deleterious(0.01) | probably_damaging(0.974) | TCGA-D5-6926-01 | Colorectum | colon adenocarcinoma | Male | >=65 | III/IV | Chemotherapy | 5-fluorouracil | SD |
| PRKAR2A | SNV | Missense_Mutation | c.214N>A | p.Ala72Thr | p.A72T | P13861 | protein_coding | tolerated(0.53) | benign(0.001) | TCGA-G4-6309-01 | Colorectum | colon adenocarcinoma | Female | <65 | III/IV | Chemotherapy | xeloda | PD | |
| PRKAR2A | SNV | Missense_Mutation | rs201062271 | c.541N>T | p.Arg181Trp | p.R181W | P13861 | protein_coding | deleterious(0.02) | benign(0.119) | TCGA-CI-6624-01 | Colorectum | rectum adenocarcinoma | Female | <65 | I/II | Unknown | Unknown | SD |
| PRKAR2A | SNV | Missense_Mutation | rs776689351 | c.809N>A | p.Arg270Gln | p.R270Q | P13861 | protein_coding | deleterious(0) | probably_damaging(0.979) | TCGA-F5-6814-01 | Colorectum | rectum adenocarcinoma | Male | <65 | I/II | Unknown | Unknown | SD |
| PRKAR2A | SNV | Missense_Mutation | rs779197243 | c.860N>A | p.Arg287His | p.R287H | P13861 | protein_coding | tolerated(0.55) | benign(0.115) | TCGA-A5-A0G2-01 | Endometrium | uterine corpus endometrioid carcinoma | Female | <65 | III/IV | Unknown | Unknown | SD |
| Page: 1 2 3 |
Top |
Related drugs of malignant transformation related genes |
| Identification of chemicals and drugs interact with genes involved in malignant transfromation |
| (DGIdb 4.0) |
| Entrez ID | Symbol | Category | Interaction Types | Drug Claim Name | Drug Name | PMIDs |
| Page: 1 |

Copyright 2023-Present -The University of Texas Health Science Center at Houston |