
|
|||||
|
 | |
| |
| |
| |
| |
| |
|
Gene: PLOD2 |
Gene summary for PLOD2 |
| Gene information | Species | Human | Gene symbol | PLOD2 | Gene ID | 5352 |
| Gene name | procollagen-lysine,2-oxoglutarate 5-dioxygenase 2 | |
| Gene Alias | BRKS2 | |
| Cytomap | 3q24 | |
| Gene Type | protein-coding | GO ID | GO:0001666 | UniProtAcc | O00469 |
Top |
Malignant transformation analysis |
| Identification of the aberrant gene expression in precancerous and cancerous lesions by comparing the gene expression of stem-like cells in diseased tissues with normal stem cells |
| Entrez ID | Symbol | Replicates | Species | Organ | Tissue | Adj P-value | Log2FC | Malignancy |
| 5352 | PLOD2 | P32T-E | Human | Esophagus | ESCC | 2.66e-46 | 1.07e+00 | 0.1666 |
| 5352 | PLOD2 | P36T-E | Human | Esophagus | ESCC | 4.88e-28 | 1.77e+00 | 0.1187 |
| 5352 | PLOD2 | P37T-E | Human | Esophagus | ESCC | 3.60e-55 | 1.36e+00 | 0.1371 |
| 5352 | PLOD2 | P38T-E | Human | Esophagus | ESCC | 7.98e-12 | 8.78e-01 | 0.127 |
| 5352 | PLOD2 | P39T-E | Human | Esophagus | ESCC | 2.77e-05 | 2.50e-01 | 0.0894 |
| 5352 | PLOD2 | P40T-E | Human | Esophagus | ESCC | 4.53e-07 | 3.27e-01 | 0.109 |
| 5352 | PLOD2 | P42T-E | Human | Esophagus | ESCC | 8.15e-15 | 4.34e-01 | 0.1175 |
| 5352 | PLOD2 | P44T-E | Human | Esophagus | ESCC | 2.64e-17 | 6.96e-01 | 0.1096 |
| 5352 | PLOD2 | P47T-E | Human | Esophagus | ESCC | 1.87e-08 | 4.07e-01 | 0.1067 |
| 5352 | PLOD2 | P48T-E | Human | Esophagus | ESCC | 7.57e-18 | 4.37e-01 | 0.0959 |
| 5352 | PLOD2 | P49T-E | Human | Esophagus | ESCC | 9.32e-04 | 7.17e-01 | 0.1768 |
| 5352 | PLOD2 | P52T-E | Human | Esophagus | ESCC | 3.96e-44 | 1.36e+00 | 0.1555 |
| 5352 | PLOD2 | P54T-E | Human | Esophagus | ESCC | 6.33e-45 | 1.27e+00 | 0.0975 |
| 5352 | PLOD2 | P57T-E | Human | Esophagus | ESCC | 1.82e-18 | 4.68e-01 | 0.0926 |
| 5352 | PLOD2 | P61T-E | Human | Esophagus | ESCC | 1.13e-25 | 7.33e-01 | 0.099 |
| 5352 | PLOD2 | P62T-E | Human | Esophagus | ESCC | 9.80e-85 | 1.68e+00 | 0.1302 |
| 5352 | PLOD2 | P74T-E | Human | Esophagus | ESCC | 2.90e-52 | 1.70e+00 | 0.1479 |
| 5352 | PLOD2 | P75T-E | Human | Esophagus | ESCC | 1.39e-32 | 8.16e-01 | 0.1125 |
| 5352 | PLOD2 | P76T-E | Human | Esophagus | ESCC | 6.45e-33 | 9.73e-01 | 0.1207 |
| 5352 | PLOD2 | P79T-E | Human | Esophagus | ESCC | 4.82e-48 | 1.10e+00 | 0.1154 |
| Page: 1 2 3 4 5 6 7 8 9 10 11 |
| Tissue | Expression Dynamics | Abbreviation |
| Breast | 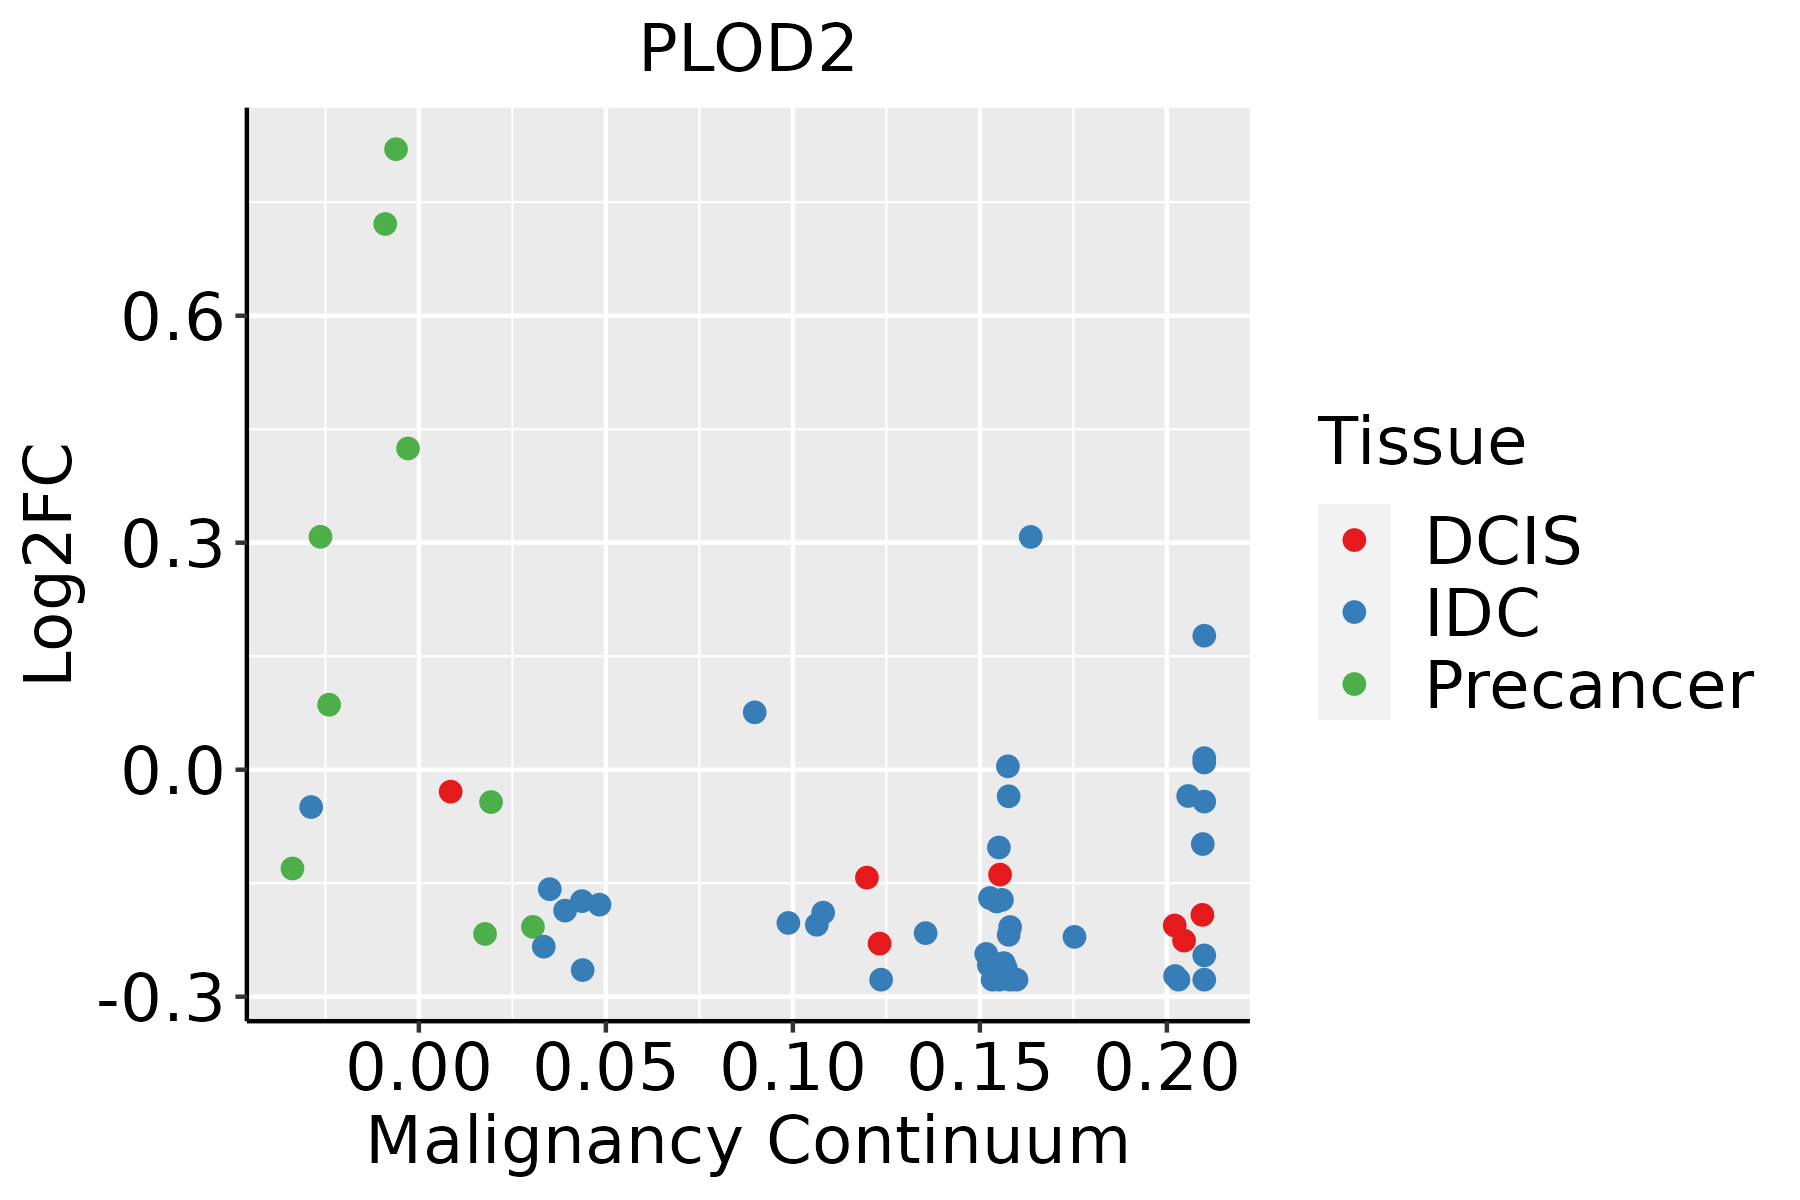 | IDC: Invasive ductal carcinoma |
| DCIS: Ductal carcinoma in situ | ||
| Precancer(BRCA1-mut): Precancerous lesion from BRCA1 mutation carriers | ||
| Cervix | 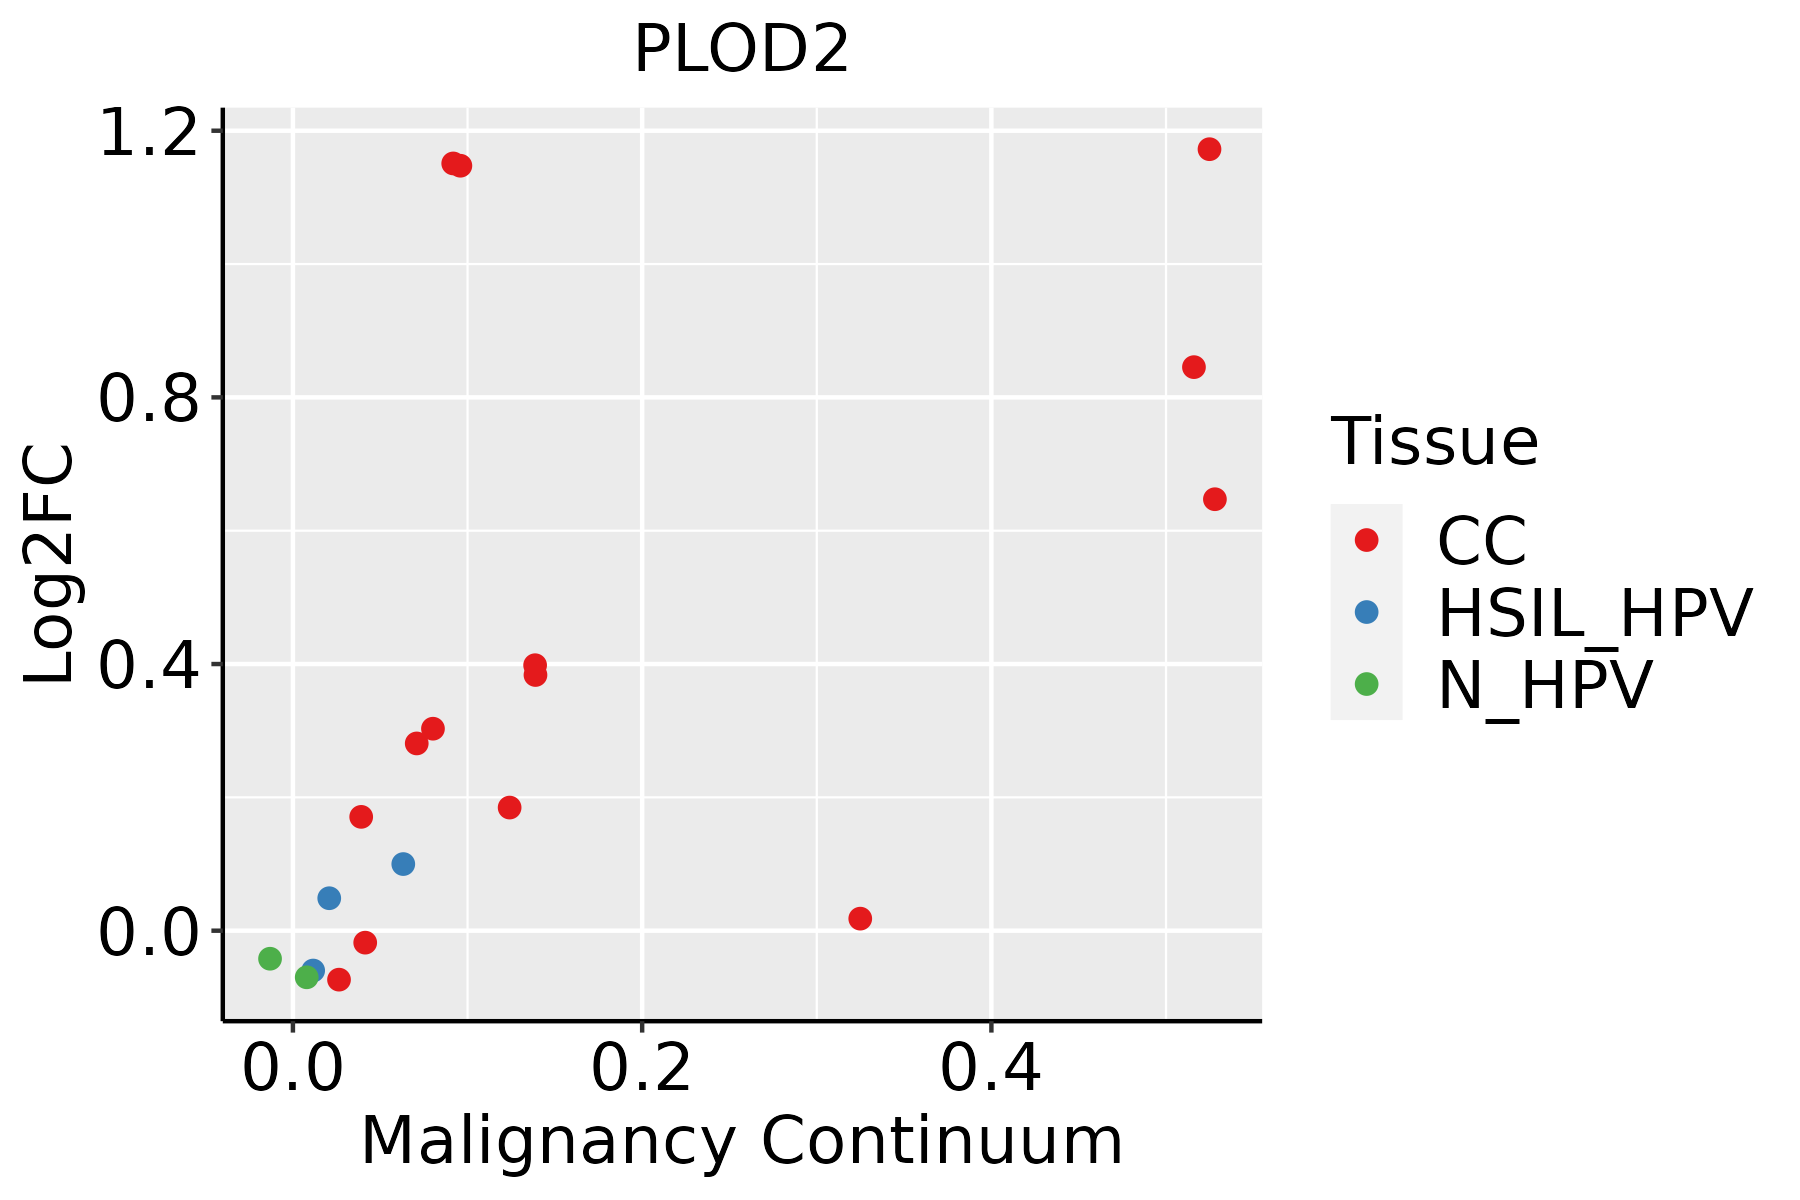 | CC: Cervix cancer |
| HSIL_HPV: HPV-infected high-grade squamous intraepithelial lesions | ||
| N_HPV: HPV-infected normal cervix | ||
| Colorectum (GSE201348) |  | FAP: Familial adenomatous polyposis |
| CRC: Colorectal cancer | ||
| Colorectum (HTA11) |  | AD: Adenomas |
| SER: Sessile serrated lesions | ||
| MSI-H: Microsatellite-high colorectal cancer | ||
| MSS: Microsatellite stable colorectal cancer | ||
| Endometrium | 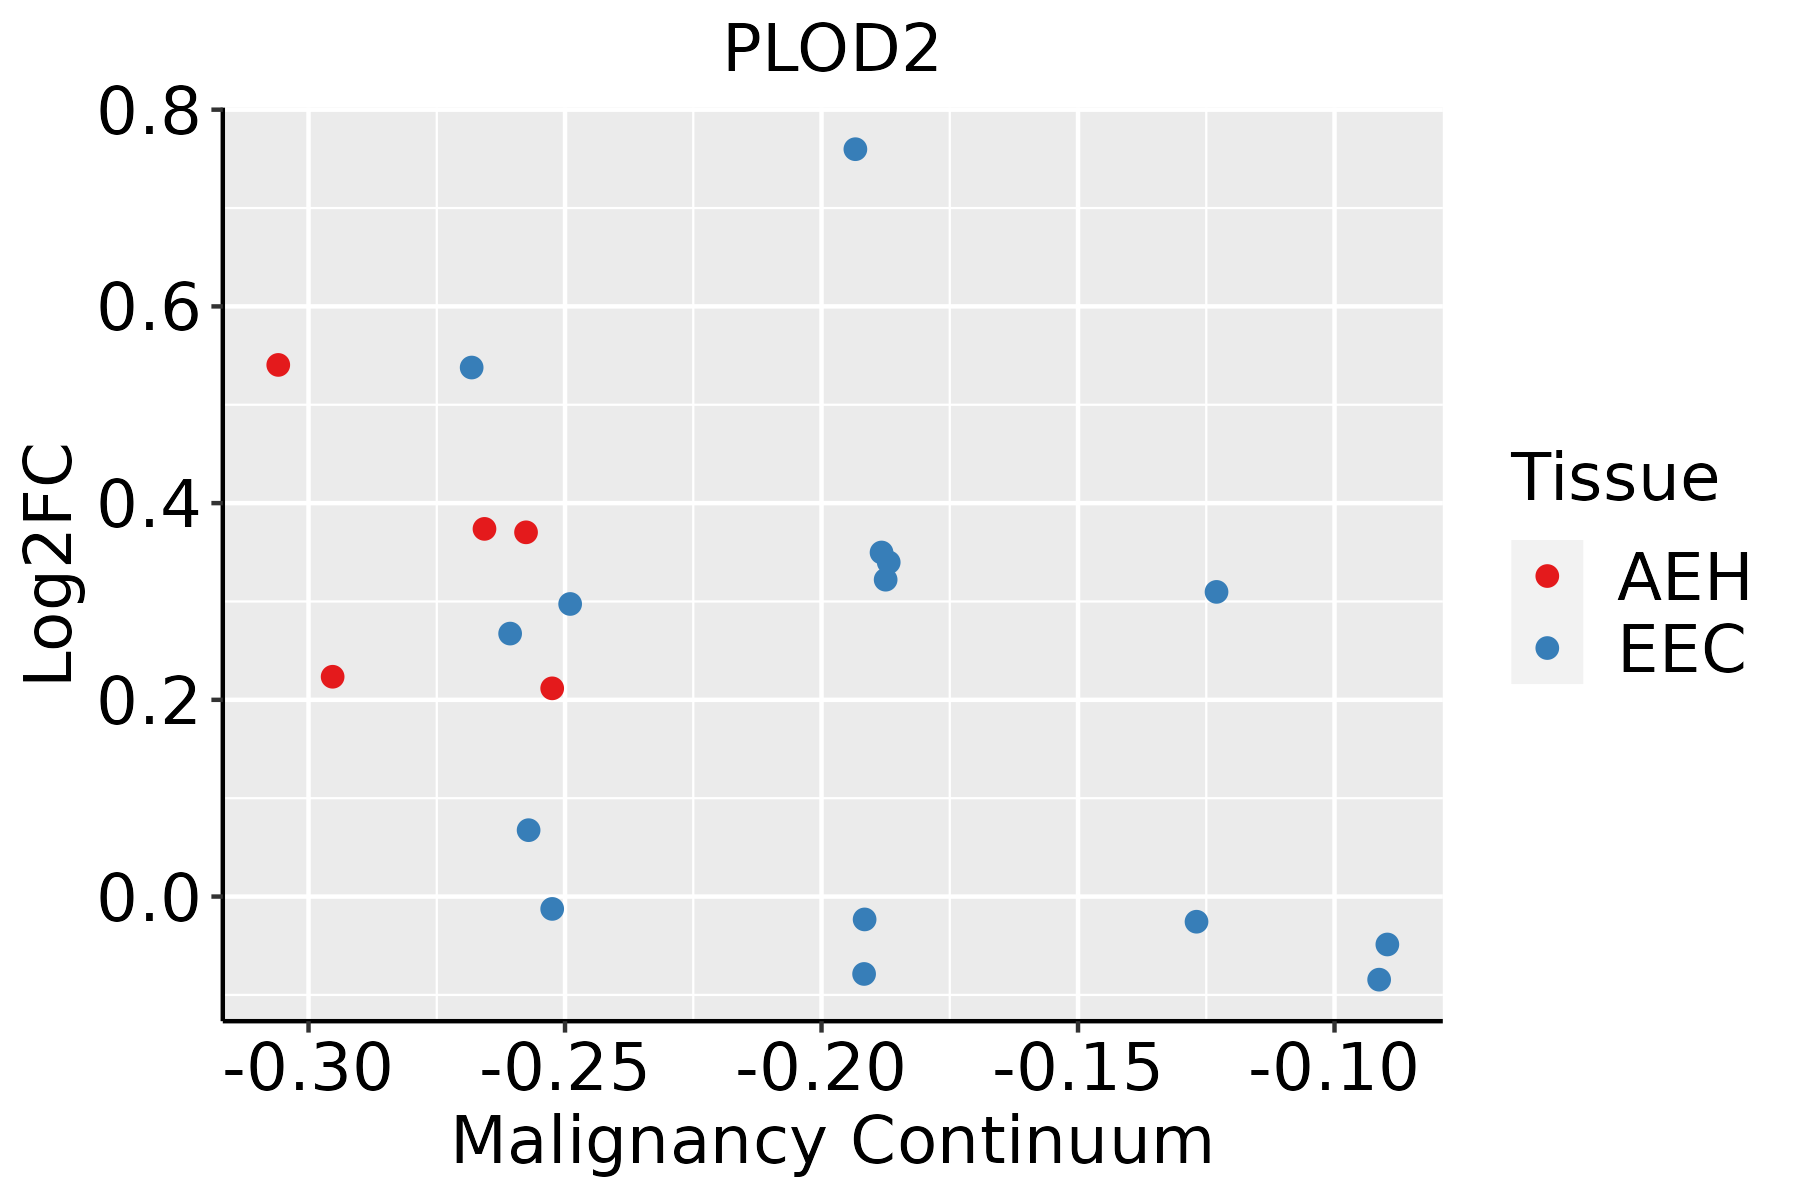 | AEH: Atypical endometrial hyperplasia |
| EEC: Endometrioid Cancer | ||
| Esophagus |  | ESCC: Esophageal squamous cell carcinoma |
| HGIN: High-grade intraepithelial neoplasias | ||
| LGIN: Low-grade intraepithelial neoplasias | ||
| Liver |  | HCC: Hepatocellular carcinoma |
| NAFLD: Non-alcoholic fatty liver disease | ||
| Lung | 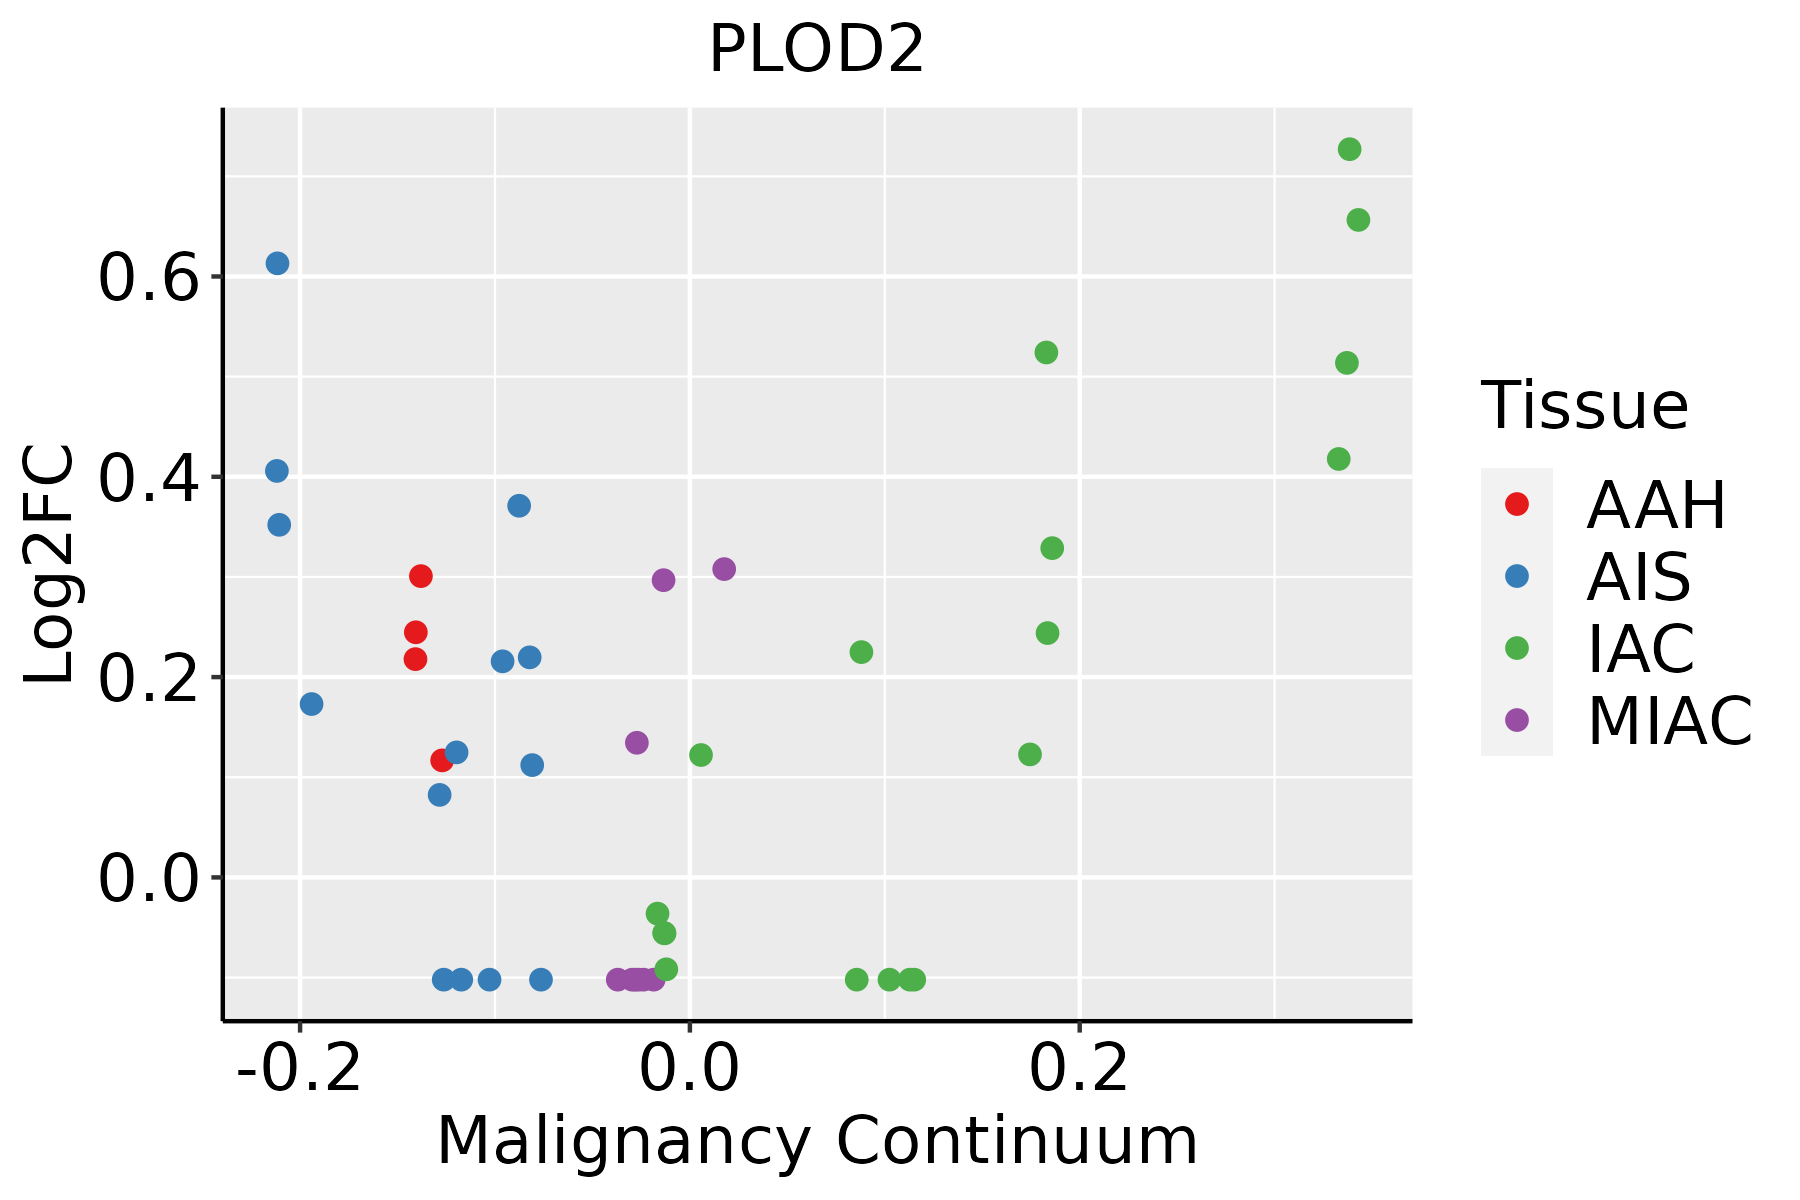 | AAH: Atypical adenomatous hyperplasia |
| AIS: Adenocarcinoma in situ | ||
| IAC: Invasive lung adenocarcinoma | ||
| MIA: Minimally invasive adenocarcinoma | ||
| Oral Cavity | 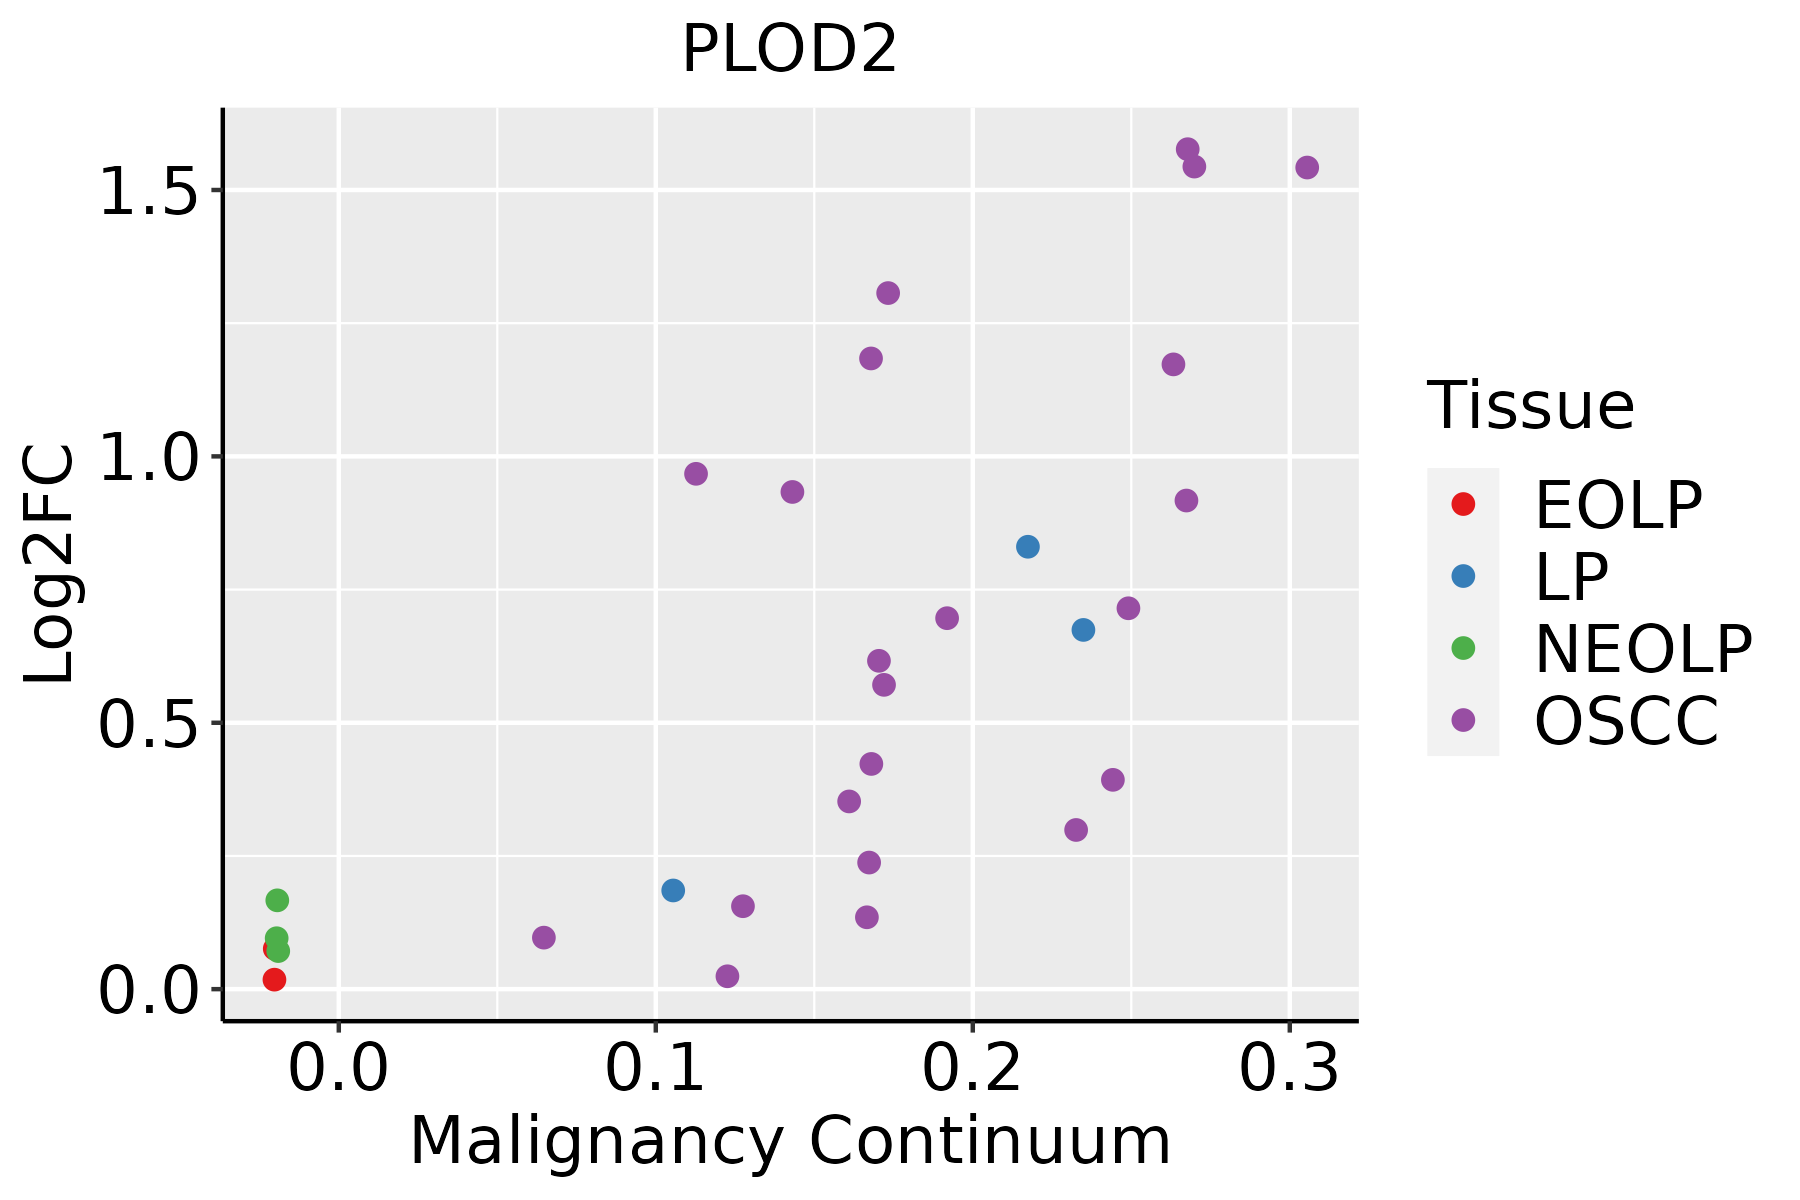 | EOLP: Erosive Oral lichen planus |
| LP: leukoplakia | ||
| NEOLP: Non-erosive oral lichen planus | ||
| OSCC: Oral squamous cell carcinoma | ||
| Skin | 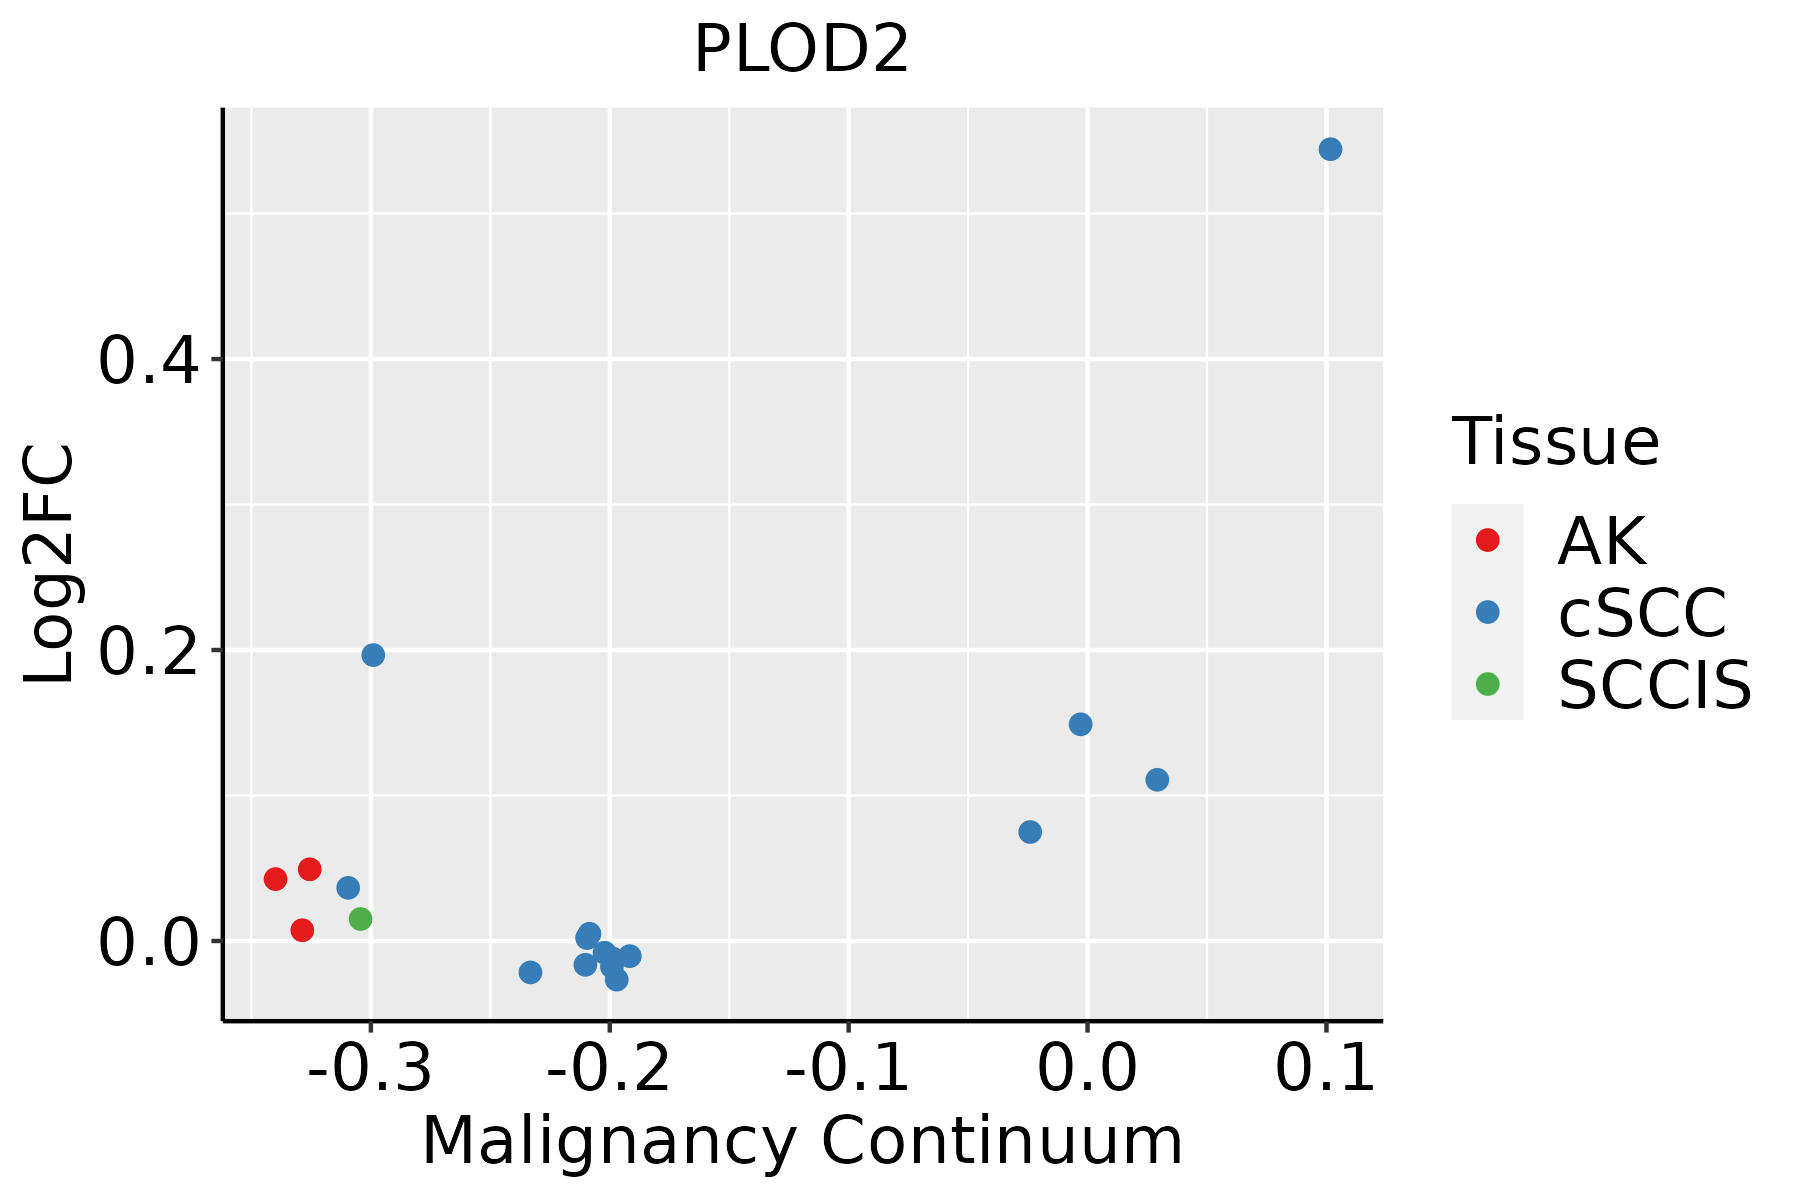 | AK: Actinic keratosis |
| cSCC: Cutaneous squamous cell carcinoma | ||
| SCCIS:squamous cell carcinoma in situ | ||
| Thyroid |  | ATC: Anaplastic thyroid cancer |
| HT: Hashimoto's thyroiditis | ||
| PTC: Papillary thyroid cancer |
| ∗log2FC in expression of this searched gene in stem-like cells from each diseased tissue sample relative to stem-like cells in normal samples in each tissue plotted against the malignancy continuum. Samples are colored based on if they are from different disease stage. |
Top |
Malignant transformation related pathway analysis |
| Find out the enriched GO biological processes and KEGG pathways involved in transition from healthy to precancer to cancer |
| Tissue | Disease Stage | Enriched GO biological Processes |
| Colorectum | AD |  |
| Colorectum | SER |  |
| Colorectum | MSS |  |
| Colorectum | MSI-H |  |
| Colorectum | FAP |  |
| ∗Top 15 enriched GO BP terms are showed in the bar plot of each disease state in each tissue. Each row represents a significant GO biological process which is colored according to the -log10(p.adjust). |
| Page: 1 2 3 4 5 6 7 8 9 |
| GO ID | Tissue | Disease Stage | Description | Gene Ratio | Bg Ratio | pvalue | p.adjust | Count |
| GO:00362939 | Breast | Precancer | response to decreased oxygen levels | 53/1080 | 322/18723 | 4.09e-12 | 6.84e-10 | 53 |
| GO:00016669 | Breast | Precancer | response to hypoxia | 51/1080 | 307/18723 | 7.33e-12 | 1.11e-09 | 51 |
| GO:00704829 | Breast | Precancer | response to oxygen levels | 55/1080 | 347/18723 | 7.47e-12 | 1.11e-09 | 55 |
| GO:00463946 | Breast | Precancer | carboxylic acid biosynthetic process | 32/1080 | 314/18723 | 1.30e-03 | 1.38e-02 | 32 |
| GO:00160536 | Breast | Precancer | organic acid biosynthetic process | 32/1080 | 316/18723 | 1.44e-03 | 1.50e-02 | 32 |
| GO:00181261 | Breast | Precancer | protein hydroxylation | 6/1080 | 27/18723 | 3.78e-03 | 3.04e-02 | 6 |
| GO:007048214 | Breast | IDC | response to oxygen levels | 64/1434 | 347/18723 | 3.45e-11 | 5.57e-09 | 64 |
| GO:003629314 | Breast | IDC | response to decreased oxygen levels | 60/1434 | 322/18723 | 9.26e-11 | 1.25e-08 | 60 |
| GO:000166614 | Breast | IDC | response to hypoxia | 58/1434 | 307/18723 | 1.09e-10 | 1.38e-08 | 58 |
| GO:001605313 | Breast | IDC | organic acid biosynthetic process | 39/1434 | 316/18723 | 2.13e-03 | 1.99e-02 | 39 |
| GO:004639413 | Breast | IDC | carboxylic acid biosynthetic process | 38/1434 | 314/18723 | 3.39e-03 | 2.83e-02 | 38 |
| GO:003629323 | Breast | DCIS | response to decreased oxygen levels | 60/1390 | 322/18723 | 2.64e-11 | 4.56e-09 | 60 |
| GO:007048223 | Breast | DCIS | response to oxygen levels | 63/1390 | 347/18723 | 2.66e-11 | 4.56e-09 | 63 |
| GO:000166623 | Breast | DCIS | response to hypoxia | 58/1390 | 307/18723 | 3.19e-11 | 5.16e-09 | 58 |
| GO:001605322 | Breast | DCIS | organic acid biosynthetic process | 38/1390 | 316/18723 | 2.22e-03 | 2.04e-02 | 38 |
| GO:004639422 | Breast | DCIS | carboxylic acid biosynthetic process | 37/1390 | 314/18723 | 3.56e-03 | 2.92e-02 | 37 |
| GO:000166610 | Cervix | CC | response to hypoxia | 61/2311 | 307/18723 | 1.04e-04 | 1.34e-03 | 61 |
| GO:007048210 | Cervix | CC | response to oxygen levels | 67/2311 | 347/18723 | 1.21e-04 | 1.51e-03 | 67 |
| GO:003629310 | Cervix | CC | response to decreased oxygen levels | 62/2311 | 322/18723 | 2.29e-04 | 2.57e-03 | 62 |
| GO:00182054 | Cervix | CC | peptidyl-lysine modification | 62/2311 | 376/18723 | 1.04e-02 | 4.97e-02 | 62 |
| Page: 1 2 3 4 5 6 7 8 9 |
| Pathway ID | Tissue | Disease Stage | Description | Gene Ratio | Bg Ratio | pvalue | p.adjust | qvalue | Count |
| hsa00310 | Colorectum | AD | Lysine degradation | 27/2092 | 63/8465 | 1.17e-03 | 7.75e-03 | 4.94e-03 | 27 |
| hsa003101 | Colorectum | AD | Lysine degradation | 27/2092 | 63/8465 | 1.17e-03 | 7.75e-03 | 4.94e-03 | 27 |
| hsa003102 | Colorectum | MSS | Lysine degradation | 24/1875 | 63/8465 | 2.94e-03 | 1.39e-02 | 8.50e-03 | 24 |
| hsa003103 | Colorectum | MSS | Lysine degradation | 24/1875 | 63/8465 | 2.94e-03 | 1.39e-02 | 8.50e-03 | 24 |
| hsa003104 | Colorectum | FAP | Lysine degradation | 23/1404 | 63/8465 | 1.04e-04 | 9.46e-04 | 5.76e-04 | 23 |
| hsa003105 | Colorectum | FAP | Lysine degradation | 23/1404 | 63/8465 | 1.04e-04 | 9.46e-04 | 5.76e-04 | 23 |
| hsa003106 | Colorectum | CRC | Lysine degradation | 18/1091 | 63/8465 | 7.21e-04 | 6.34e-03 | 4.30e-03 | 18 |
| hsa003107 | Colorectum | CRC | Lysine degradation | 18/1091 | 63/8465 | 7.21e-04 | 6.34e-03 | 4.30e-03 | 18 |
| hsa0031010 | Esophagus | ESCC | Lysine degradation | 41/4205 | 63/8465 | 9.63e-03 | 2.27e-02 | 1.16e-02 | 41 |
| hsa0031013 | Esophagus | ESCC | Lysine degradation | 41/4205 | 63/8465 | 9.63e-03 | 2.27e-02 | 1.16e-02 | 41 |
| hsa003108 | Liver | NAFLD | Lysine degradation | 21/1043 | 63/8465 | 1.09e-05 | 3.58e-04 | 2.89e-04 | 21 |
| hsa0031011 | Liver | NAFLD | Lysine degradation | 21/1043 | 63/8465 | 1.09e-05 | 3.58e-04 | 2.89e-04 | 21 |
| hsa0031021 | Liver | Cirrhotic | Lysine degradation | 29/2530 | 63/8465 | 4.81e-03 | 1.74e-02 | 1.07e-02 | 29 |
| hsa0031031 | Liver | Cirrhotic | Lysine degradation | 29/2530 | 63/8465 | 4.81e-03 | 1.74e-02 | 1.07e-02 | 29 |
| hsa0031041 | Liver | HCC | Lysine degradation | 47/4020 | 63/8465 | 1.02e-05 | 7.58e-05 | 4.22e-05 | 47 |
| hsa0031051 | Liver | HCC | Lysine degradation | 47/4020 | 63/8465 | 1.02e-05 | 7.58e-05 | 4.22e-05 | 47 |
| hsa003109 | Lung | IAC | Lysine degradation | 17/1053 | 63/8465 | 1.35e-03 | 8.63e-03 | 5.73e-03 | 17 |
| hsa0031012 | Lung | IAC | Lysine degradation | 17/1053 | 63/8465 | 1.35e-03 | 8.63e-03 | 5.73e-03 | 17 |
| hsa0031022 | Lung | AIS | Lysine degradation | 16/961 | 63/8465 | 1.41e-03 | 9.49e-03 | 6.07e-03 | 16 |
| hsa0031032 | Lung | AIS | Lysine degradation | 16/961 | 63/8465 | 1.41e-03 | 9.49e-03 | 6.07e-03 | 16 |
| Page: 1 |
Top |
Cell-cell communication analysis |
| Identification of potential cell-cell interactions between two cell types and their ligand-receptor pairs for different disease states |
| Ligand | Receptor | LRpair | Pathway | Tissue | Disease Stage |
| Page: 1 |
Top |
Single-cell gene regulatory network inference analysis |
| Find out the significant the regulons (TFs) and the target genes of each regulon across cell types for different disease states |
| TF | Cell Type | Tissue | Disease Stage | Target Gene | RSS | Regulon Activity |
| ∗The dot plots of a searched regulon are shown for all cell subpopulations in each disease state of each tissue based on the regulon specific score inferred using pySCENIC and by calculating the average expression. |
| Page: 1 |
Top |
Somatic mutation of malignant transformation related genes |
| Annotation of somatic variants for genes involved in malignant transformation |
| Hugo Symbol | Variant Class | Variant Classification | dbSNP RS | HGVSc | HGVSp | HGVSp Short | SWISSPROT | BIOTYPE | SIFT | PolyPhen | Tumor Sample Barcode | Tissue | Histology | Sex | Age | Stage | Therapy Types | Drugs | Outcome |
| PLOD2 | SNV | Missense_Mutation | novel | c.2140N>G | p.Leu714Val | p.L714V | O00469 | protein_coding | tolerated(0.07) | benign(0.349) | TCGA-AO-A0J9-01 | Breast | breast invasive carcinoma | Female | <65 | III/IV | Chemotherapy | cyclophosphamide | PD |
| PLOD2 | SNV | Missense_Mutation | rs376497013 | c.1703N>A | p.Arg568His | p.R568H | O00469 | protein_coding | deleterious(0.05) | benign(0.003) | TCGA-BH-A203-01 | Breast | breast invasive carcinoma | Female | >=65 | I/II | Unknown | Unknown | PD |
| PLOD2 | SNV | Missense_Mutation | rs774991815 | c.484C>T | p.Arg162Cys | p.R162C | O00469 | protein_coding | deleterious(0) | probably_damaging(0.95) | TCGA-2W-A8YY-01 | Cervix | cervical & endocervical cancer | Female | <65 | I/II | Chemotherapy | cisplatin | CR |
| PLOD2 | SNV | Missense_Mutation | c.1340N>C | p.Ile447Thr | p.I447T | O00469 | protein_coding | deleterious(0.02) | possibly_damaging(0.517) | TCGA-AA-3492-01 | Colorectum | colon adenocarcinoma | Female | >=65 | I/II | Unknown | Unknown | SD | |
| PLOD2 | SNV | Missense_Mutation | novel | c.119N>C | p.Leu40Ser | p.L40S | O00469 | protein_coding | deleterious(0) | probably_damaging(0.995) | TCGA-AA-3947-01 | Colorectum | colon adenocarcinoma | Female | <65 | I/II | Unknown | Unknown | SD |
| PLOD2 | SNV | Missense_Mutation | c.862N>A | p.Asp288Asn | p.D288N | O00469 | protein_coding | tolerated(0.21) | benign(0.036) | TCGA-AA-3984-01 | Colorectum | colon adenocarcinoma | Female | <65 | I/II | Unknown | Unknown | SD | |
| PLOD2 | SNV | Missense_Mutation | rs758538664 | c.1484N>A | p.Arg495Gln | p.R495Q | O00469 | protein_coding | tolerated(0.34) | benign(0.392) | TCGA-AA-A00N-01 | Colorectum | colon adenocarcinoma | Male | >=65 | I/II | Unknown | Unknown | PD |
| PLOD2 | SNV | Missense_Mutation | rs141419117 | c.853N>A | p.Asp285Asn | p.D285N | O00469 | protein_coding | tolerated(0.32) | benign(0.03) | TCGA-CA-6717-01 | Colorectum | colon adenocarcinoma | Male | <65 | I/II | Chemotherapy | oxaliplatin | CR |
| PLOD2 | SNV | Missense_Mutation | novel | c.723N>T | p.Lys241Asn | p.K241N | O00469 | protein_coding | deleterious(0.01) | benign(0.253) | TCGA-CA-6717-01 | Colorectum | colon adenocarcinoma | Male | <65 | I/II | Chemotherapy | oxaliplatin | CR |
| PLOD2 | SNV | Missense_Mutation | c.2257G>A | p.Val753Met | p.V753M | O00469 | protein_coding | deleterious(0) | probably_damaging(0.995) | TCGA-G4-6302-01 | Colorectum | colon adenocarcinoma | Female | >=65 | I/II | Unknown | Unknown | SD |
| Page: 1 2 3 4 5 6 7 8 9 10 |
Top |
Related drugs of malignant transformation related genes |
| Identification of chemicals and drugs interact with genes involved in malignant transfromation |
| (DGIdb 4.0) |
| Entrez ID | Symbol | Category | Interaction Types | Drug Claim Name | Drug Name | PMIDs |
| Page: 1 |

Copyright 2023-Present -The University of Texas Health Science Center at Houston |