
|
|||||
|
 | |
| |
| |
| |
| |
| |
|
Gene: NOSIP |
Gene summary for NOSIP |
| Gene information | Species | Human | Gene symbol | NOSIP | Gene ID | 51070 |
| Gene name | nitric oxide synthase interacting protein | |
| Gene Alias | CGI-25 | |
| Cytomap | 19q13.33 | |
| Gene Type | protein-coding | GO ID | GO:0006464 | UniProtAcc | Q9Y314 |
Top |
Malignant transformation analysis |
| Identification of the aberrant gene expression in precancerous and cancerous lesions by comparing the gene expression of stem-like cells in diseased tissues with normal stem cells |
| Entrez ID | Symbol | Replicates | Species | Organ | Tissue | Adj P-value | Log2FC | Malignancy |
| 51070 | NOSIP | SYSMH1 | Human | Oral cavity | OSCC | 5.14e-07 | 2.56e-01 | 0.1127 |
| 51070 | NOSIP | SYSMH2 | Human | Oral cavity | OSCC | 1.73e-24 | 8.73e-01 | 0.2326 |
| 51070 | NOSIP | SYSMH3 | Human | Oral cavity | OSCC | 1.53e-45 | 1.08e+00 | 0.2442 |
| 51070 | NOSIP | SYSMH5 | Human | Oral cavity | OSCC | 7.52e-15 | 4.61e-01 | 0.0647 |
| 51070 | NOSIP | SYSMH6 | Human | Oral cavity | OSCC | 1.58e-09 | 4.71e-01 | 0.1275 |
| 51070 | NOSIP | P4_S8_cSCC | Human | Skin | cSCC | 5.70e-04 | 1.31e-01 | -0.3095 |
| 51070 | NOSIP | P5_S10_cSCC | Human | Skin | cSCC | 1.43e-11 | 2.84e-01 | -0.299 |
| 51070 | NOSIP | P1_cSCC | Human | Skin | cSCC | 1.79e-23 | 9.45e-01 | 0.0292 |
| 51070 | NOSIP | P2_cSCC | Human | Skin | cSCC | 1.39e-11 | 6.30e-01 | -0.024 |
| 51070 | NOSIP | P4_cSCC | Human | Skin | cSCC | 9.99e-21 | 7.12e-01 | -0.00290000000000005 |
| 51070 | NOSIP | P10_cSCC | Human | Skin | cSCC | 2.98e-25 | 1.13e+00 | 0.1017 |
| 51070 | NOSIP | male-WTA | Human | Thyroid | PTC | 2.96e-11 | 2.50e-02 | 0.1037 |
| 51070 | NOSIP | PTC01 | Human | Thyroid | PTC | 1.65e-19 | 3.69e-01 | 0.1899 |
| 51070 | NOSIP | PTC04 | Human | Thyroid | PTC | 7.67e-11 | 2.05e-01 | 0.1927 |
| 51070 | NOSIP | PTC05 | Human | Thyroid | PTC | 4.94e-16 | 5.97e-01 | 0.2065 |
| 51070 | NOSIP | PTC06 | Human | Thyroid | PTC | 4.63e-28 | 6.35e-01 | 0.2057 |
| 51070 | NOSIP | PTC07 | Human | Thyroid | PTC | 4.76e-40 | 6.40e-01 | 0.2044 |
| 51070 | NOSIP | ATC09 | Human | Thyroid | ATC | 7.43e-16 | 3.92e-01 | 0.2871 |
| 51070 | NOSIP | ATC11 | Human | Thyroid | ATC | 3.81e-06 | 9.55e-01 | 0.3386 |
| 51070 | NOSIP | ATC12 | Human | Thyroid | ATC | 1.16e-12 | 3.55e-01 | 0.34 |
| Page: 1 2 3 4 5 6 7 8 |
| Tissue | Expression Dynamics | Abbreviation |
| Cervix |  | CC: Cervix cancer |
| HSIL_HPV: HPV-infected high-grade squamous intraepithelial lesions | ||
| N_HPV: HPV-infected normal cervix | ||
| Colorectum (GSE201348) |  | FAP: Familial adenomatous polyposis |
| CRC: Colorectal cancer | ||
| Colorectum (HTA11) | 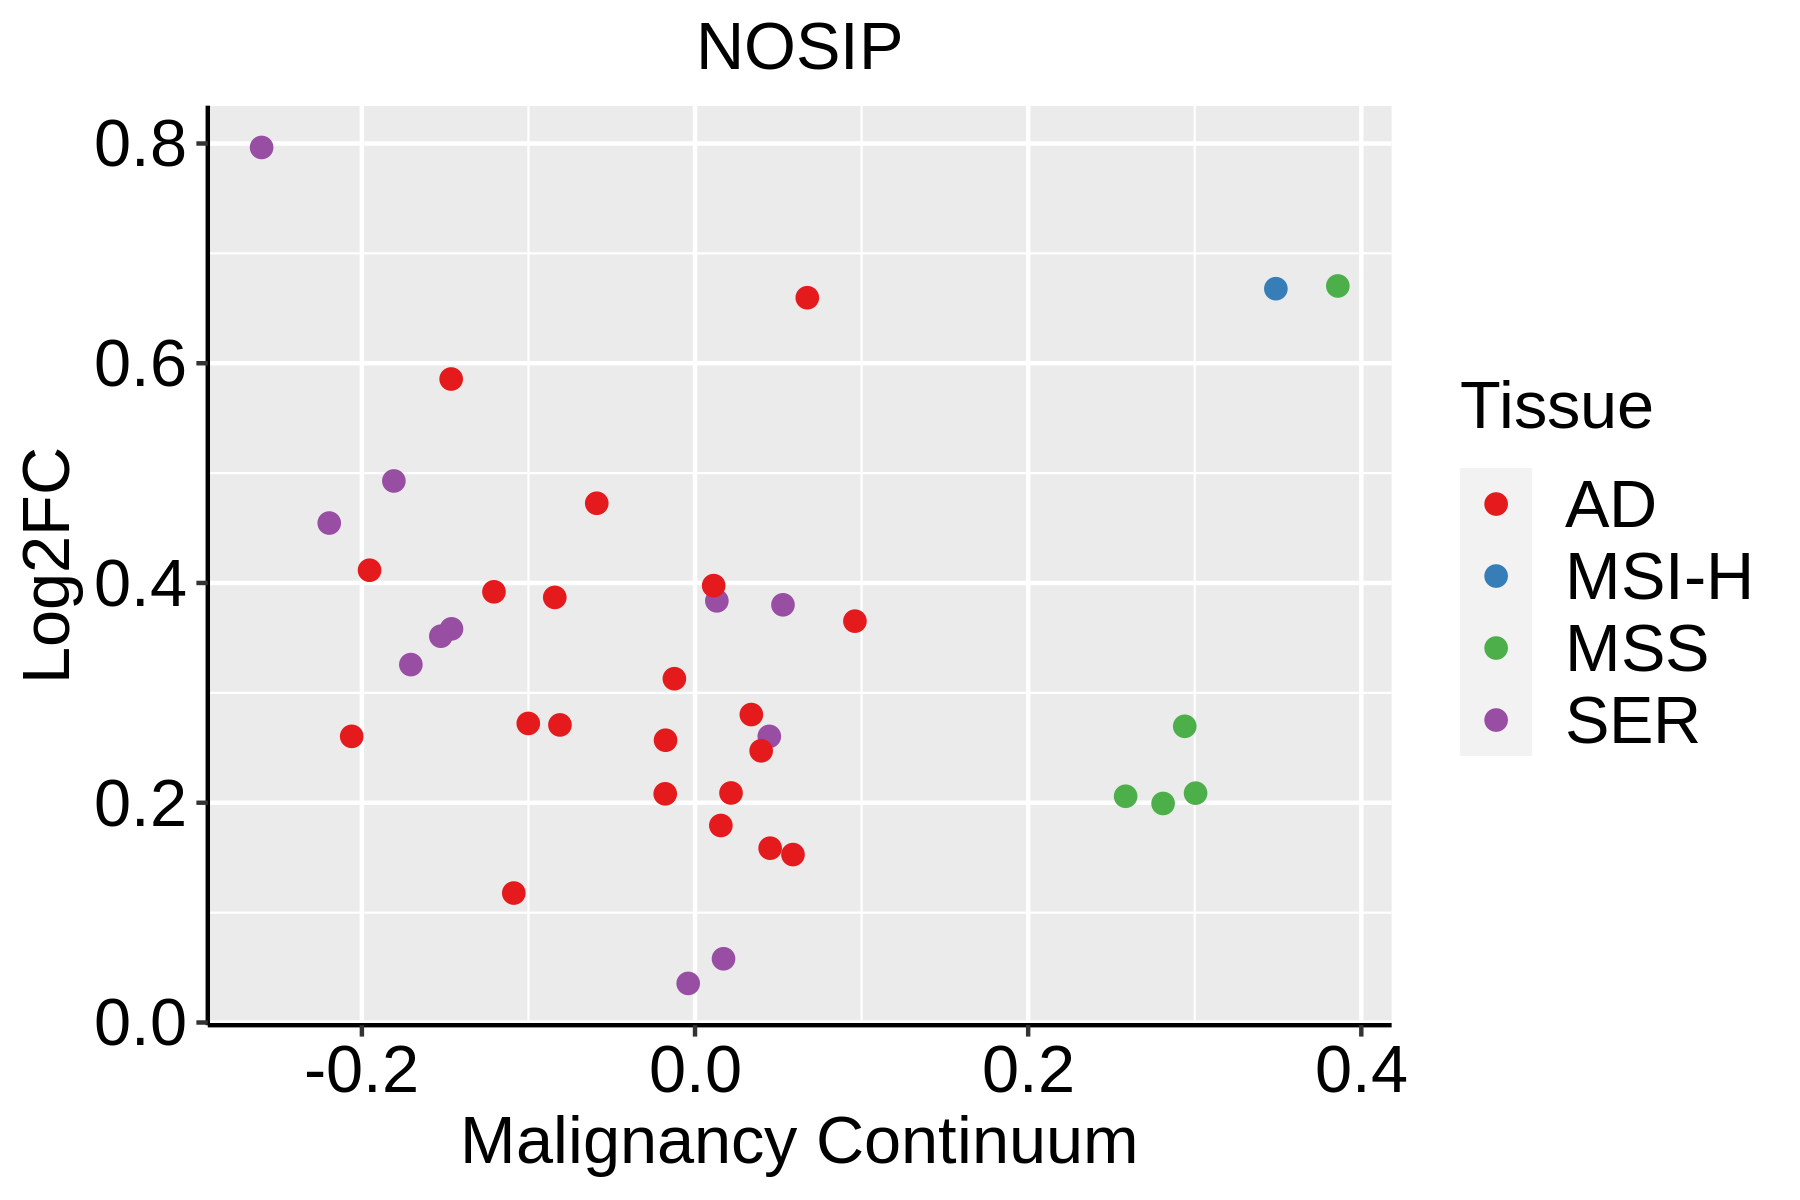 | AD: Adenomas |
| SER: Sessile serrated lesions | ||
| MSI-H: Microsatellite-high colorectal cancer | ||
| MSS: Microsatellite stable colorectal cancer | ||
| Esophagus | 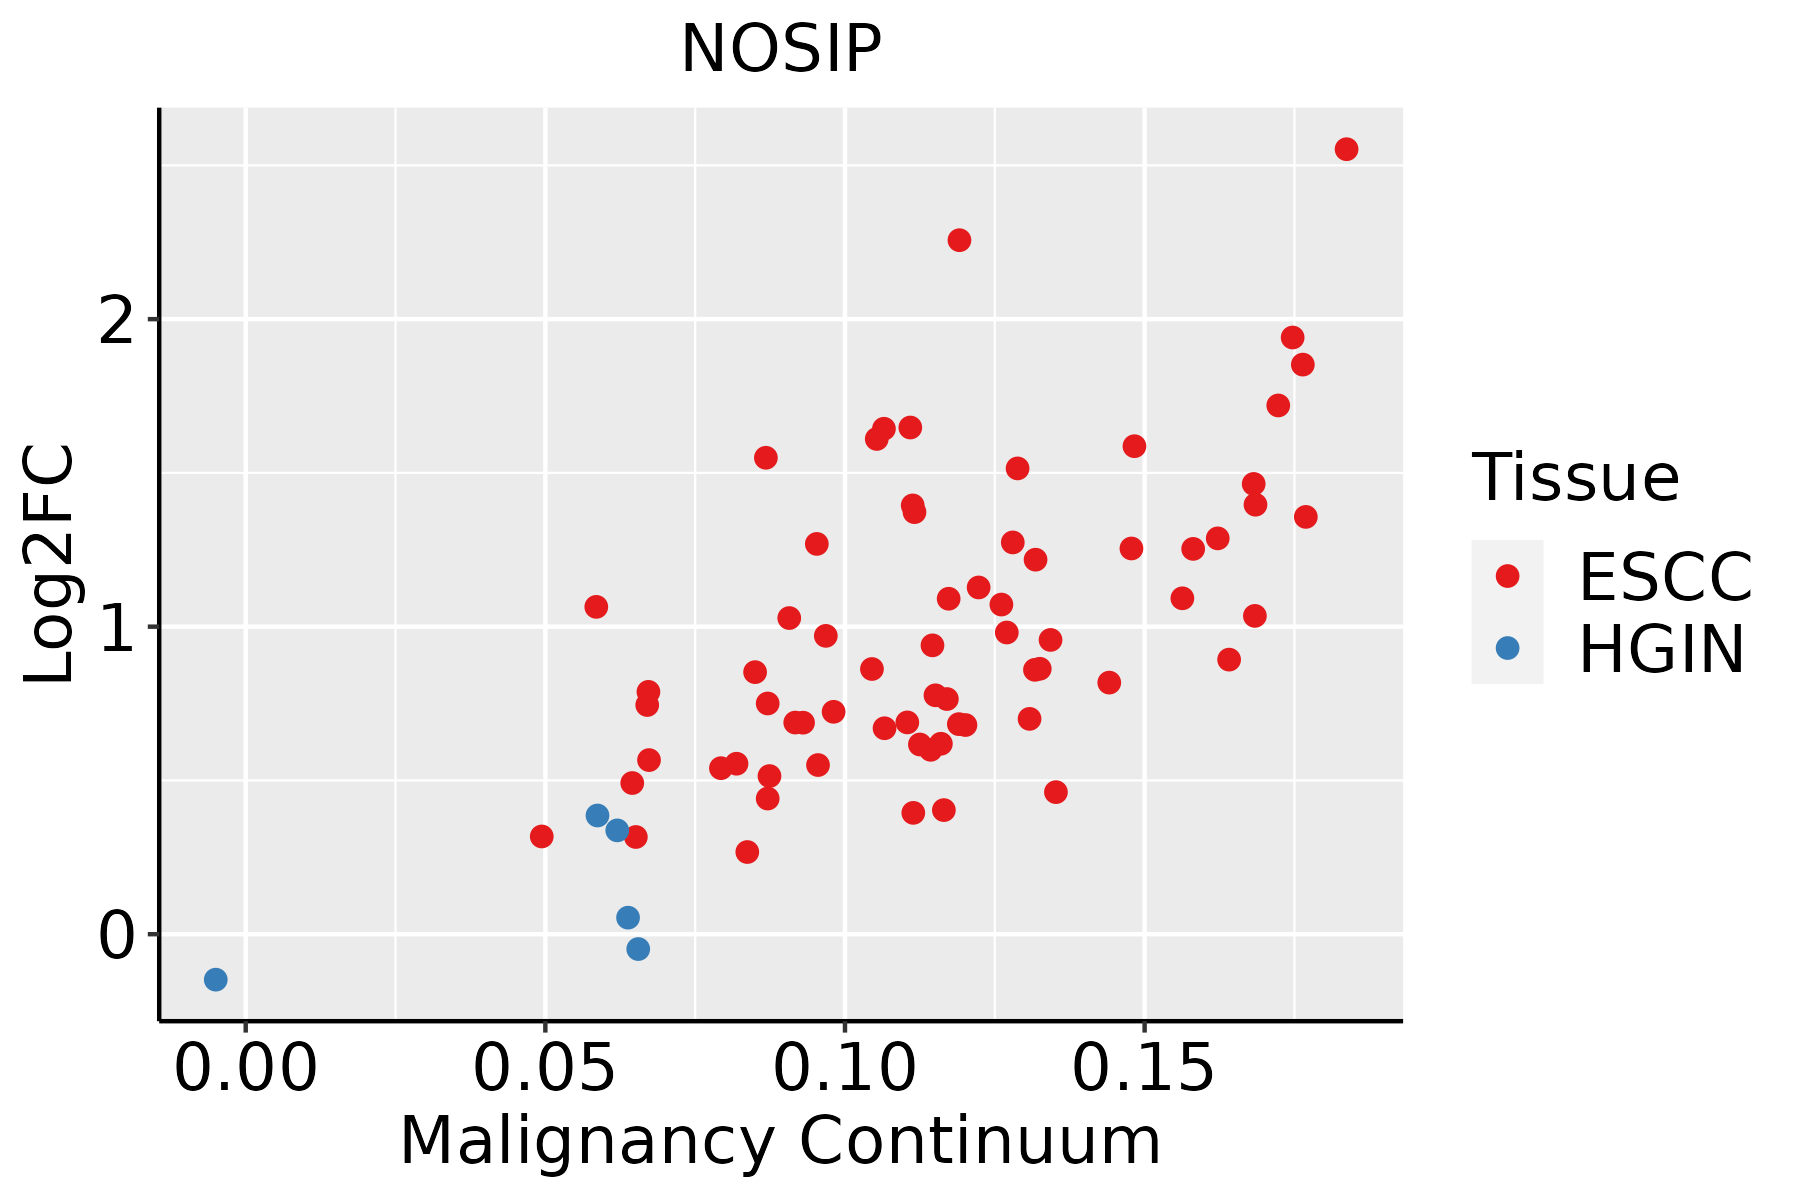 | ESCC: Esophageal squamous cell carcinoma |
| HGIN: High-grade intraepithelial neoplasias | ||
| LGIN: Low-grade intraepithelial neoplasias | ||
| Liver |  | HCC: Hepatocellular carcinoma |
| NAFLD: Non-alcoholic fatty liver disease | ||
| Oral Cavity | 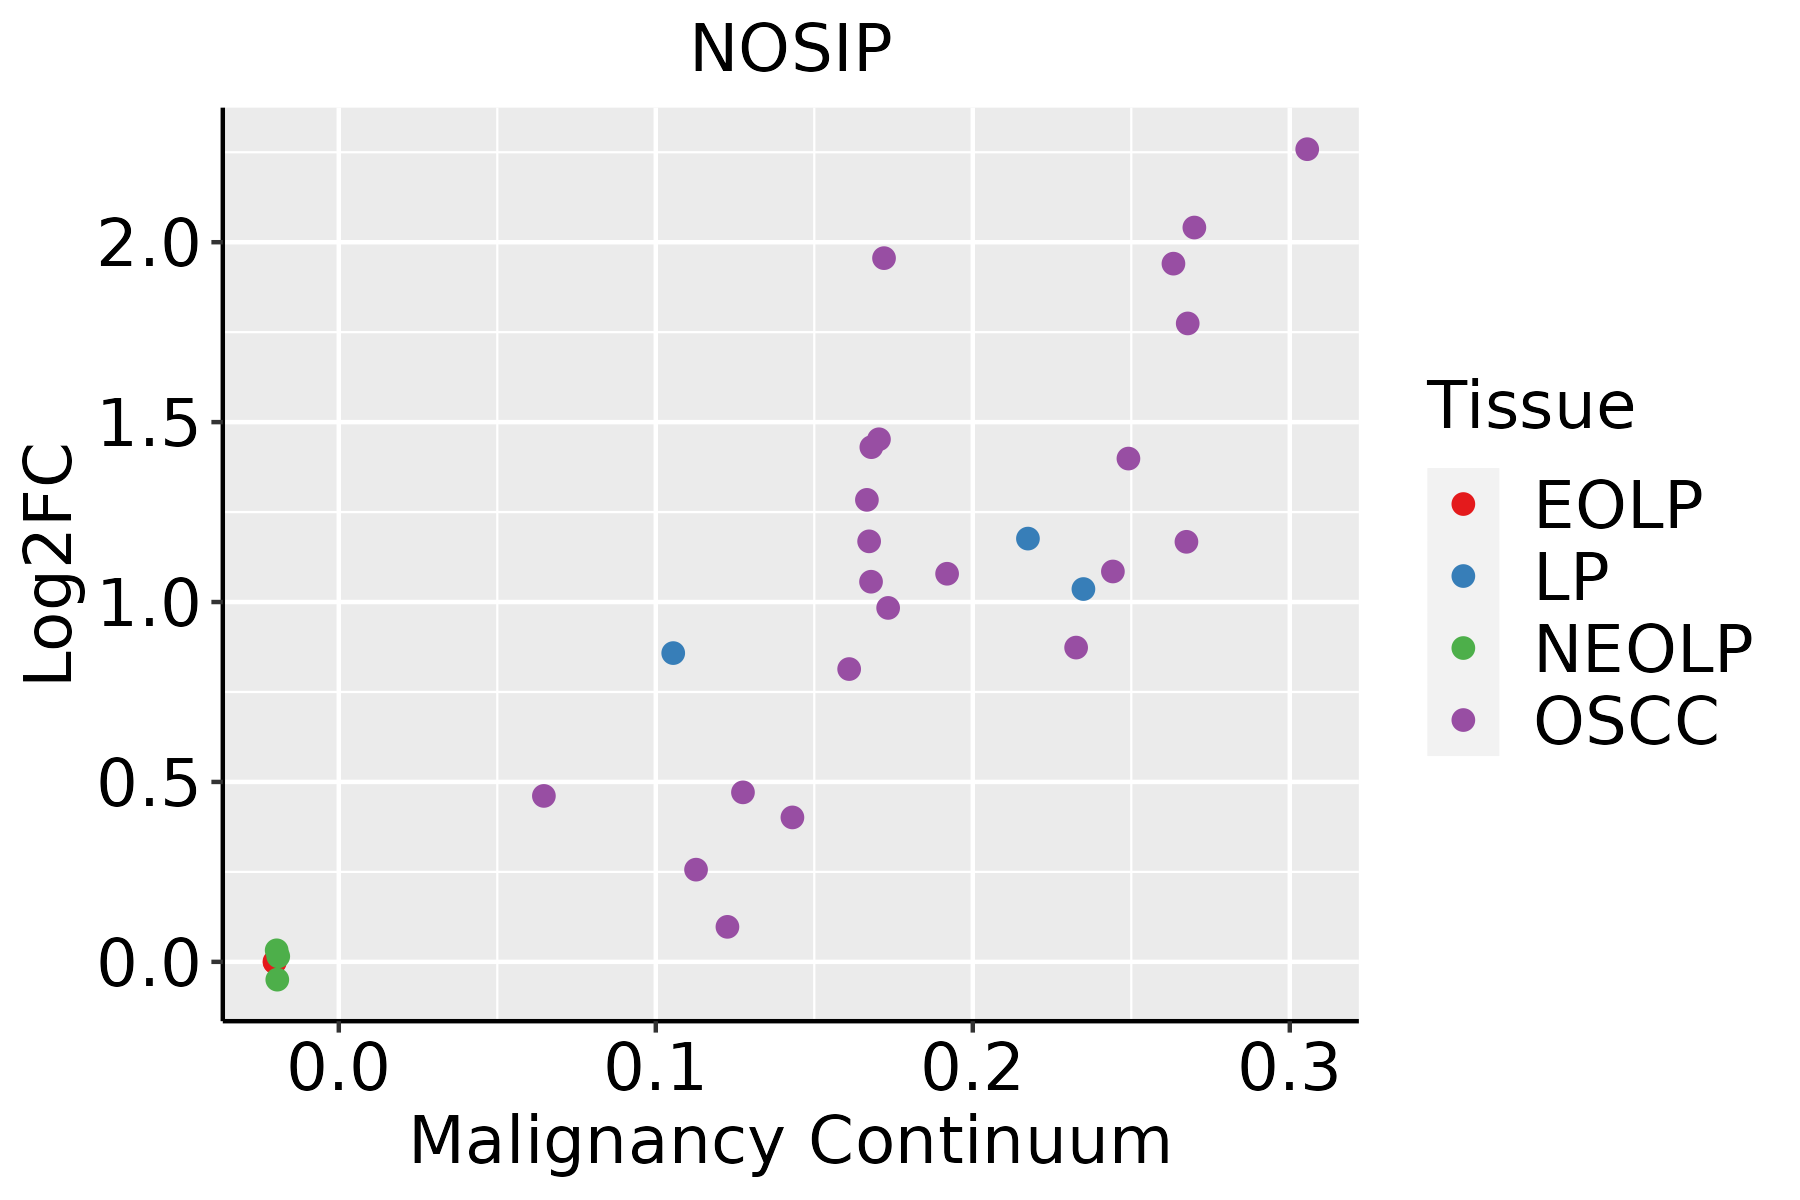 | EOLP: Erosive Oral lichen planus |
| LP: leukoplakia | ||
| NEOLP: Non-erosive oral lichen planus | ||
| OSCC: Oral squamous cell carcinoma | ||
| Skin | 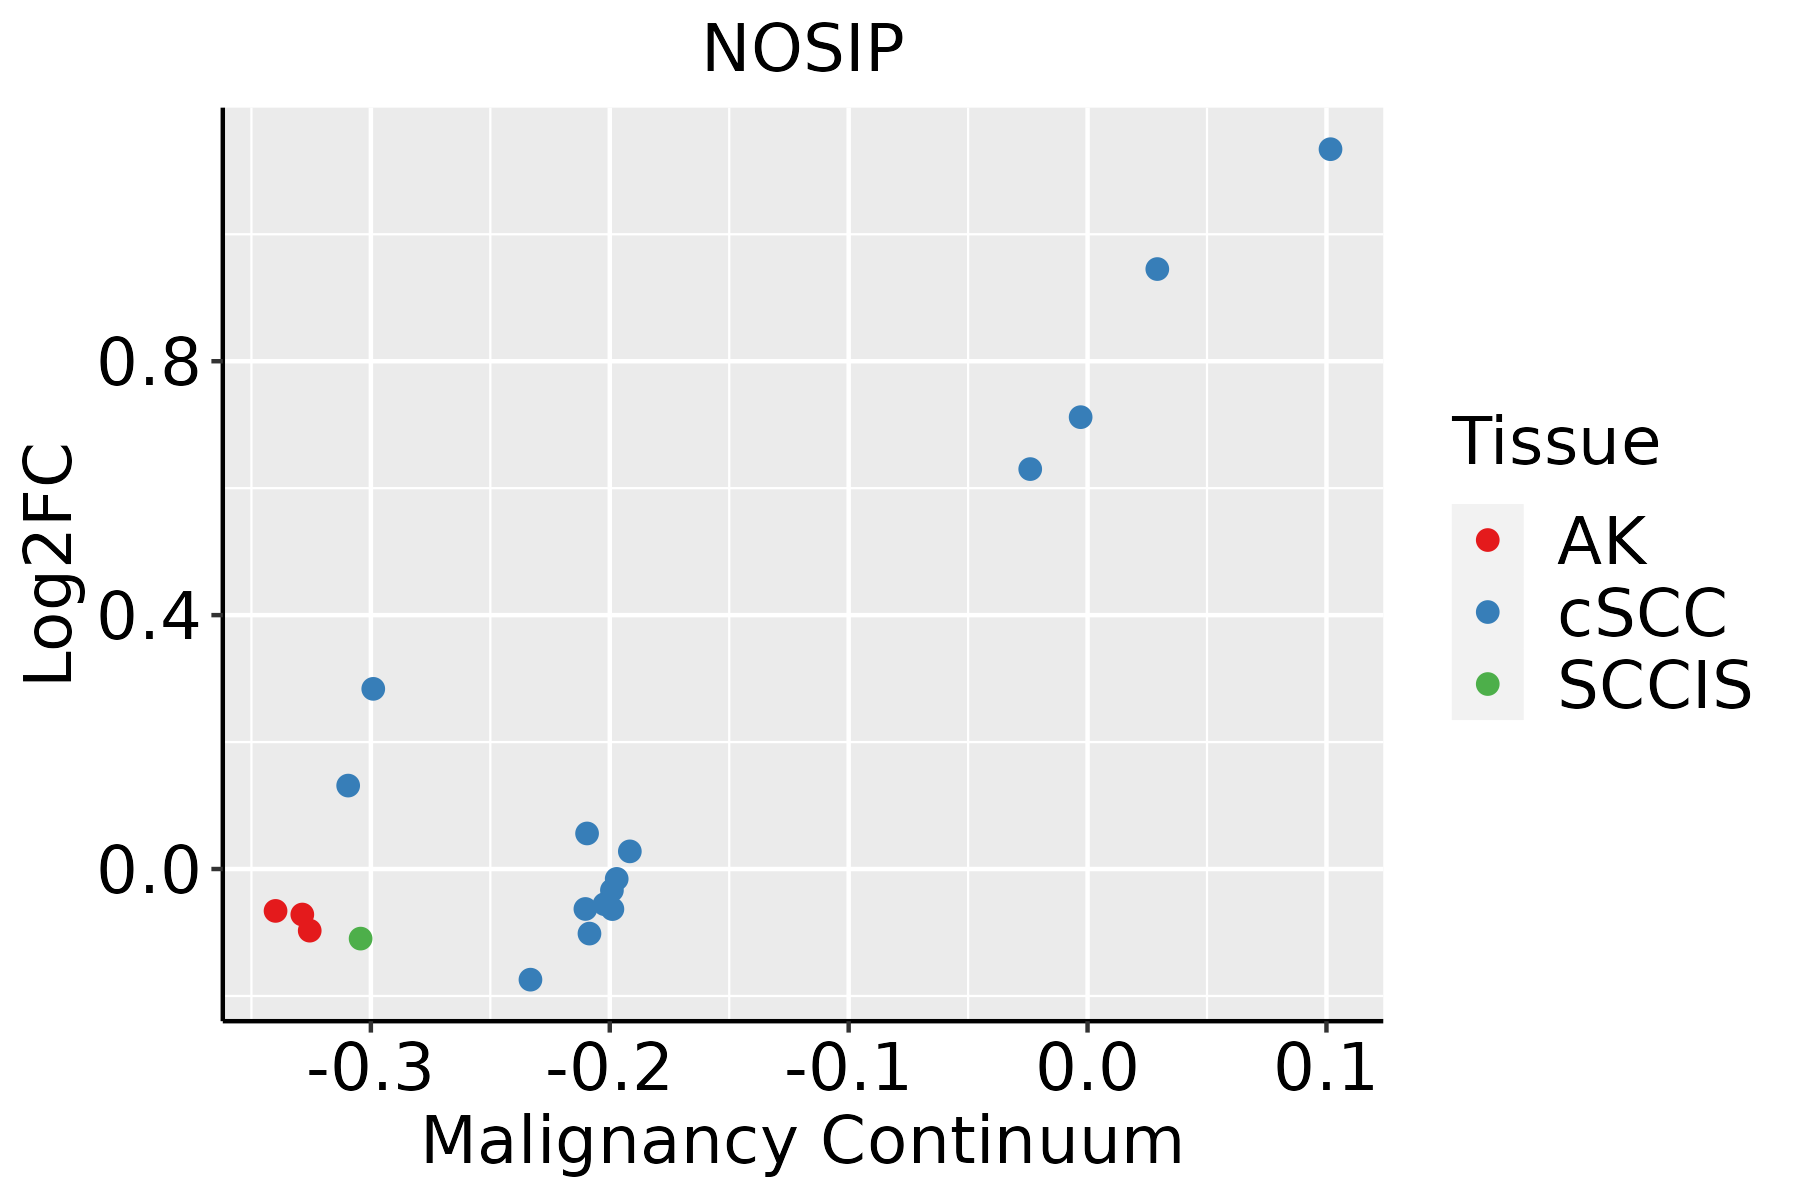 | AK: Actinic keratosis |
| cSCC: Cutaneous squamous cell carcinoma | ||
| SCCIS:squamous cell carcinoma in situ | ||
| Thyroid | 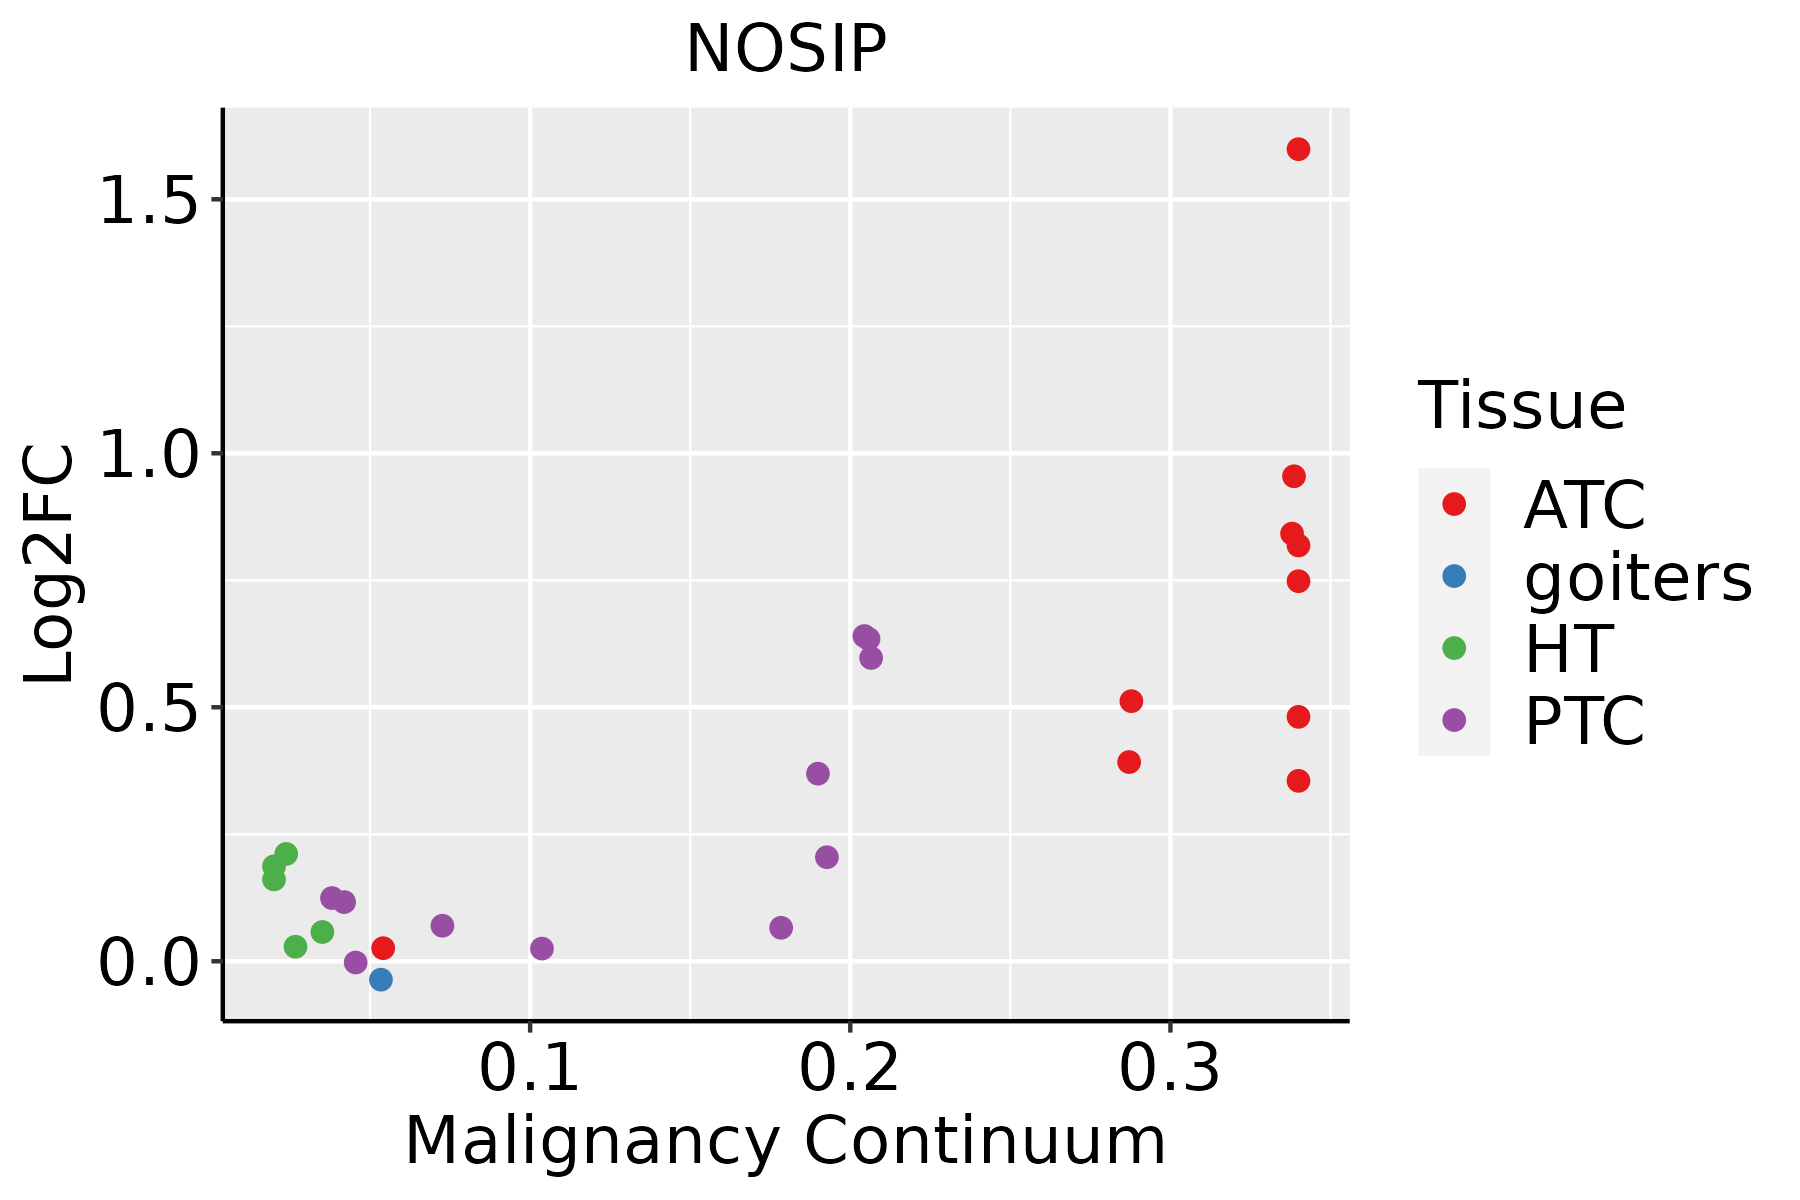 | ATC: Anaplastic thyroid cancer |
| HT: Hashimoto's thyroiditis | ||
| PTC: Papillary thyroid cancer |
| ∗log2FC in expression of this searched gene in stem-like cells from each diseased tissue sample relative to stem-like cells in normal samples in each tissue plotted against the malignancy continuum. Samples are colored based on if they are from different disease stage. |
Top |
Malignant transformation related pathway analysis |
| Find out the enriched GO biological processes and KEGG pathways involved in transition from healthy to precancer to cancer |
| Tissue | Disease Stage | Enriched GO biological Processes |
| Colorectum | AD |  |
| Colorectum | SER |  |
| Colorectum | MSS |  |
| Colorectum | MSI-H |  |
| Colorectum | FAP |  |
| ∗Top 15 enriched GO BP terms are showed in the bar plot of each disease state in each tissue. Each row represents a significant GO biological process which is colored according to the -log10(p.adjust). |
| Page: 1 2 3 4 5 6 7 8 9 |
| GO ID | Tissue | Disease Stage | Description | Gene Ratio | Bg Ratio | pvalue | p.adjust | Count |
| GO:0051341 | Colorectum | SER | regulation of oxidoreductase activity | 27/2897 | 107/18723 | 5.86e-03 | 4.29e-02 | 27 |
| GO:00509991 | Thyroid | PTC | regulation of nitric-oxide synthase activity | 22/5968 | 44/18723 | 9.27e-03 | 3.82e-02 | 22 |
| Page: 1 |
| Pathway ID | Tissue | Disease Stage | Description | Gene Ratio | Bg Ratio | pvalue | p.adjust | qvalue | Count |
| Page: 1 |
Top |
Cell-cell communication analysis |
| Identification of potential cell-cell interactions between two cell types and their ligand-receptor pairs for different disease states |
| Ligand | Receptor | LRpair | Pathway | Tissue | Disease Stage |
| Page: 1 |
Top |
Single-cell gene regulatory network inference analysis |
| Find out the significant the regulons (TFs) and the target genes of each regulon across cell types for different disease states |
| TF | Cell Type | Tissue | Disease Stage | Target Gene | RSS | Regulon Activity |
| ∗The dot plots of a searched regulon are shown for all cell subpopulations in each disease state of each tissue based on the regulon specific score inferred using pySCENIC and by calculating the average expression. |
| Page: 1 |
Top |
Somatic mutation of malignant transformation related genes |
| Annotation of somatic variants for genes involved in malignant transformation |
| Hugo Symbol | Variant Class | Variant Classification | dbSNP RS | HGVSc | HGVSp | HGVSp Short | SWISSPROT | BIOTYPE | SIFT | PolyPhen | Tumor Sample Barcode | Tissue | Histology | Sex | Age | Stage | Therapy Types | Drugs | Outcome |
| NOSIP | SNV | Missense_Mutation | c.299N>C | p.Lys100Thr | p.K100T | Q9Y314 | protein_coding | tolerated(0.31) | benign(0.003) | TCGA-EW-A1OZ-01 | Breast | breast invasive carcinoma | Female | <65 | I/II | Targeted Molecular therapy | trastuzumab | SD | |
| NOSIP | deletion | In_Frame_Del | novel | c.114_131delTGCCGTGAAGGACTTCGA | p.Ala39_Asp44del | p.A39_D44del | Q9Y314 | protein_coding | TCGA-EW-A3U0-01 | Breast | breast invasive carcinoma | Female | <65 | III/IV | Chemotherapy | cisplatin | CR | ||
| NOSIP | SNV | Missense_Mutation | rs769816516 | c.334C>T | p.Arg112Trp | p.R112W | Q9Y314 | protein_coding | deleterious(0) | possibly_damaging(0.837) | TCGA-AA-3864-01 | Colorectum | colon adenocarcinoma | Male | >=65 | I/II | Unknown | Unknown | SD |
| NOSIP | SNV | Missense_Mutation | c.394A>C | p.Lys132Gln | p.K132Q | Q9Y314 | protein_coding | tolerated(0.24) | benign(0.154) | TCGA-AA-A022-01 | Colorectum | colon adenocarcinoma | Female | >=65 | I/II | Unknown | Unknown | SD | |
| NOSIP | SNV | Missense_Mutation | novel | c.887N>A | p.Arg296Gln | p.R296Q | Q9Y314 | protein_coding | deleterious(0.02) | probably_damaging(0.963) | TCGA-AM-5821-01 | Colorectum | colon adenocarcinoma | Female | >=65 | I/II | Unknown | Unknown | SD |
| NOSIP | SNV | Missense_Mutation | rs769816516 | c.334N>T | p.Arg112Trp | p.R112W | Q9Y314 | protein_coding | deleterious(0) | possibly_damaging(0.837) | TCGA-CK-4951-01 | Colorectum | colon adenocarcinoma | Female | >=65 | I/II | Unknown | Unknown | PD |
| NOSIP | SNV | Missense_Mutation | rs376400410 | c.545N>T | p.Thr182Met | p.T182M | Q9Y314 | protein_coding | deleterious(0.03) | possibly_damaging(0.577) | TCGA-D5-6530-01 | Colorectum | colon adenocarcinoma | Male | <65 | I/II | Unknown | Unknown | SD |
| NOSIP | SNV | Missense_Mutation | c.68N>T | p.Thr23Ile | p.T23I | Q9Y314 | protein_coding | deleterious(0.01) | probably_damaging(0.987) | TCGA-G4-6302-01 | Colorectum | colon adenocarcinoma | Female | >=65 | I/II | Unknown | Unknown | SD | |
| NOSIP | SNV | Missense_Mutation | c.284N>A | p.Arg95Gln | p.R95Q | Q9Y314 | protein_coding | tolerated(0.39) | benign(0.001) | TCGA-EI-6510-01 | Colorectum | rectum adenocarcinoma | Female | >=65 | I/II | Unknown | Unknown | SD | |
| NOSIP | SNV | Missense_Mutation | rs767271460 | c.649N>T | p.Arg217Cys | p.R217C | Q9Y314 | protein_coding | deleterious(0) | probably_damaging(0.955) | TCGA-A5-A1OF-01 | Endometrium | uterine corpus endometrioid carcinoma | Female | <65 | I/II | Unknown | Unknown | SD |
| Page: 1 2 3 |
Top |
Related drugs of malignant transformation related genes |
| Identification of chemicals and drugs interact with genes involved in malignant transfromation |
| (DGIdb 4.0) |
| Entrez ID | Symbol | Category | Interaction Types | Drug Claim Name | Drug Name | PMIDs |
| Page: 1 |

Copyright 2023-Present -The University of Texas Health Science Center at Houston |