
|
|||||
|
 | |
| |
| |
| |
| |
| |
|
Gene: MIR205HG |
Gene summary for MIR205HG |
| Gene information | Species | Human | Gene symbol | MIR205HG | Gene ID | 642587 |
| Gene name | MIR205 host gene | |
| Gene Alias | LINC00510 | |
| Cytomap | 1q32.2 | |
| Gene Type | ncRNA | GO ID | NA | UniProtAcc | NA |
Top |
Malignant transformation analysis |
| Identification of the aberrant gene expression in precancerous and cancerous lesions by comparing the gene expression of stem-like cells in diseased tissues with normal stem cells |
| Entrez ID | Symbol | Replicates | Species | Organ | Tissue | Adj P-value | Log2FC | Malignancy |
| 642587 | MIR205HG | GSM5353225_PA_PR5196-1_Pool_1_2_3_S53_L002 | Human | Prostate | Tumor | 2.11e-09 | -9.46e-01 | 0.1619 |
| 642587 | MIR205HG | GSM5353226_PA_PR5196-2_Pool_1_2_3_S54_L002 | Human | Prostate | Tumor | 5.02e-04 | -8.40e-01 | 0.159 |
| 642587 | MIR205HG | GSM5353227_PA_PR5199-193K_Pool_1_2_3_S55_L002 | Human | Prostate | Tumor | 1.42e-19 | -9.71e-01 | 0.1602 |
| 642587 | MIR205HG | GSM5353228_PA_PR5199-640K_Pool_1_3_S108_L004 | Human | Prostate | Tumor | 7.10e-06 | -1.17e+00 | 0.1537 |
| 642587 | MIR205HG | GSM5353232_PA_PR5249_T1_S3_L001 | Human | Prostate | Tumor | 3.80e-05 | -8.33e-01 | 0.1439 |
| 642587 | MIR205HG | GSM5353240_PA_PR5254_T1_S15_L001 | Human | Prostate | Tumor | 1.66e-31 | -1.03e+00 | 0.1575 |
| 642587 | MIR205HG | GSM5353243_PA_PR5261_T1_S23_L002 | Human | Prostate | Tumor | 1.07e-29 | -9.04e-01 | 0.1545 |
| 642587 | MIR205HG | GSM5353244_PA_PR5261_T2_S24_L002 | Human | Prostate | Tumor | 1.63e-23 | -8.99e-01 | 0.1569 |
| 642587 | MIR205HG | GSM5353248_PA_PR5269_4_S28_L002 | Human | Prostate | Tumor | 2.99e-03 | -8.02e-01 | 0.1541 |
| 642587 | MIR205HG | P1_S1_AK | Human | Skin | AK | 2.58e-26 | 6.00e-01 | -0.3399 |
| 642587 | MIR205HG | P2_S3_AK | Human | Skin | AK | 1.92e-31 | 7.34e-01 | -0.3287 |
| 642587 | MIR205HG | P2_S4_SCCIS | Human | Skin | SCCIS | 2.14e-35 | 8.58e-01 | -0.3043 |
| 642587 | MIR205HG | P3_S6_AK | Human | Skin | AK | 5.69e-11 | 5.58e-01 | -0.3256 |
| 642587 | MIR205HG | P4_S8_cSCC | Human | Skin | cSCC | 9.43e-36 | 8.79e-01 | -0.3095 |
| 642587 | MIR205HG | P5_S10_cSCC | Human | Skin | cSCC | 2.86e-59 | 6.77e-01 | -0.299 |
| 642587 | MIR205HG | P1_cSCC | Human | Skin | cSCC | 1.36e-87 | 4.53e+00 | 0.0292 |
| 642587 | MIR205HG | P2_cSCC | Human | Skin | cSCC | 3.45e-106 | 3.82e+00 | -0.024 |
| 642587 | MIR205HG | P4_cSCC | Human | Skin | cSCC | 1.34e-89 | 2.97e+00 | -0.00290000000000005 |
| 642587 | MIR205HG | P10_cSCC | Human | Skin | cSCC | 8.50e-83 | 4.51e+00 | 0.1017 |
| 642587 | MIR205HG | cSCC_p1 | Human | Skin | cSCC | 4.80e-27 | -7.09e-01 | -0.1916 |
| Page: 1 2 3 4 5 6 7 8 |
| Tissue | Expression Dynamics | Abbreviation |
| Cervix | 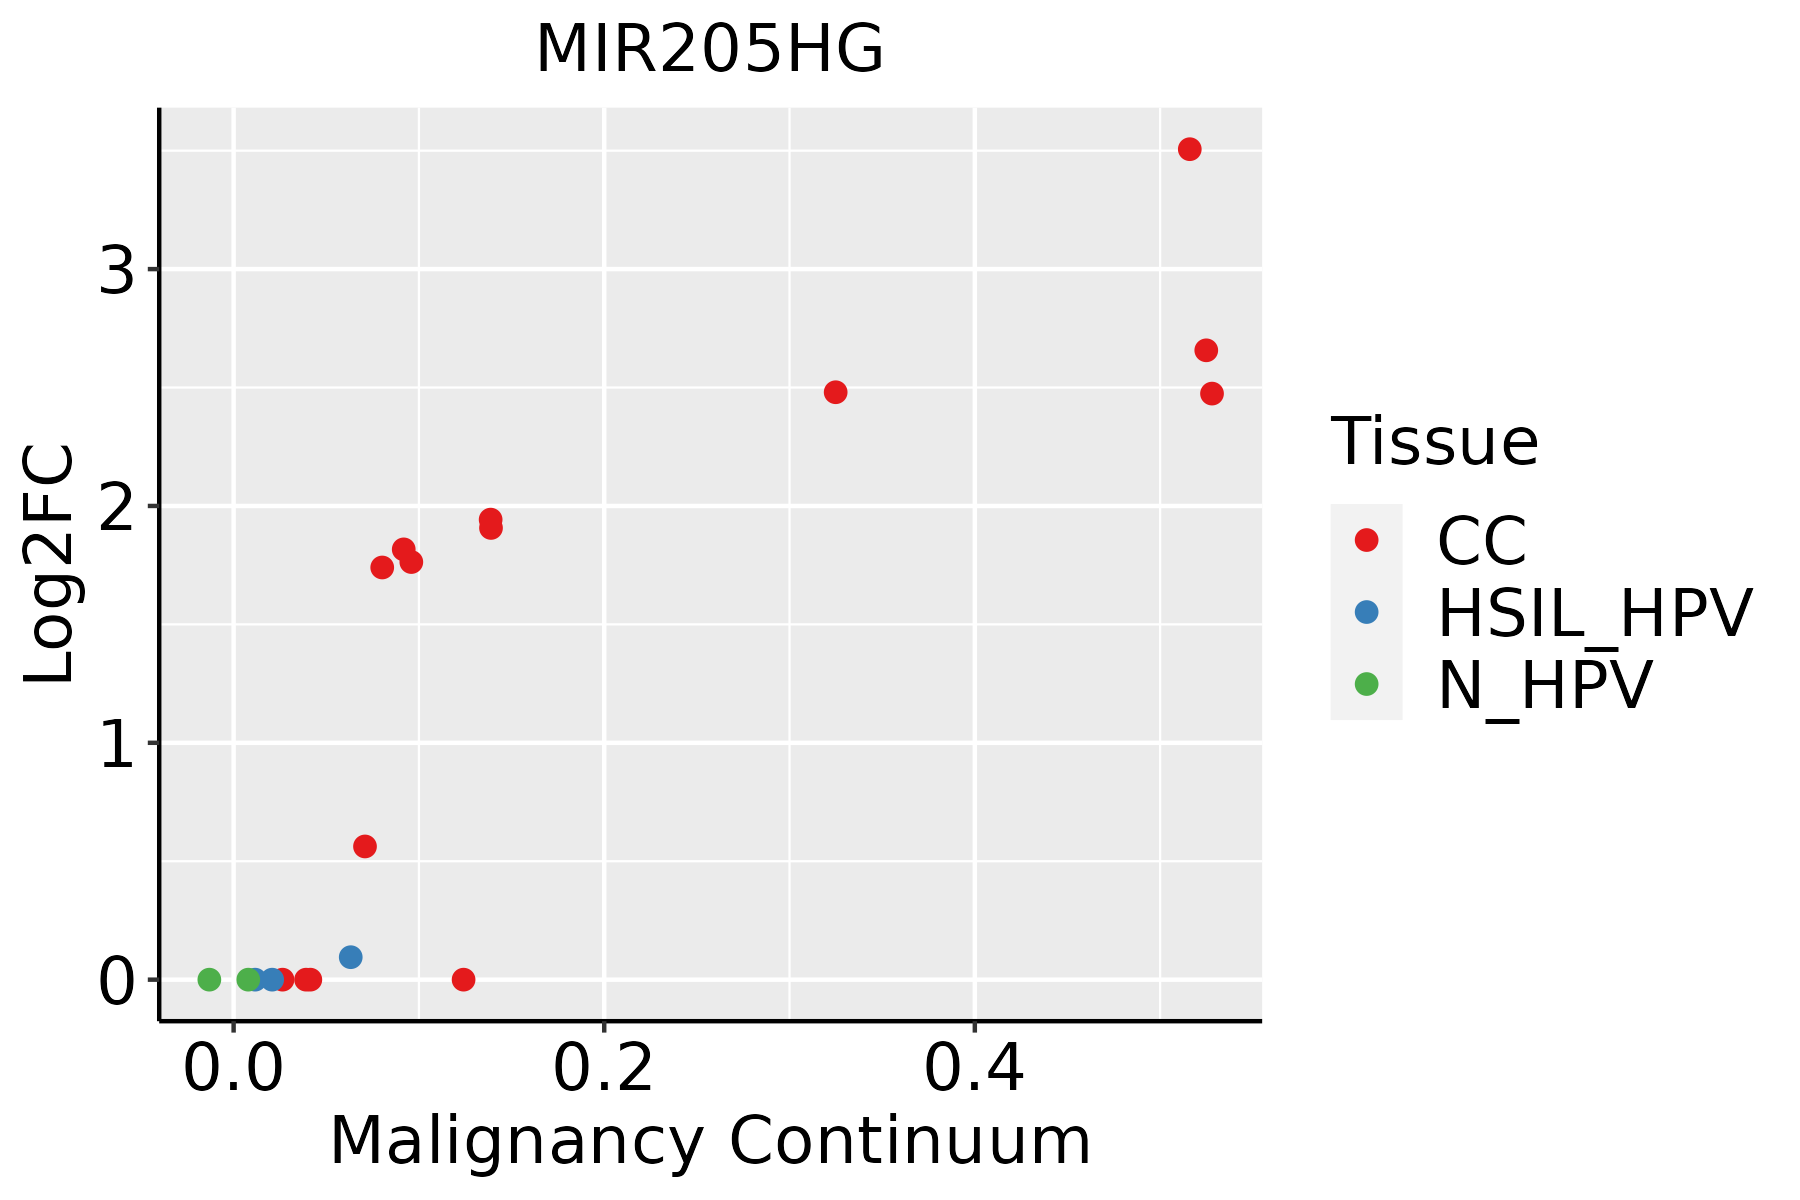 | CC: Cervix cancer |
| HSIL_HPV: HPV-infected high-grade squamous intraepithelial lesions | ||
| N_HPV: HPV-infected normal cervix | ||
| Esophagus | 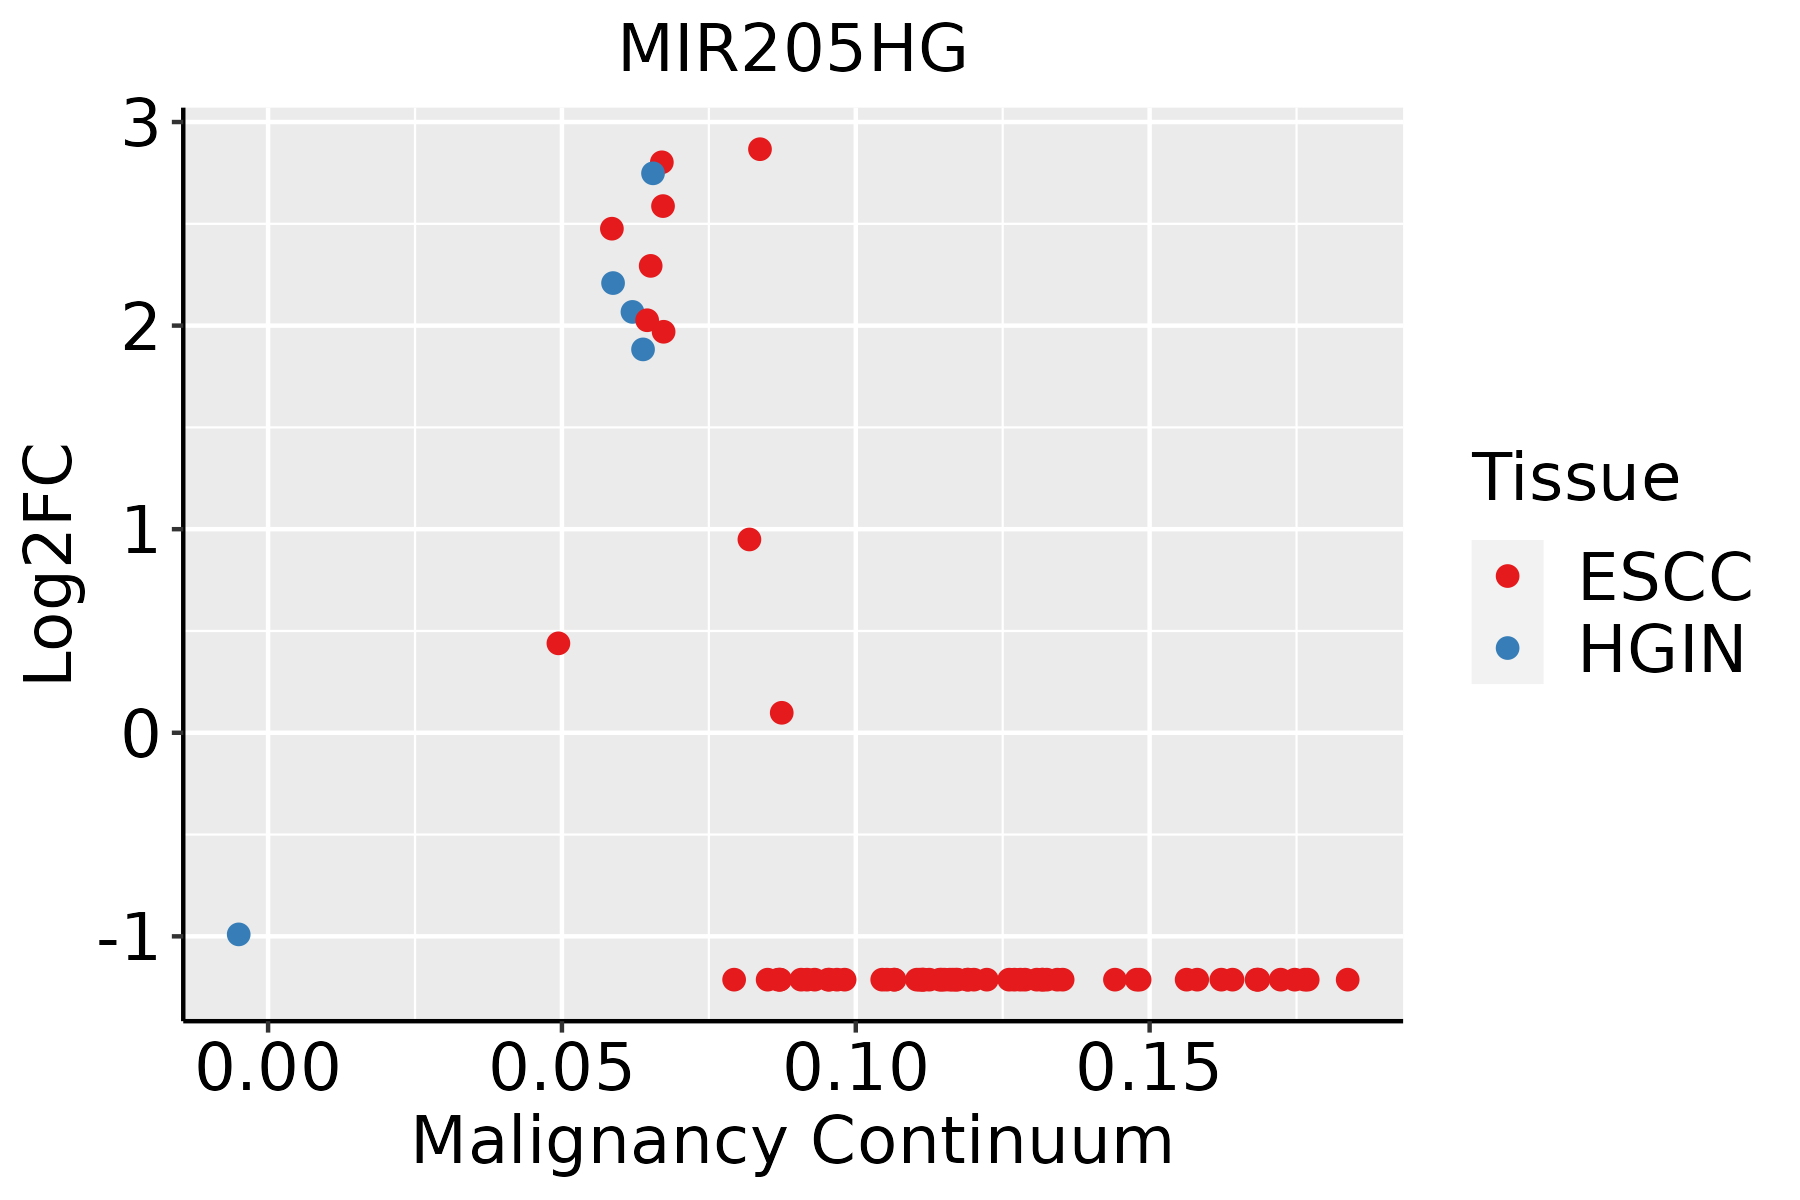 | ESCC: Esophageal squamous cell carcinoma |
| HGIN: High-grade intraepithelial neoplasias | ||
| LGIN: Low-grade intraepithelial neoplasias | ||
| Lung | 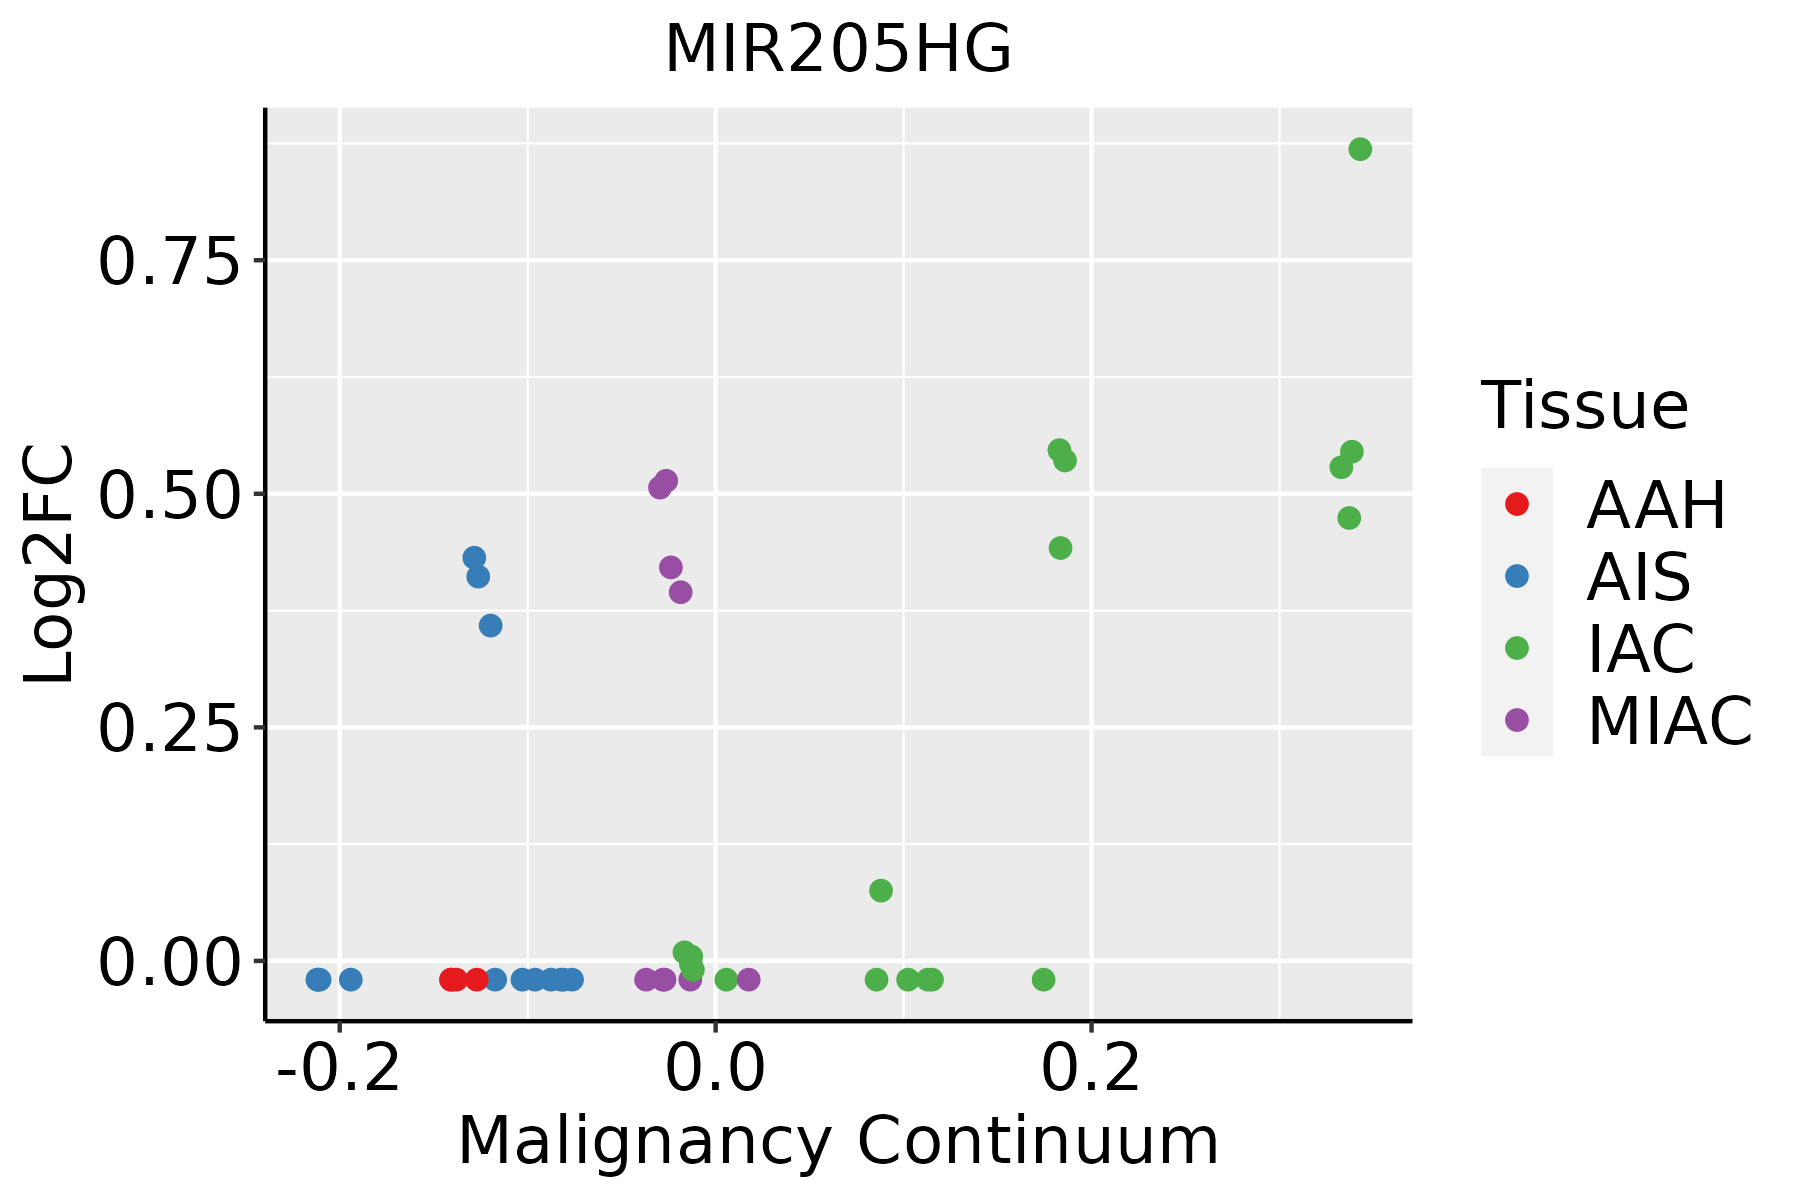 | AAH: Atypical adenomatous hyperplasia |
| AIS: Adenocarcinoma in situ | ||
| IAC: Invasive lung adenocarcinoma | ||
| MIA: Minimally invasive adenocarcinoma | ||
| Prostate |  | BPH: Benign Prostatic Hyperplasia |
| Skin | 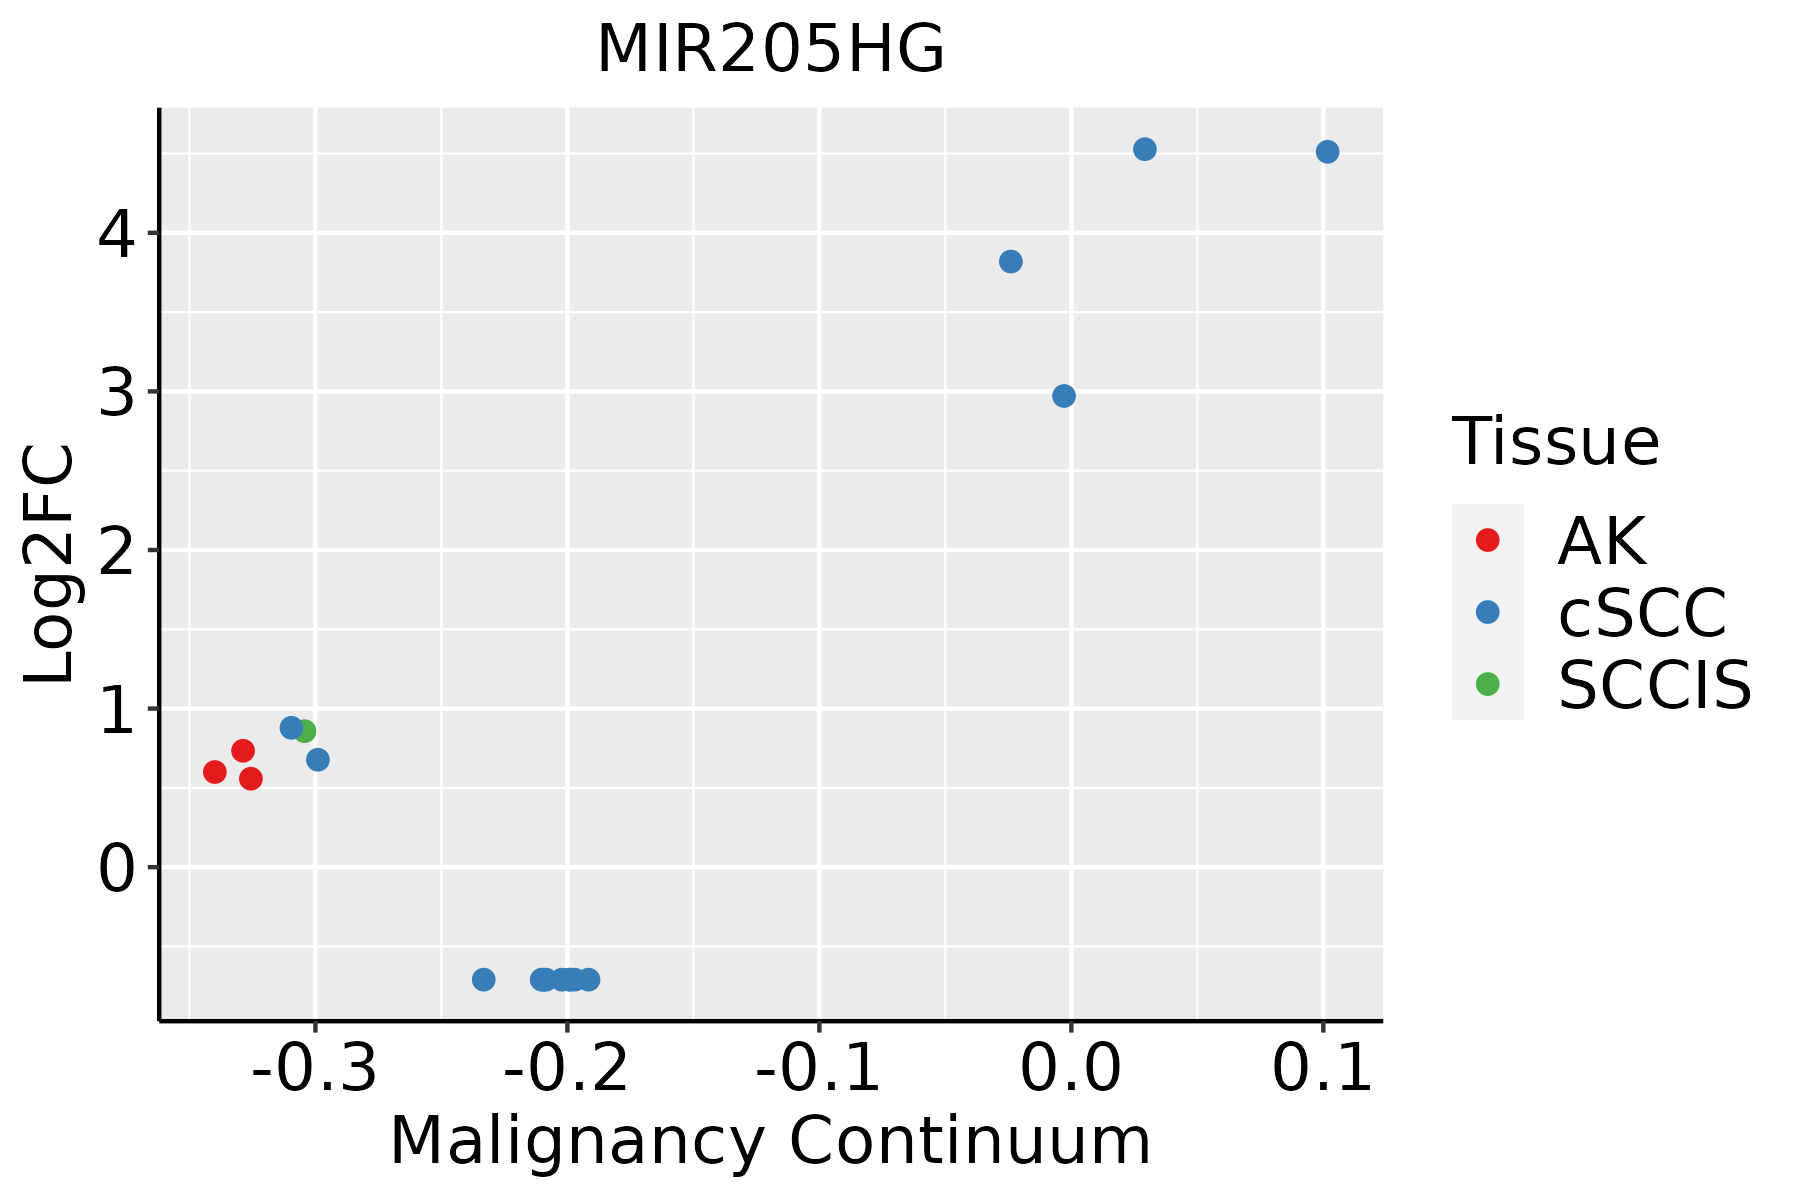 | AK: Actinic keratosis |
| cSCC: Cutaneous squamous cell carcinoma | ||
| SCCIS:squamous cell carcinoma in situ |
| ∗log2FC in expression of this searched gene in stem-like cells from each diseased tissue sample relative to stem-like cells in normal samples in each tissue plotted against the malignancy continuum. Samples are colored based on if they are from different disease stage. |
Top |
Malignant transformation related pathway analysis |
| Find out the enriched GO biological processes and KEGG pathways involved in transition from healthy to precancer to cancer |
| Tissue | Disease Stage | Enriched GO biological Processes |
| Colorectum | AD |  |
| Colorectum | SER |  |
| Colorectum | MSS |  |
| Colorectum | MSI-H |  |
| Colorectum | FAP |  |
| ∗Top 15 enriched GO BP terms are showed in the bar plot of each disease state in each tissue. Each row represents a significant GO biological process which is colored according to the -log10(p.adjust). |
| Page: 1 2 3 4 5 6 7 8 9 |
| GO ID | Tissue | Disease Stage | Description | Gene Ratio | Bg Ratio | pvalue | p.adjust | Count |
| Page: 1 |
| Pathway ID | Tissue | Disease Stage | Description | Gene Ratio | Bg Ratio | pvalue | p.adjust | qvalue | Count |
| Page: 1 |
Top |
Cell-cell communication analysis |
| Identification of potential cell-cell interactions between two cell types and their ligand-receptor pairs for different disease states |
| Ligand | Receptor | LRpair | Pathway | Tissue | Disease Stage |
| Page: 1 |
Top |
Single-cell gene regulatory network inference analysis |
| Find out the significant the regulons (TFs) and the target genes of each regulon across cell types for different disease states |
| TF | Cell Type | Tissue | Disease Stage | Target Gene | RSS | Regulon Activity |
| ∗The dot plots of a searched regulon are shown for all cell subpopulations in each disease state of each tissue based on the regulon specific score inferred using pySCENIC and by calculating the average expression. |
| Page: 1 |
Top |
Somatic mutation of malignant transformation related genes |
| Annotation of somatic variants for genes involved in malignant transformation |
| Hugo Symbol | Variant Class | Variant Classification | dbSNP RS | HGVSc | HGVSp | HGVSp Short | SWISSPROT | BIOTYPE | SIFT | PolyPhen | Tumor Sample Barcode | Tissue | Histology | Sex | Age | Stage | Therapy Types | Drugs | Outcome |
| Page: 1 |
Top |
Related drugs of malignant transformation related genes |
| Identification of chemicals and drugs interact with genes involved in malignant transfromation |
| (DGIdb 4.0) |
| Entrez ID | Symbol | Category | Interaction Types | Drug Claim Name | Drug Name | PMIDs |
| Page: 1 |

Copyright 2023-Present -The University of Texas Health Science Center at Houston |