| Tissue | Expression Dynamics | Abbreviation |
| Cervix | 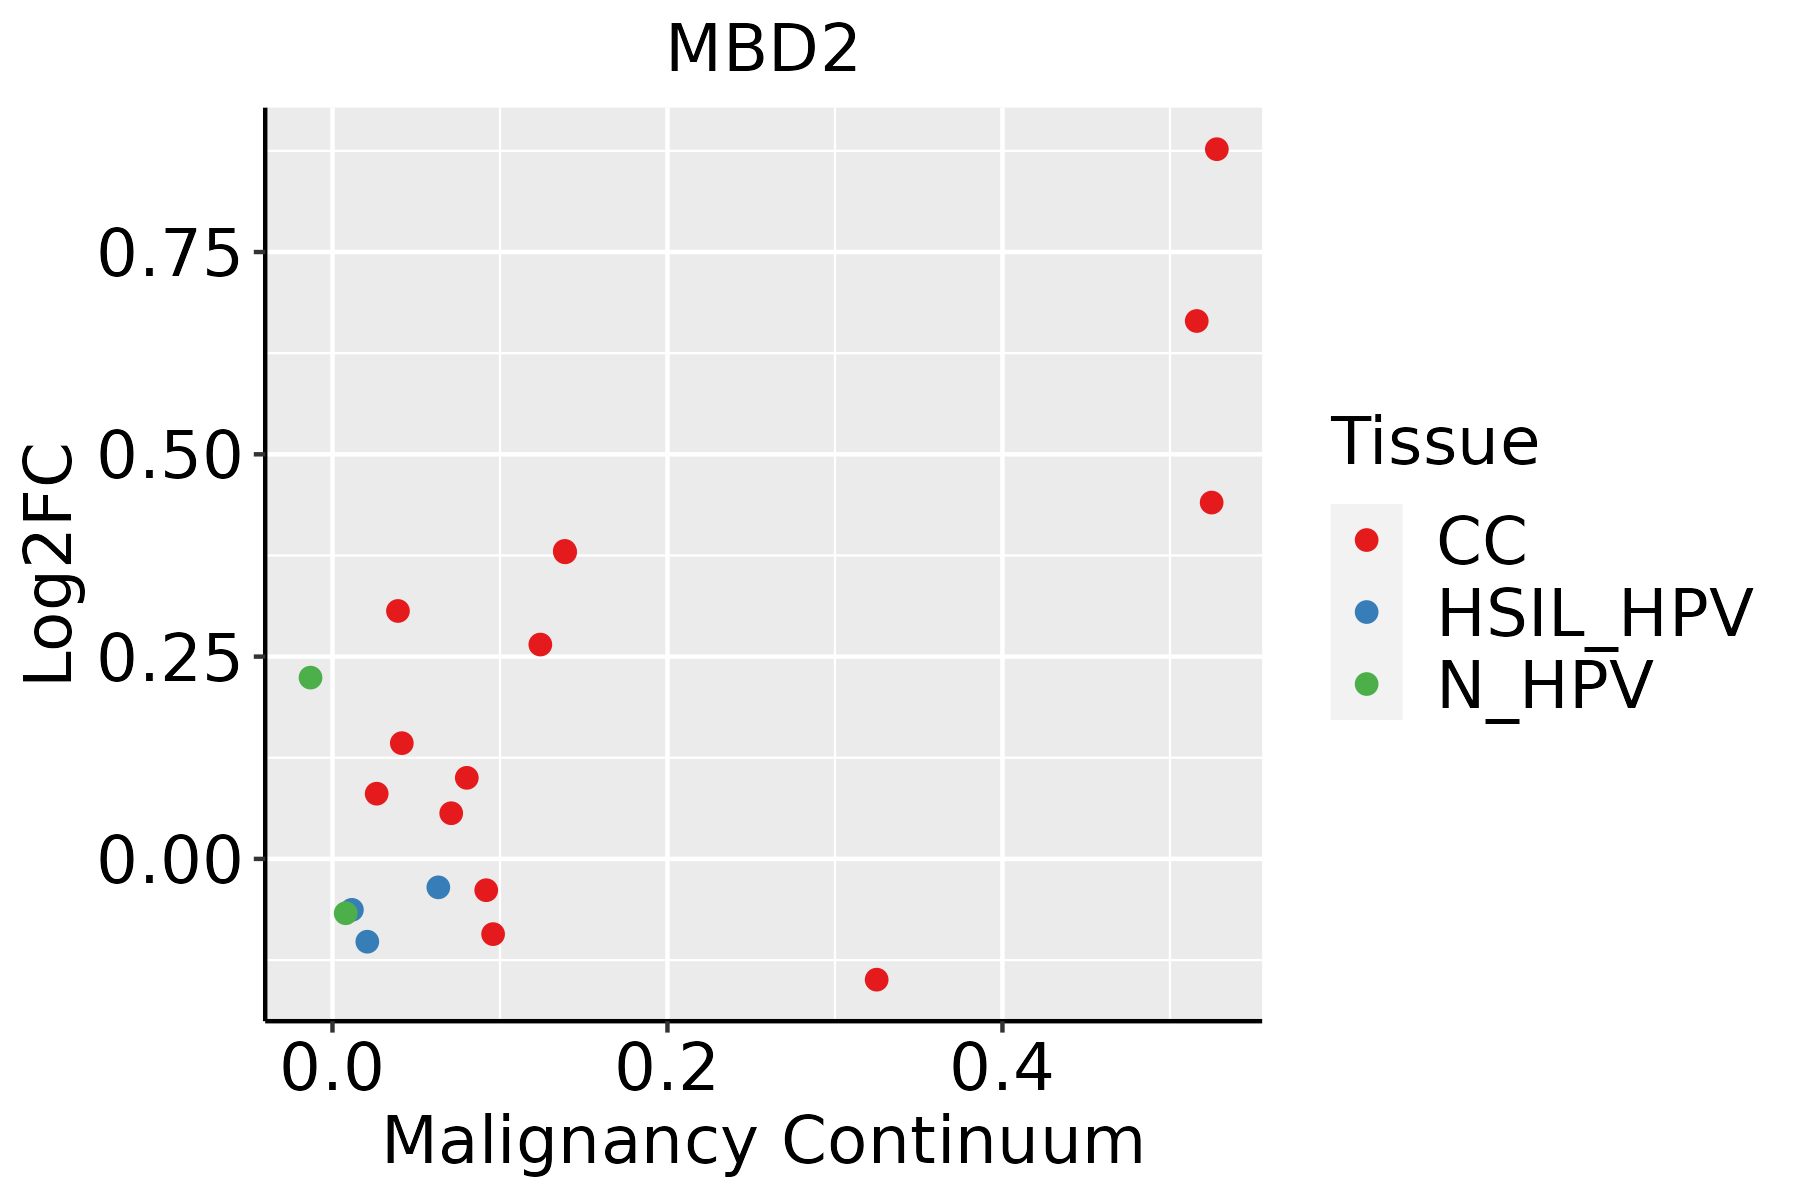 | CC: Cervix cancer |
| HSIL_HPV: HPV-infected high-grade squamous intraepithelial lesions |
| N_HPV: HPV-infected normal cervix |
| Colorectum (GSE201348) |  | FAP: Familial adenomatous polyposis |
| CRC: Colorectal cancer |
| Colorectum (HTA11) |  | AD: Adenomas |
| SER: Sessile serrated lesions |
| MSI-H: Microsatellite-high colorectal cancer |
| MSS: Microsatellite stable colorectal cancer |
| Esophagus | 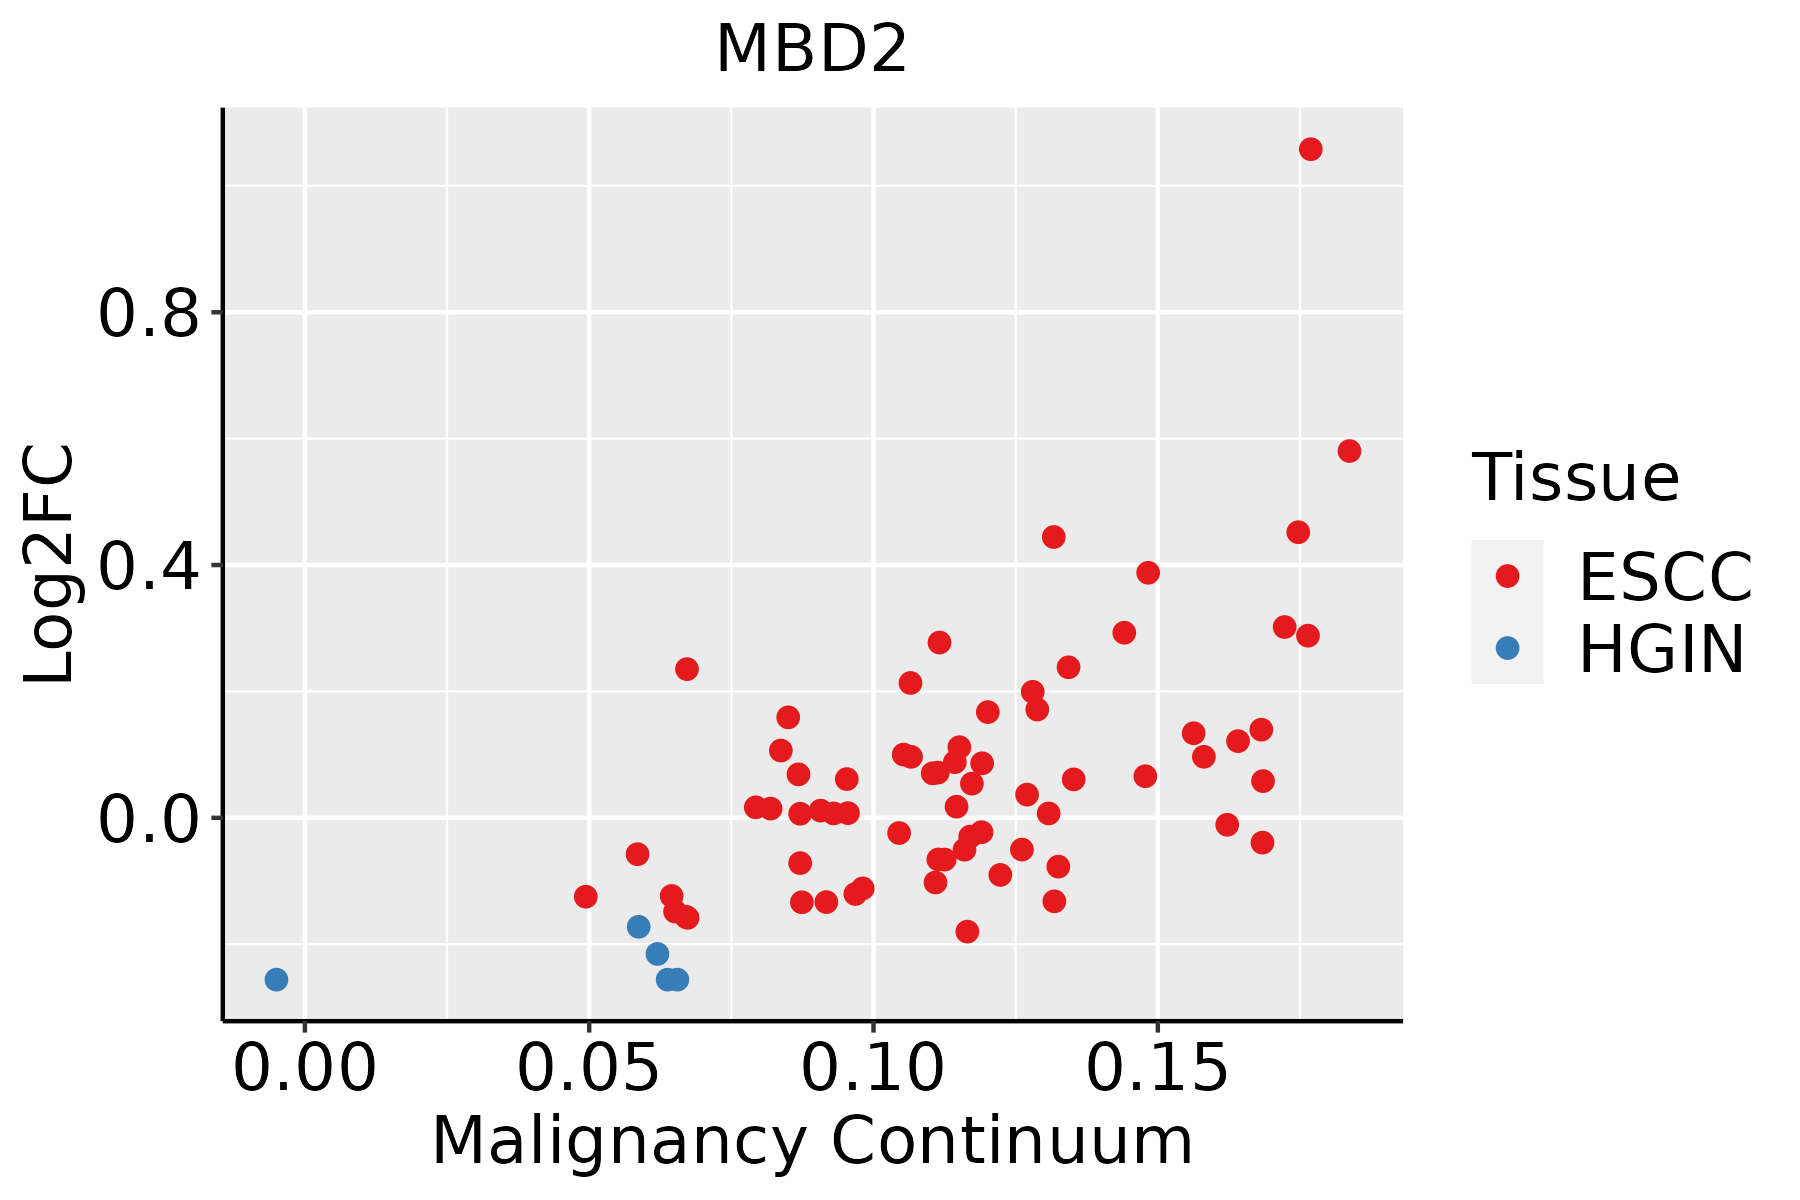 | ESCC: Esophageal squamous cell carcinoma |
| HGIN: High-grade intraepithelial neoplasias |
| LGIN: Low-grade intraepithelial neoplasias |
| Liver |  | HCC: Hepatocellular carcinoma |
| NAFLD: Non-alcoholic fatty liver disease |
| Oral Cavity | 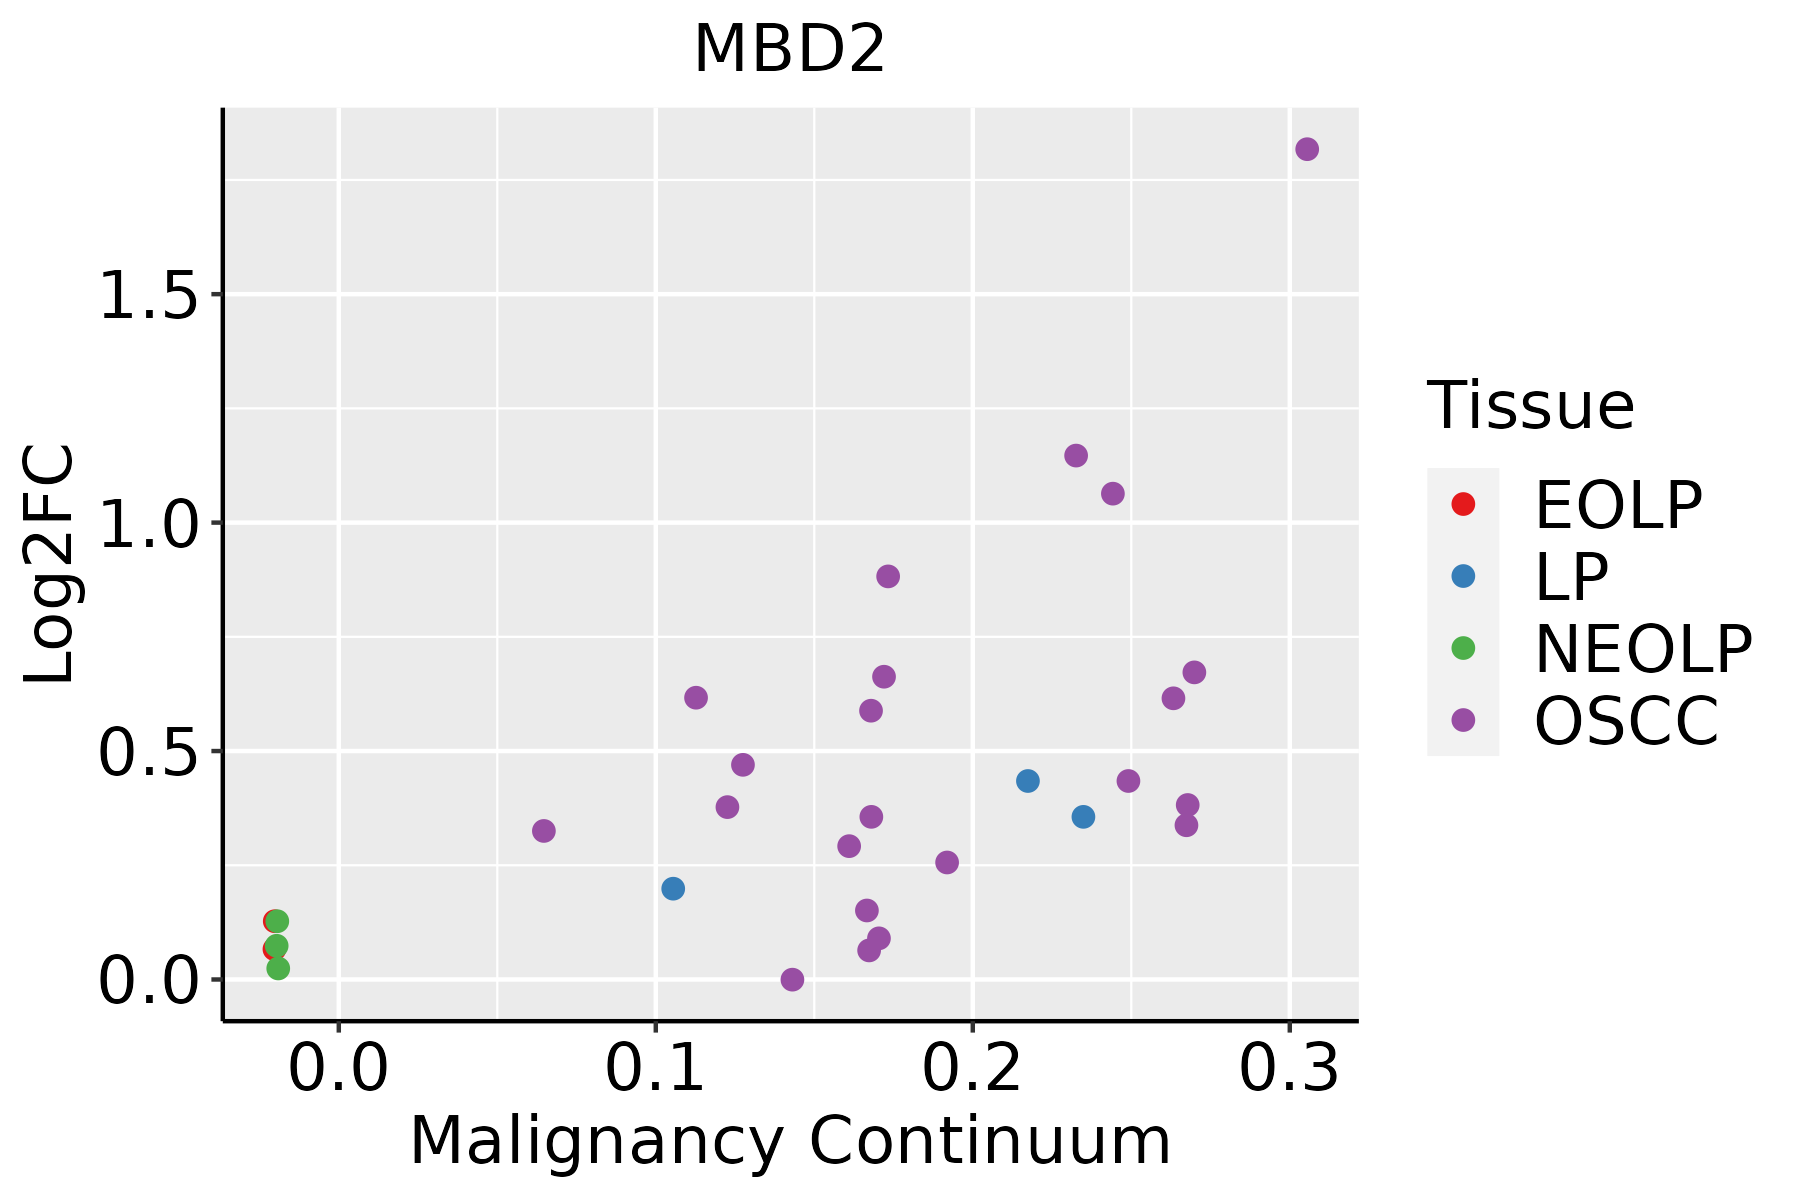 | EOLP: Erosive Oral lichen planus |
| LP: leukoplakia |
| NEOLP: Non-erosive oral lichen planus |
| OSCC: Oral squamous cell carcinoma |
| Prostate | 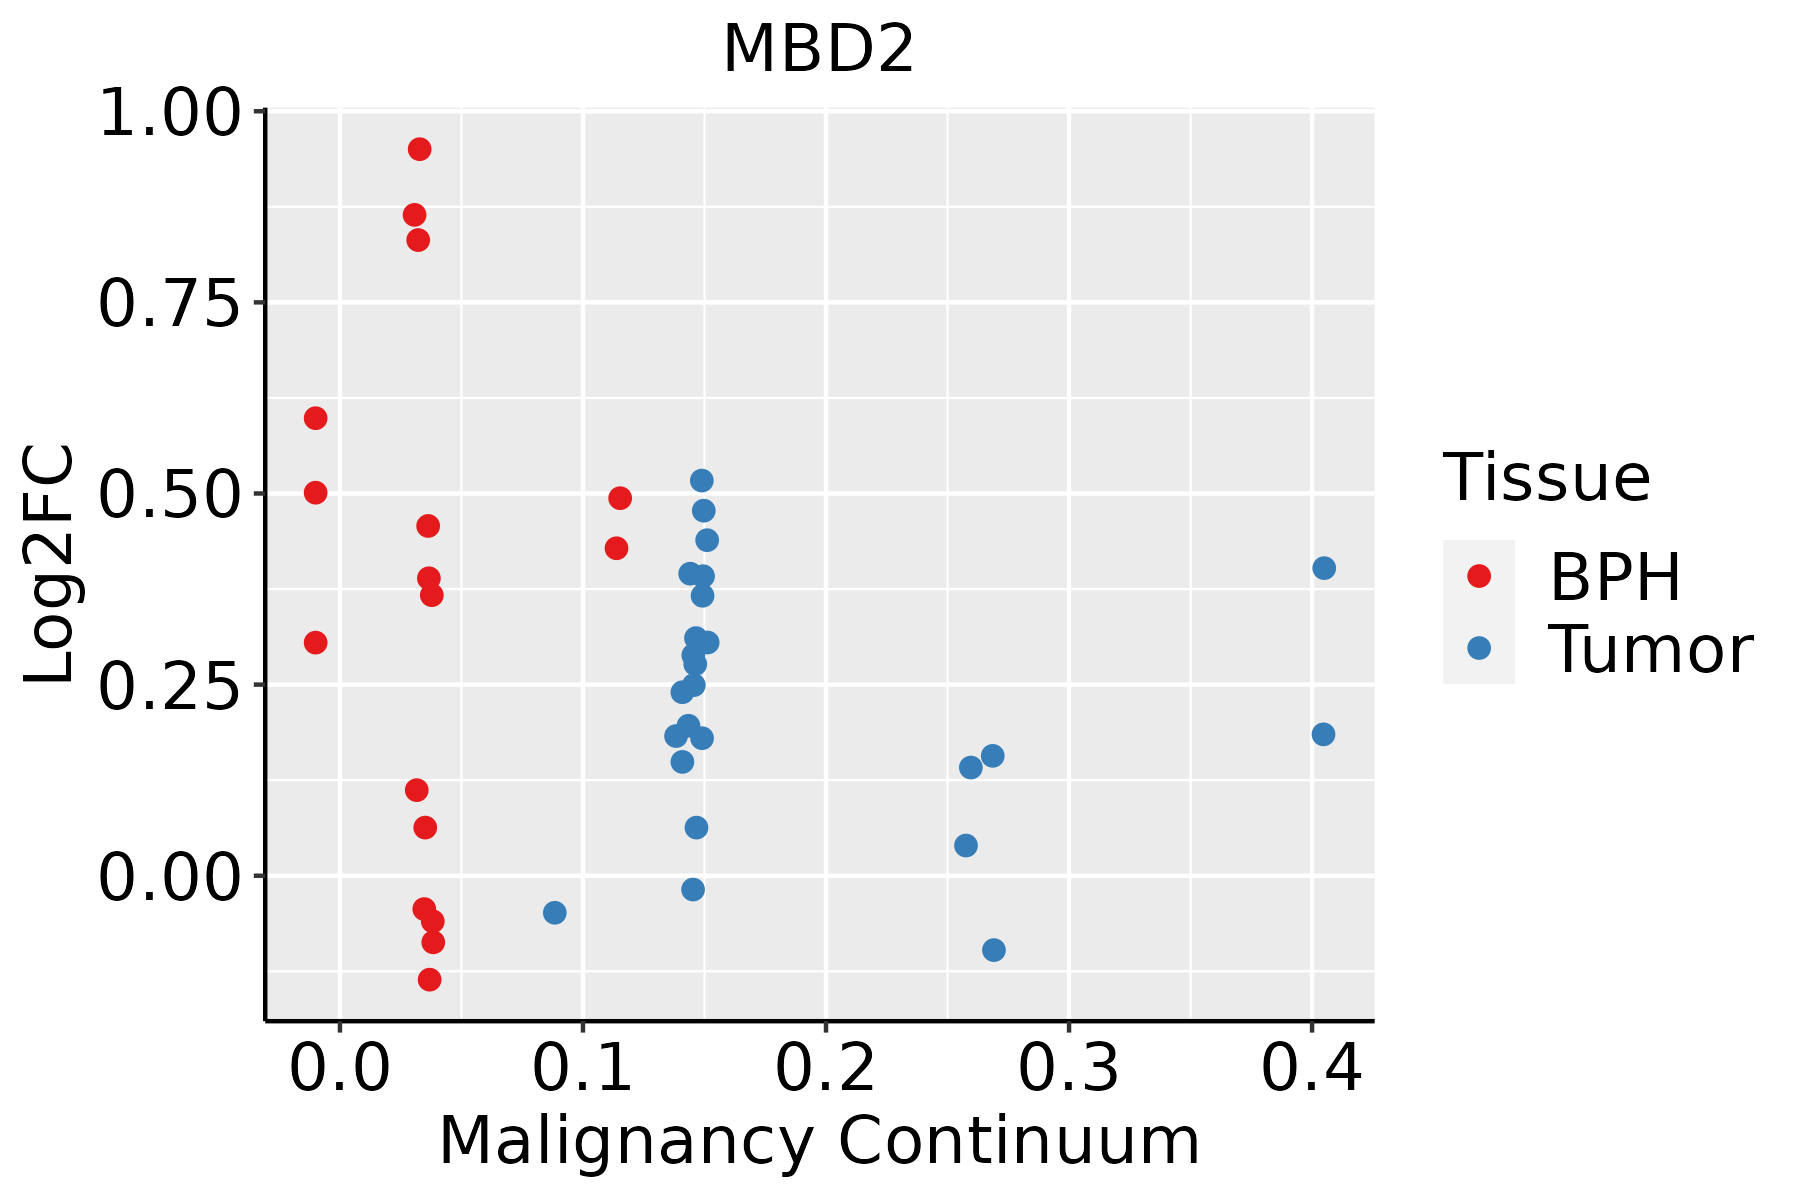 | BPH: Benign Prostatic Hyperplasia |
| Skin | 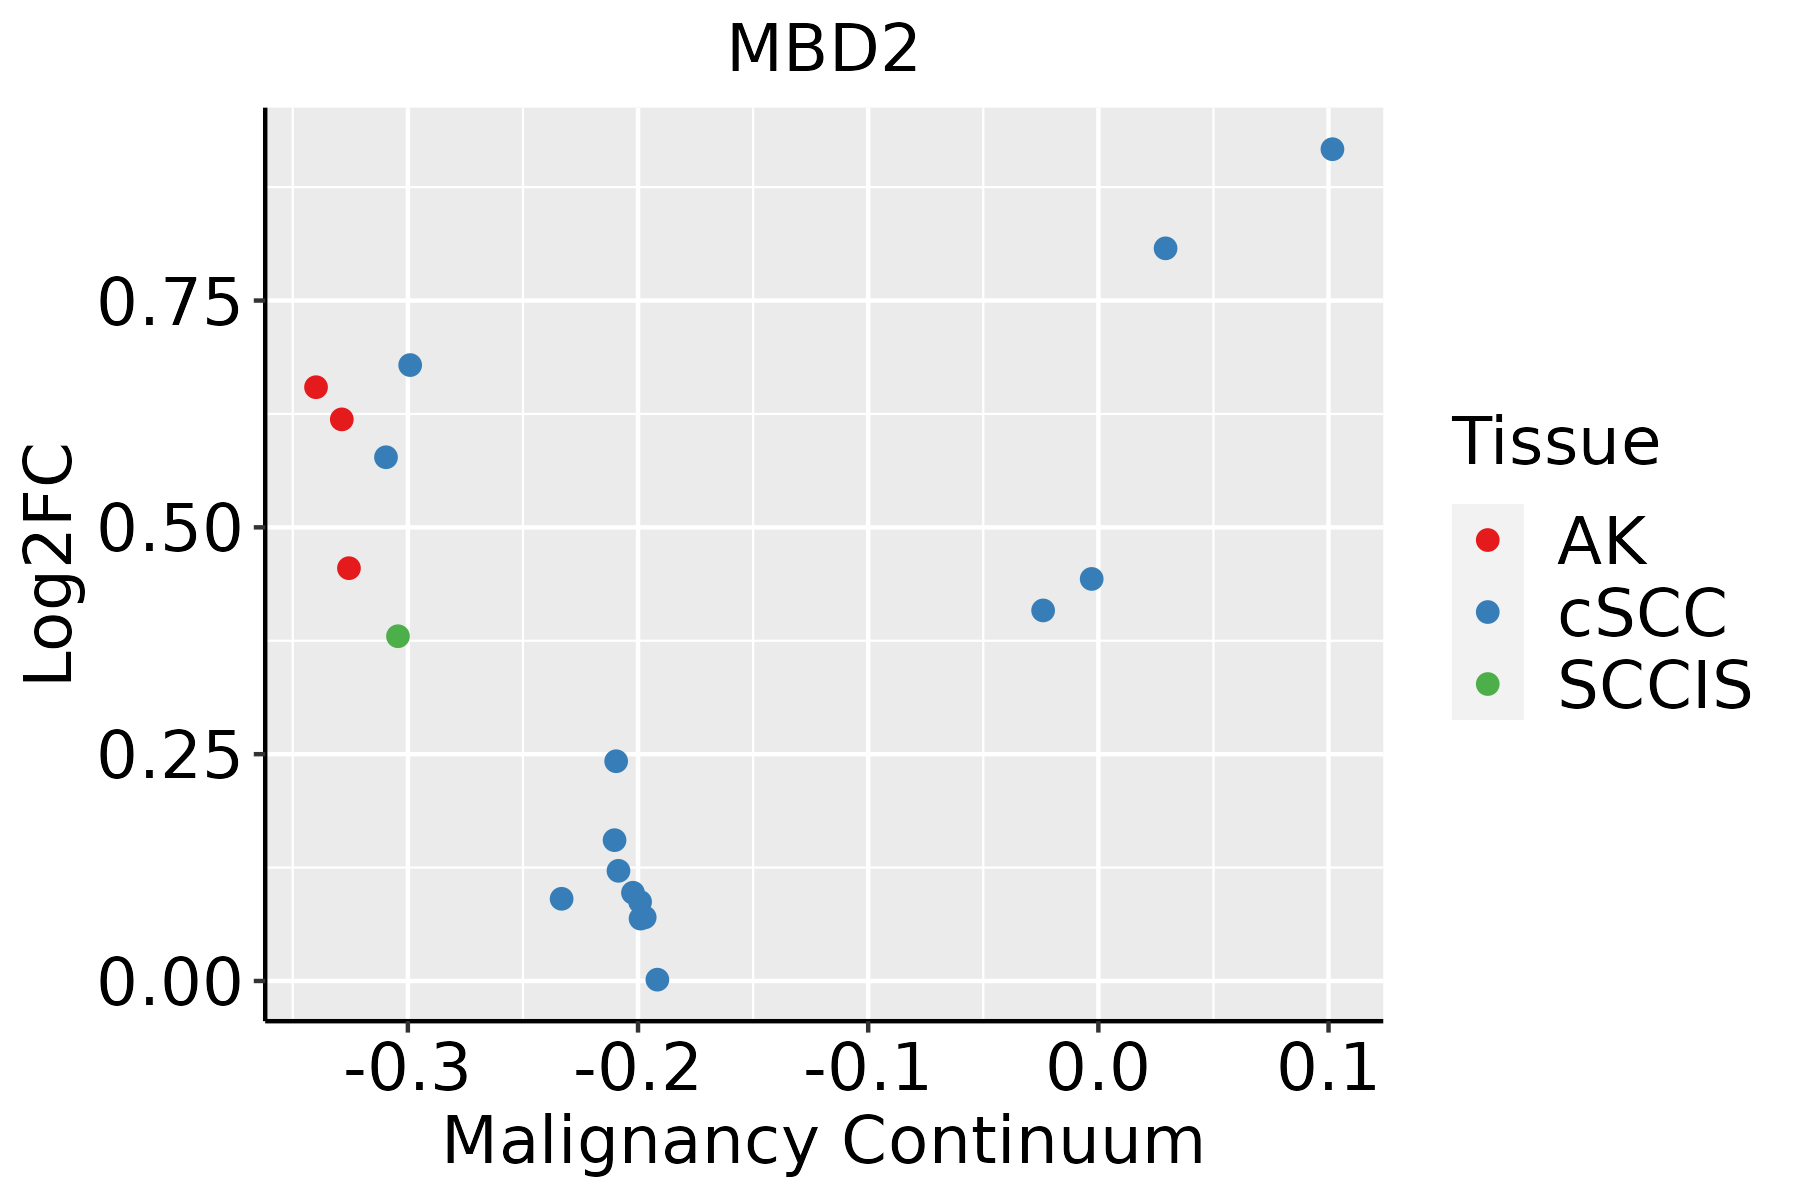 | AK: Actinic keratosis |
| cSCC: Cutaneous squamous cell carcinoma |
| SCCIS:squamous cell carcinoma in situ |
| Thyroid |  | ATC: Anaplastic thyroid cancer |
| HT: Hashimoto's thyroiditis |
| PTC: Papillary thyroid cancer |
| GO ID | Tissue | Disease Stage | Description | Gene Ratio | Bg Ratio | pvalue | p.adjust | Count |
| GO:00160557 | Cervix | CC | Wnt signaling pathway | 98/2311 | 444/18723 | 4.82e-09 | 4.65e-07 | 98 |
| GO:01987387 | Cervix | CC | cell-cell signaling by wnt | 98/2311 | 446/18723 | 6.16e-09 | 5.58e-07 | 98 |
| GO:00301117 | Cervix | CC | regulation of Wnt signaling pathway | 76/2311 | 328/18723 | 3.05e-08 | 2.08e-06 | 76 |
| GO:005109810 | Cervix | CC | regulation of binding | 80/2311 | 363/18723 | 1.32e-07 | 6.42e-06 | 80 |
| GO:00075689 | Cervix | CC | aging | 75/2311 | 339/18723 | 2.75e-07 | 1.13e-05 | 75 |
| GO:003166710 | Cervix | CC | response to nutrient levels | 92/2311 | 474/18723 | 5.80e-06 | 1.42e-04 | 92 |
| GO:005109910 | Cervix | CC | positive regulation of binding | 42/2311 | 173/18723 | 1.07e-05 | 2.33e-04 | 42 |
| GO:00096127 | Cervix | CC | response to mechanical stimulus | 48/2311 | 216/18723 | 3.23e-05 | 5.29e-04 | 48 |
| GO:00063257 | Cervix | CC | chromatin organization | 78/2311 | 409/18723 | 5.40e-05 | 8.02e-04 | 78 |
| GO:00323556 | Cervix | CC | response to estradiol | 34/2311 | 141/18723 | 8.19e-05 | 1.11e-03 | 34 |
| GO:00301776 | Cervix | CC | positive regulation of Wnt signaling pathway | 31/2311 | 140/18723 | 8.01e-04 | 7.02e-03 | 31 |
| GO:00510528 | Cervix | CC | regulation of DNA metabolic process | 65/2311 | 359/18723 | 9.25e-04 | 7.84e-03 | 65 |
| GO:00063381 | Cervix | CC | chromatin remodeling | 45/2311 | 255/18723 | 8.33e-03 | 4.30e-02 | 45 |
| GO:000961222 | Cervix | N_HPV | response to mechanical stimulus | 19/534 | 216/18723 | 1.46e-05 | 4.55e-04 | 19 |
| GO:005109815 | Cervix | N_HPV | regulation of binding | 26/534 | 363/18723 | 1.75e-05 | 5.22e-04 | 26 |
| GO:003166724 | Cervix | N_HPV | response to nutrient levels | 29/534 | 474/18723 | 1.04e-04 | 2.08e-03 | 29 |
| GO:005109915 | Cervix | N_HPV | positive regulation of binding | 15/534 | 173/18723 | 1.35e-04 | 2.55e-03 | 15 |
| GO:000756824 | Cervix | N_HPV | aging | 21/534 | 339/18723 | 7.77e-04 | 9.73e-03 | 21 |
| GO:0051098 | Colorectum | AD | regulation of binding | 126/3918 | 363/18723 | 6.01e-10 | 4.88e-08 | 126 |
| GO:0051099 | Colorectum | AD | positive regulation of binding | 66/3918 | 173/18723 | 1.47e-07 | 6.64e-06 | 66 |
| Hugo Symbol | Variant Class | Variant Classification | dbSNP RS | HGVSc | HGVSp | HGVSp Short | SWISSPROT | BIOTYPE | SIFT | PolyPhen | Tumor Sample Barcode | Tissue | Histology | Sex | Age | Stage | Therapy Types | Drugs | Outcome |
| MBD2 | deletion | Frame_Shift_Del | novel | c.904delN | p.Thr302ProfsTer86 | p.T302Pfs*86 | Q9UBB5 | protein_coding | | | TCGA-D8-A27V-01 | Breast | breast invasive carcinoma | Female | <65 | I/II | Hormone Therapy | tamoxiphen | SD |
| MBD2 | SNV | Missense_Mutation | rs780879642 | c.1207N>G | p.Ile403Val | p.I403V | Q9UBB5 | protein_coding | tolerated_low_confidence(0.15) | benign(0) | TCGA-AA-3811-01 | Colorectum | colon adenocarcinoma | Female | >=65 | III/IV | Unknown | Unknown | PD |
| MBD2 | SNV | Missense_Mutation | novel | c.530N>C | p.Val177Ala | p.V177A | Q9UBB5 | protein_coding | deleterious(0) | probably_damaging(0.959) | TCGA-AA-A010-01 | Colorectum | colon adenocarcinoma | Female | <65 | I/II | Chemotherapy | folinic | CR |
| MBD2 | SNV | Missense_Mutation | rs745860253 | c.677N>A | p.Arg226Gln | p.R226Q | Q9UBB5 | protein_coding | tolerated(0.18) | benign(0.372) | TCGA-AG-3892-01 | Colorectum | rectum adenocarcinoma | Female | <65 | I/II | Unknown | Unknown | SD |
| MBD2 | SNV | Missense_Mutation | novel | c.836N>A | p.Arg279His | p.R279H | Q9UBB5 | protein_coding | tolerated(0.08) | benign(0.16) | TCGA-AJ-A3EK-01 | Endometrium | uterine corpus endometrioid carcinoma | Female | <65 | I/II | Chemotherapy | carboplatin | CR |
| MBD2 | SNV | Missense_Mutation | | c.1190N>G | p.Asp397Gly | p.D397G | Q9UBB5 | protein_coding | deleterious_low_confidence(0.02) | benign(0.374) | TCGA-AP-A051-01 | Endometrium | uterine corpus endometrioid carcinoma | Female | >=65 | I/II | Unknown | Unknown | SD |
| MBD2 | SNV | Missense_Mutation | novel | c.781N>C | p.Asn261His | p.N261H | Q9UBB5 | protein_coding | deleterious(0.03) | benign(0.41) | TCGA-AP-A1DV-01 | Endometrium | uterine corpus endometrioid carcinoma | Female | <65 | I/II | Unknown | Unknown | SD |
| MBD2 | SNV | Missense_Mutation | novel | c.1201A>C | p.Met401Leu | p.M401L | Q9UBB5 | protein_coding | tolerated_low_confidence(0.26) | benign(0) | TCGA-AX-A05Z-01 | Endometrium | uterine corpus endometrioid carcinoma | Female | <65 | III/IV | Chemotherapy | adriamycin | SD |
| MBD2 | SNV | Missense_Mutation | novel | c.1081N>T | p.Ala361Ser | p.A361S | Q9UBB5 | protein_coding | tolerated(0.09) | benign(0.326) | TCGA-AX-A06F-01 | Endometrium | uterine corpus endometrioid carcinoma | Female | <65 | III/IV | Chemotherapy | carboplatin | SD |
| MBD2 | SNV | Missense_Mutation | rs745860253 | c.677G>A | p.Arg226Gln | p.R226Q | Q9UBB5 | protein_coding | tolerated(0.18) | benign(0.372) | TCGA-AX-A2HC-01 | Endometrium | uterine corpus endometrioid carcinoma | Female | <65 | III/IV | Chemotherapy | paclitaxel | PD |


