| Tissue | Expression Dynamics | Abbreviation |
| Cervix | 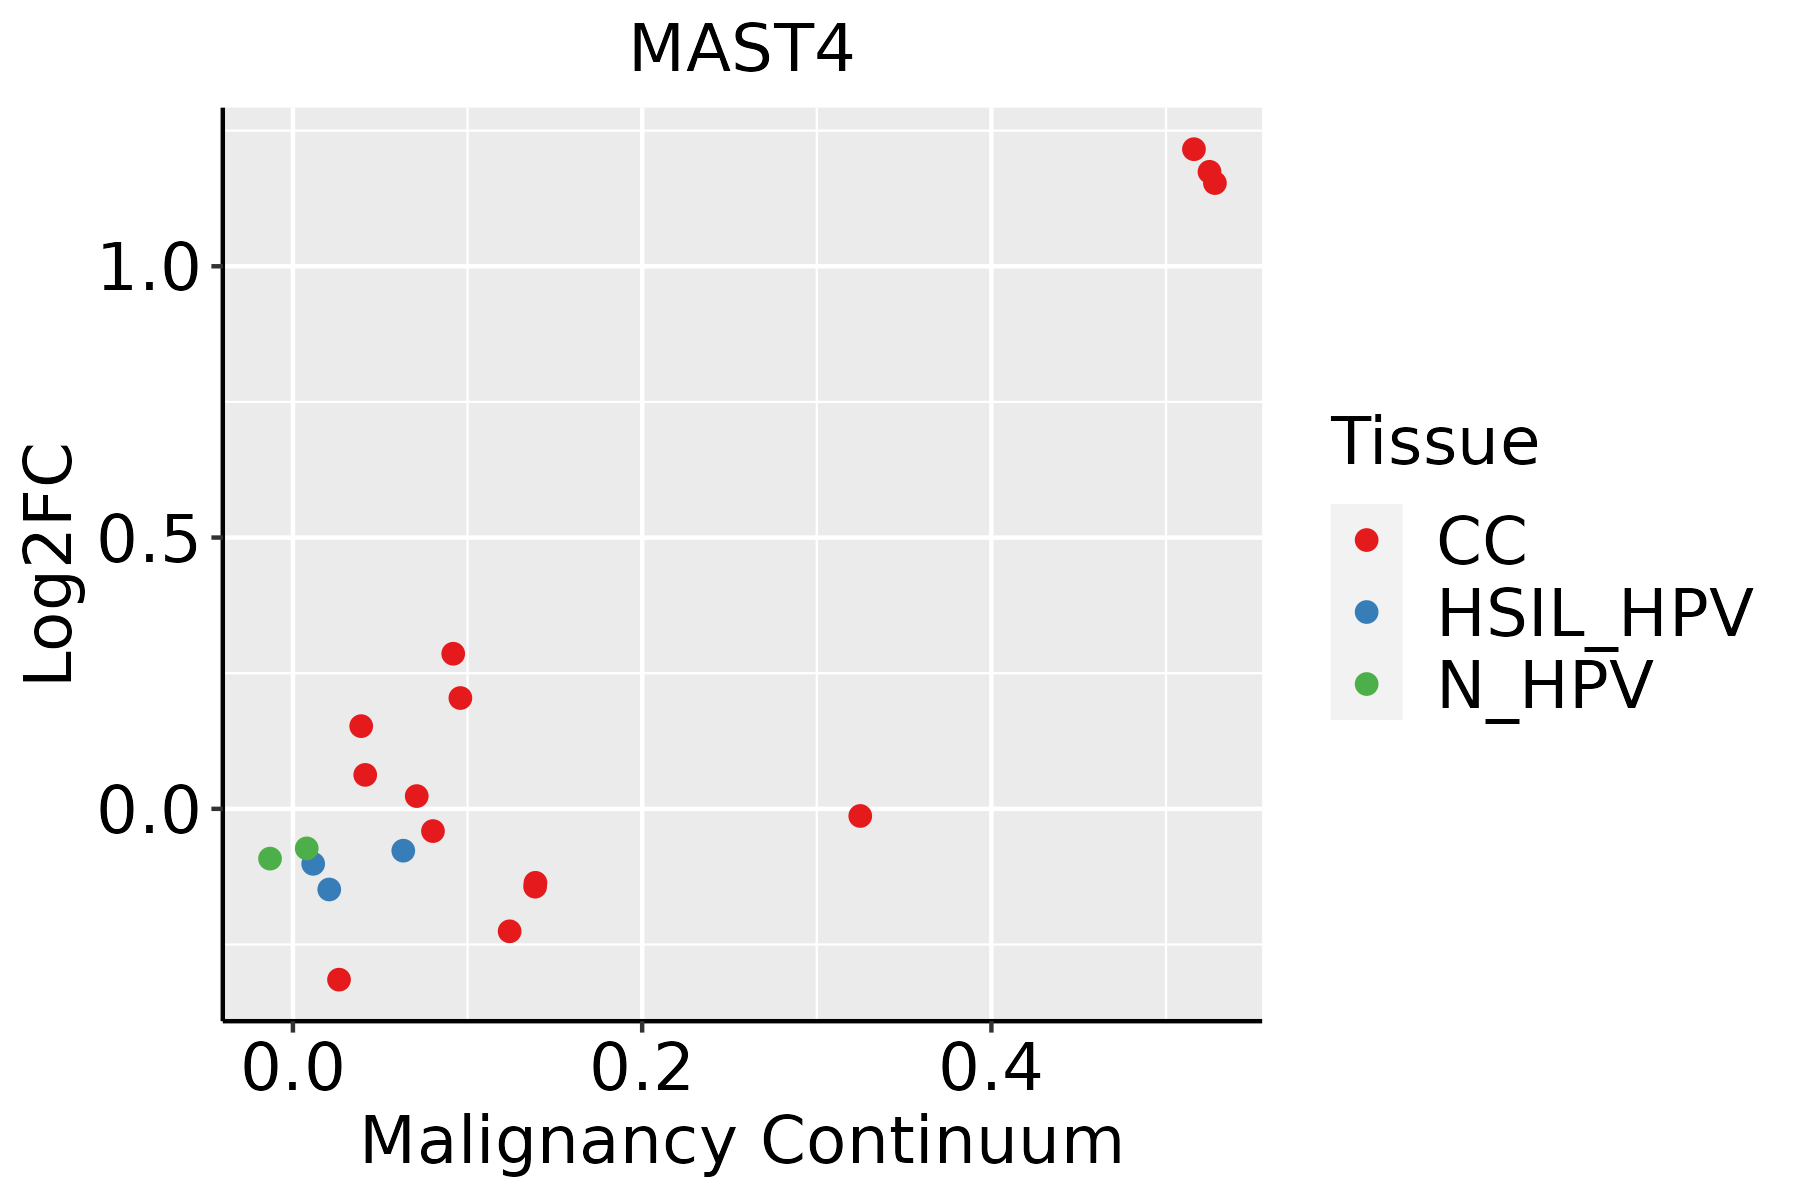 | CC: Cervix cancer |
| HSIL_HPV: HPV-infected high-grade squamous intraepithelial lesions |
| N_HPV: HPV-infected normal cervix |
| Endometrium | 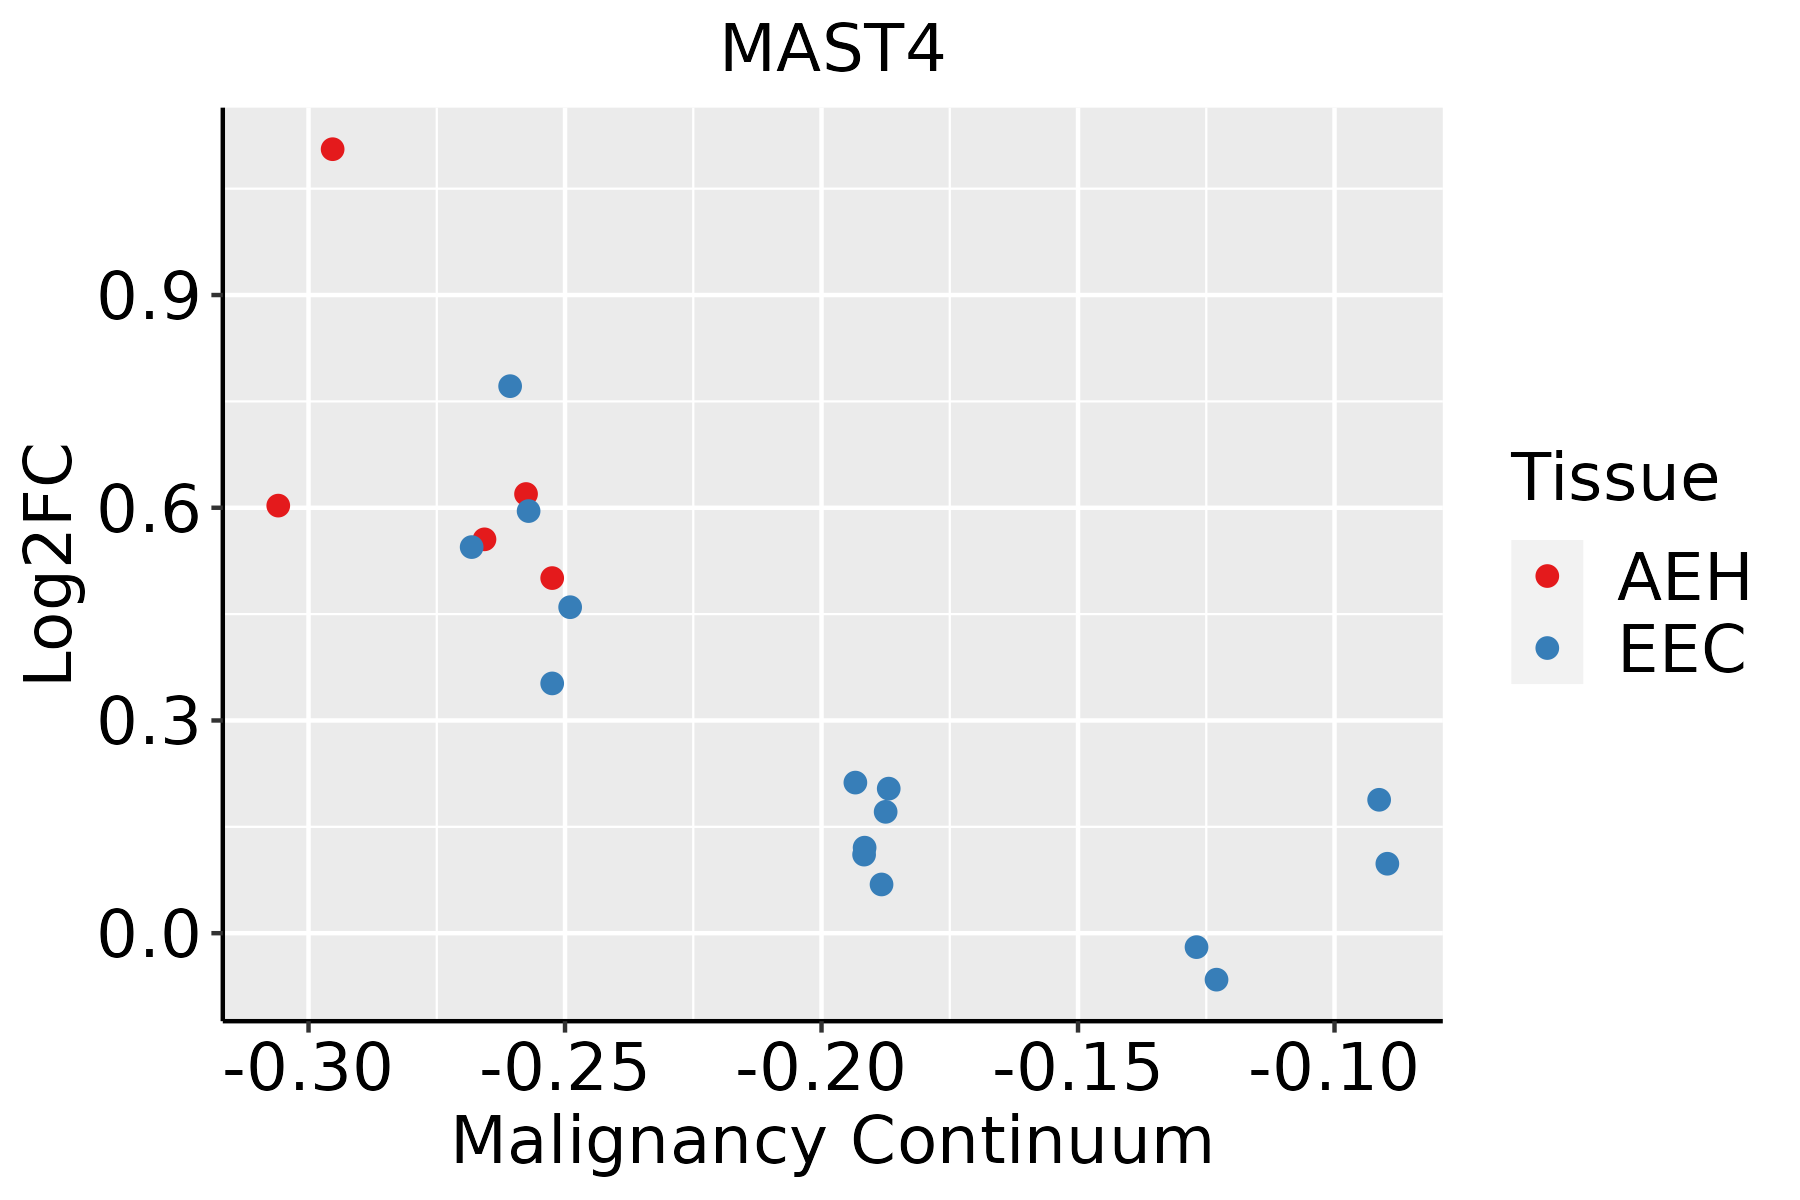 | AEH: Atypical endometrial hyperplasia |
| EEC: Endometrioid Cancer |
| Esophagus | 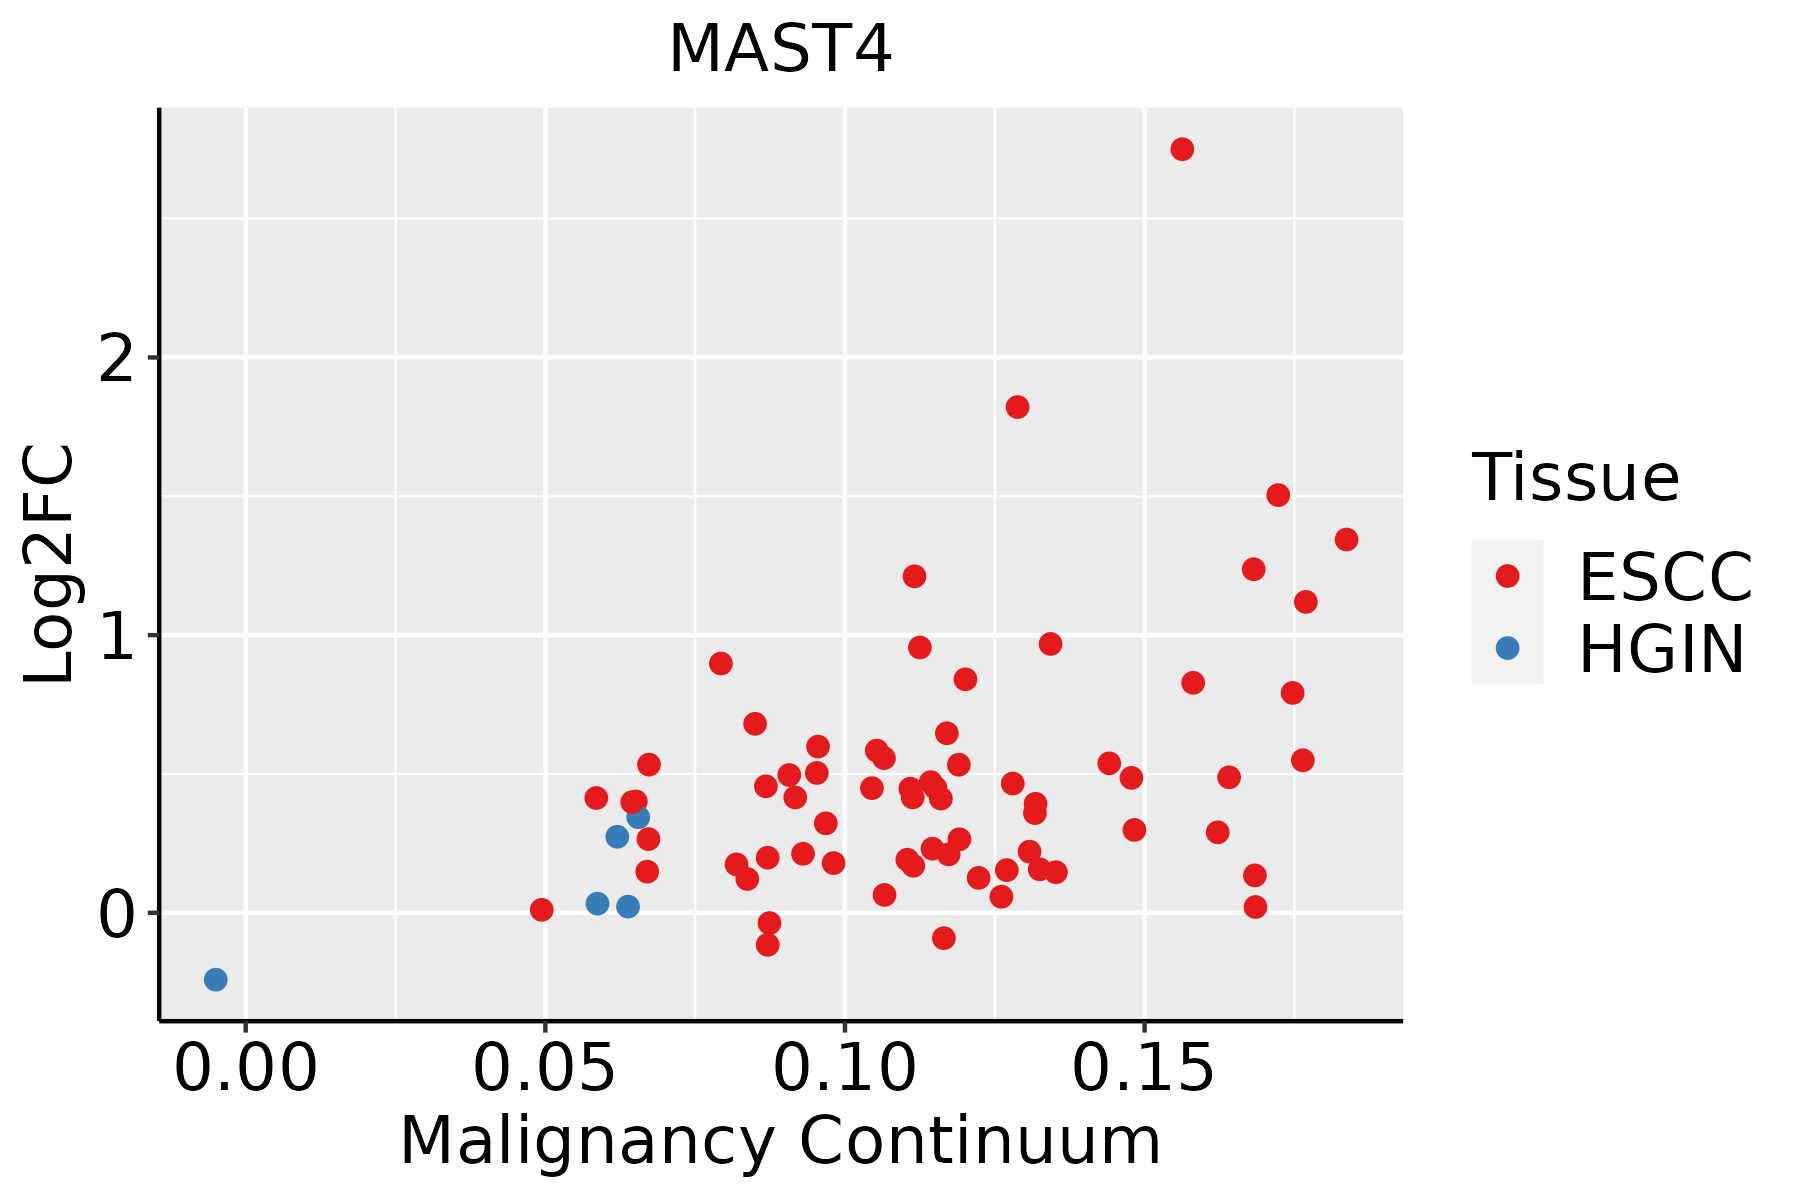 | ESCC: Esophageal squamous cell carcinoma |
| HGIN: High-grade intraepithelial neoplasias |
| LGIN: Low-grade intraepithelial neoplasias |
| Liver | 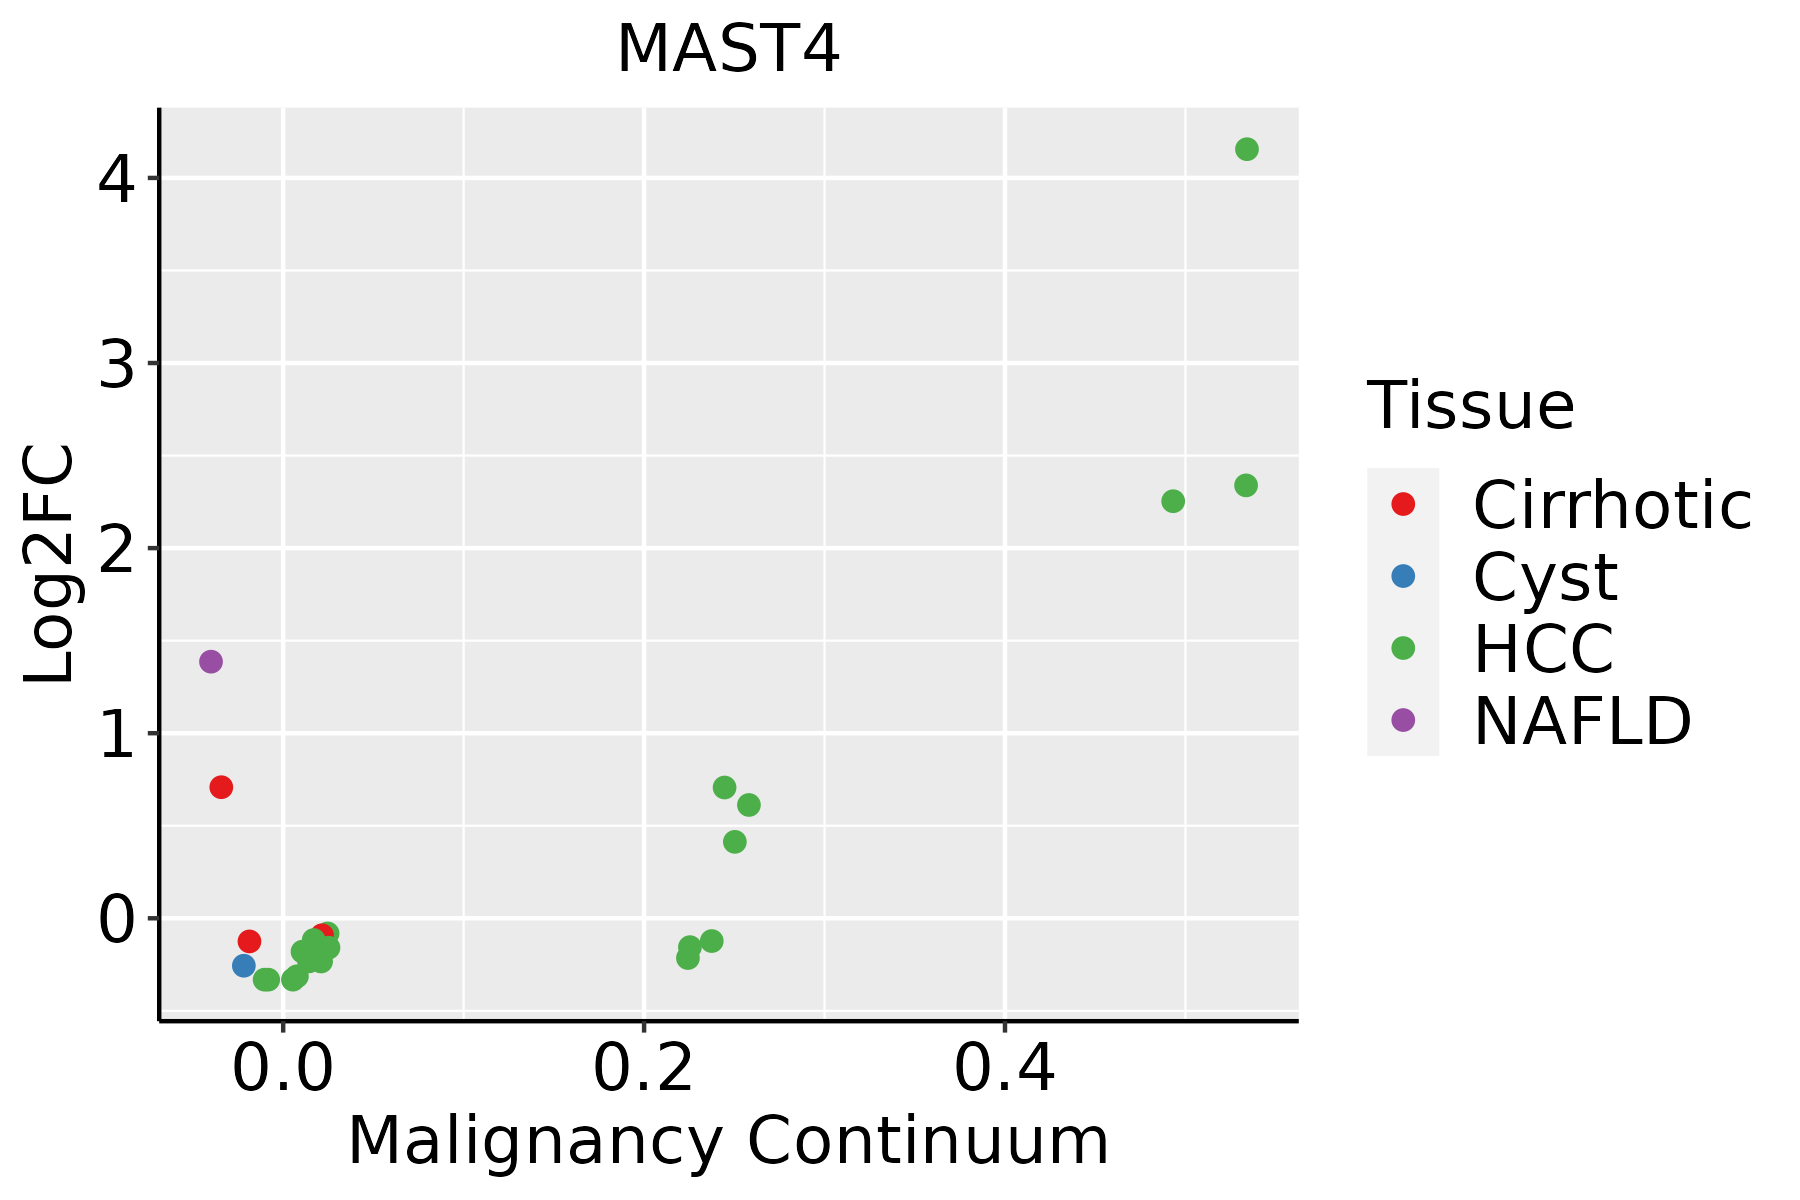 | HCC: Hepatocellular carcinoma |
| NAFLD: Non-alcoholic fatty liver disease |
| Lung | 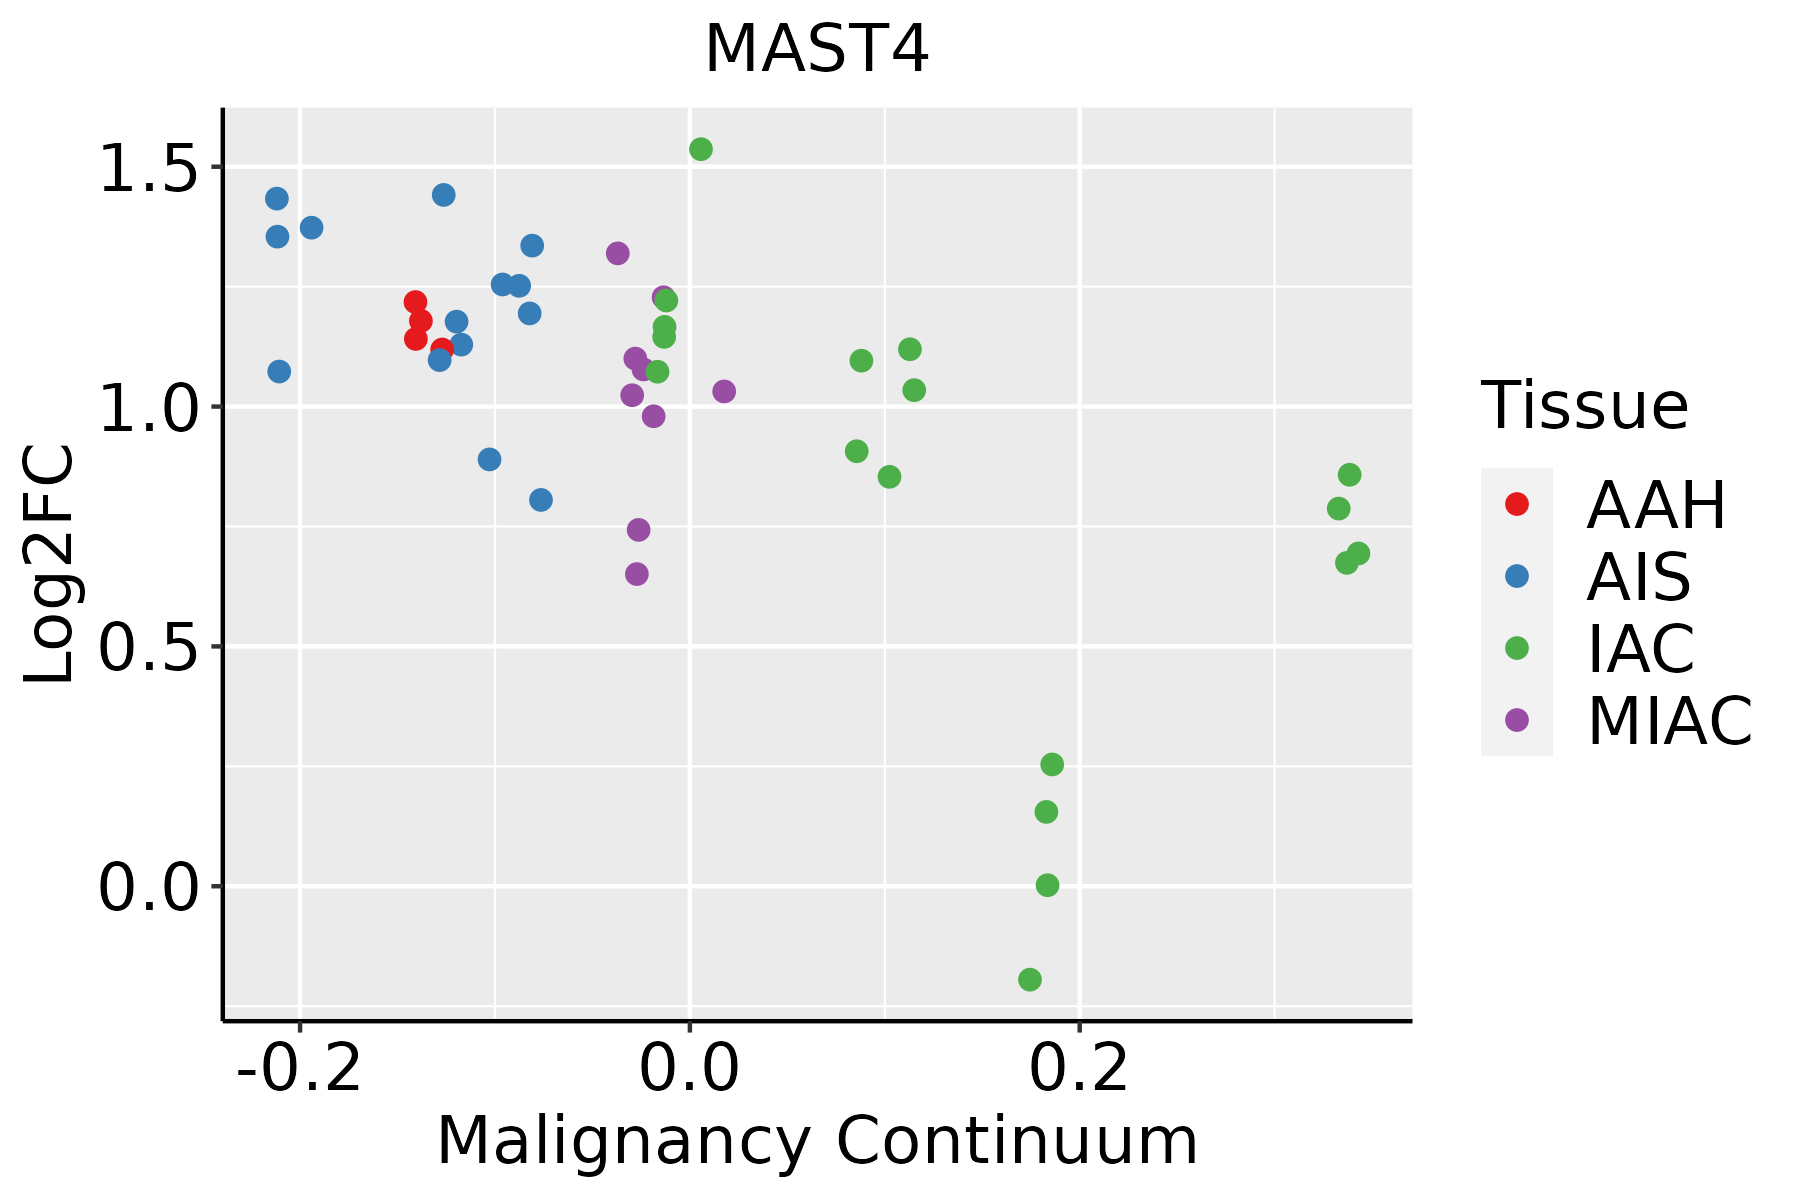 | AAH: Atypical adenomatous hyperplasia |
| AIS: Adenocarcinoma in situ |
| IAC: Invasive lung adenocarcinoma |
| MIA: Minimally invasive adenocarcinoma |
| Oral Cavity | 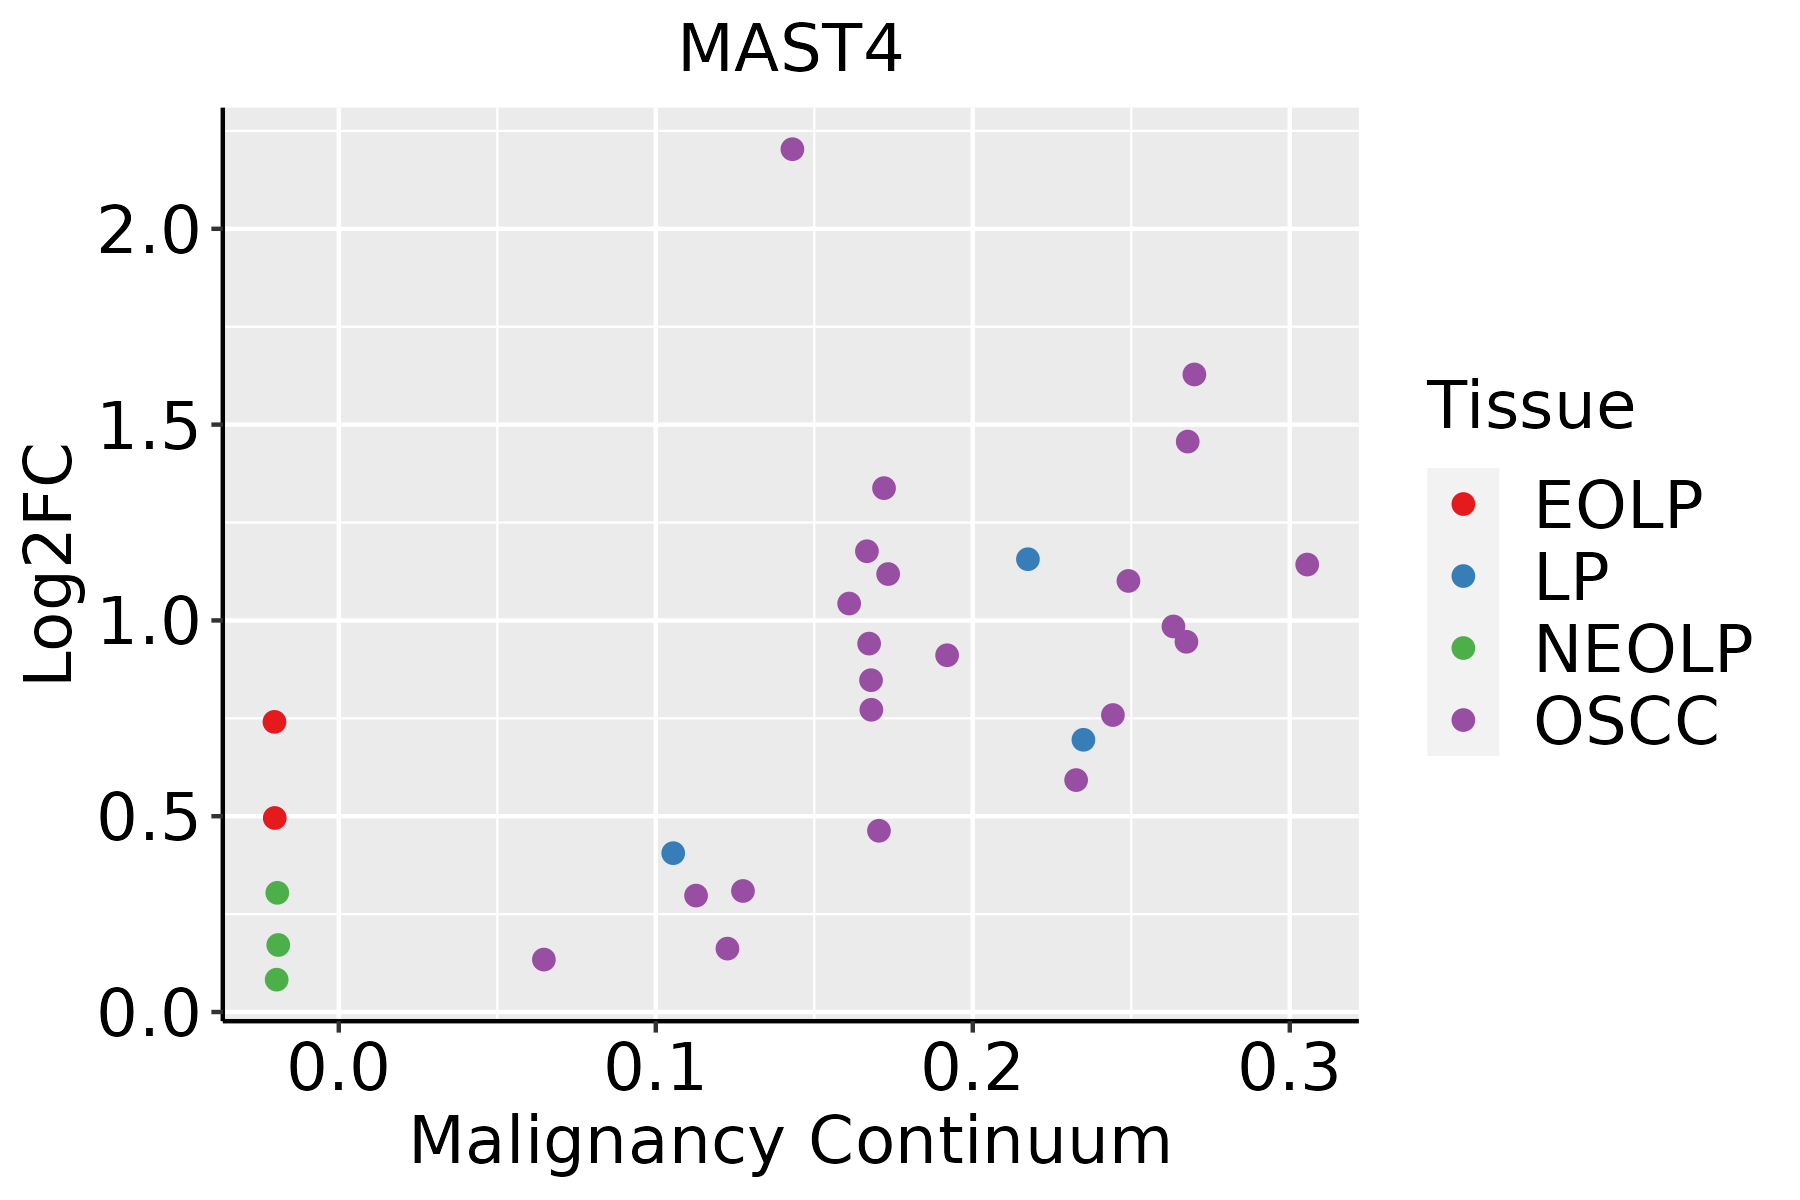 | EOLP: Erosive Oral lichen planus |
| LP: leukoplakia |
| NEOLP: Non-erosive oral lichen planus |
| OSCC: Oral squamous cell carcinoma |
| Prostate | 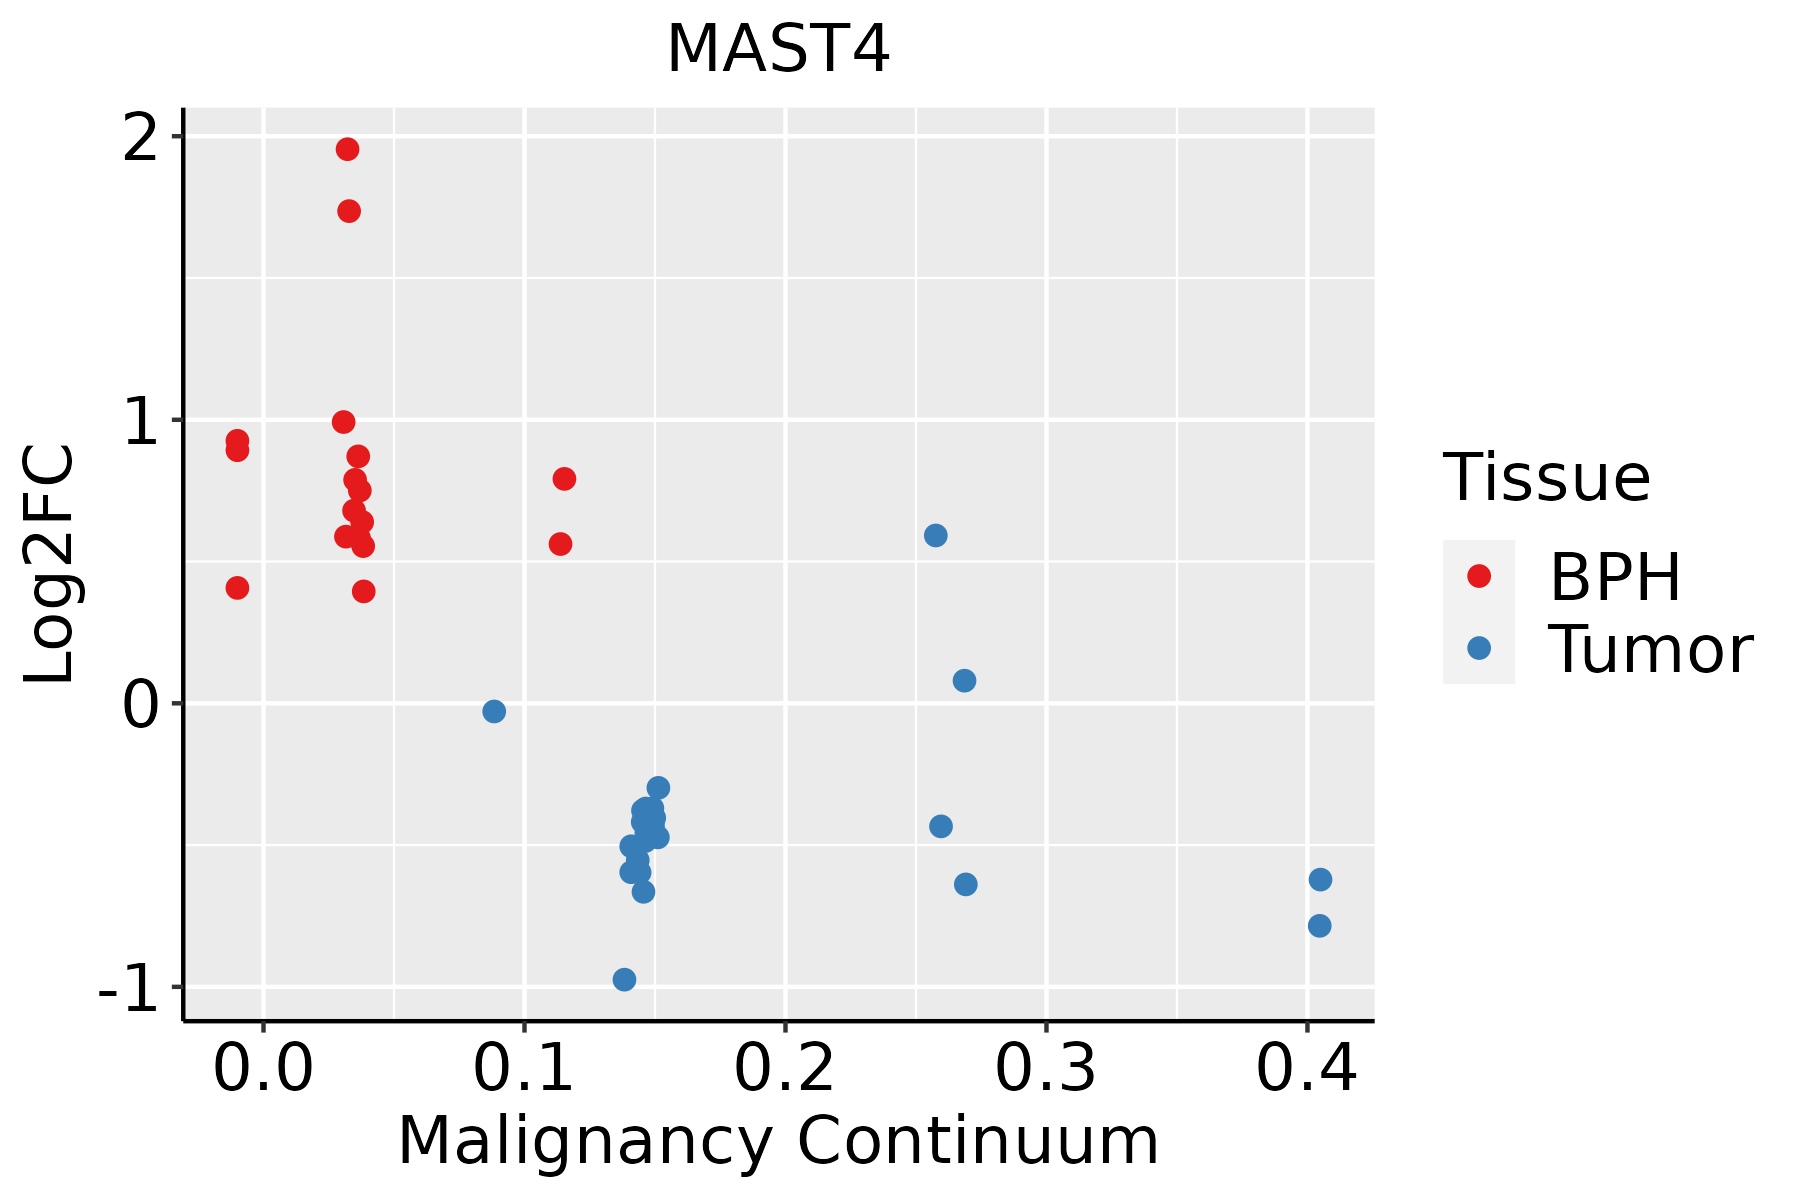 | BPH: Benign Prostatic Hyperplasia |
| Skin |  | AK: Actinic keratosis |
| cSCC: Cutaneous squamous cell carcinoma |
| SCCIS:squamous cell carcinoma in situ |
| Thyroid |  | ATC: Anaplastic thyroid cancer |
| HT: Hashimoto's thyroiditis |
| PTC: Papillary thyroid cancer |
| GO ID | Tissue | Disease Stage | Description | Gene Ratio | Bg Ratio | pvalue | p.adjust | Count |
| GO:00181057 | Cervix | CC | peptidyl-serine phosphorylation | 63/2311 | 315/18723 | 6.65e-05 | 9.47e-04 | 63 |
| GO:00182096 | Cervix | CC | peptidyl-serine modification | 66/2311 | 338/18723 | 9.58e-05 | 1.25e-03 | 66 |
| GO:00181058 | Endometrium | AEH | peptidyl-serine phosphorylation | 50/2100 | 315/18723 | 7.20e-03 | 4.13e-02 | 50 |
| GO:00182099 | Esophagus | ESCC | peptidyl-serine modification | 196/8552 | 338/18723 | 3.07e-06 | 3.47e-05 | 196 |
| GO:001810515 | Esophagus | ESCC | peptidyl-serine phosphorylation | 184/8552 | 315/18723 | 3.22e-06 | 3.61e-05 | 184 |
| GO:00181055 | Liver | NAFLD | peptidyl-serine phosphorylation | 63/1882 | 315/18723 | 7.45e-08 | 6.60e-06 | 63 |
| GO:00182094 | Liver | NAFLD | peptidyl-serine modification | 64/1882 | 338/18723 | 4.65e-07 | 2.89e-05 | 64 |
| GO:001810511 | Liver | HCC | peptidyl-serine phosphorylation | 169/7958 | 315/18723 | 3.86e-05 | 3.81e-04 | 169 |
| GO:001820911 | Liver | HCC | peptidyl-serine modification | 177/7958 | 338/18723 | 1.45e-04 | 1.17e-03 | 177 |
| GO:00181056 | Lung | IAC | peptidyl-serine phosphorylation | 69/2061 | 315/18723 | 1.48e-08 | 1.87e-06 | 69 |
| GO:00182095 | Lung | IAC | peptidyl-serine modification | 70/2061 | 338/18723 | 1.23e-07 | 1.10e-05 | 70 |
| GO:001810512 | Lung | AIS | peptidyl-serine phosphorylation | 60/1849 | 315/18723 | 4.75e-07 | 3.64e-05 | 60 |
| GO:001820912 | Lung | AIS | peptidyl-serine modification | 61/1849 | 338/18723 | 2.49e-06 | 1.41e-04 | 61 |
| GO:001810521 | Lung | MIAC | peptidyl-serine phosphorylation | 37/967 | 315/18723 | 2.73e-06 | 3.12e-04 | 37 |
| GO:001820921 | Lung | MIAC | peptidyl-serine modification | 37/967 | 338/18723 | 1.38e-05 | 9.86e-04 | 37 |
| GO:00182098 | Oral cavity | OSCC | peptidyl-serine modification | 175/7305 | 338/18723 | 1.09e-06 | 1.46e-05 | 175 |
| GO:001810510 | Oral cavity | OSCC | peptidyl-serine phosphorylation | 164/7305 | 315/18723 | 1.51e-06 | 1.99e-05 | 164 |
| GO:001810514 | Oral cavity | EOLP | peptidyl-serine phosphorylation | 84/2218 | 315/18723 | 3.32e-13 | 1.05e-10 | 84 |
| GO:001820914 | Oral cavity | EOLP | peptidyl-serine modification | 87/2218 | 338/18723 | 1.07e-12 | 2.46e-10 | 87 |
| GO:001810522 | Oral cavity | NEOLP | peptidyl-serine phosphorylation | 70/2005 | 315/18723 | 1.97e-09 | 1.24e-07 | 70 |
| Hugo Symbol | Variant Class | Variant Classification | dbSNP RS | HGVSc | HGVSp | HGVSp Short | SWISSPROT | BIOTYPE | SIFT | PolyPhen | Tumor Sample Barcode | Tissue | Histology | Sex | Age | Stage | Therapy Types | Drugs | Outcome |
| MAST4 | SNV | Missense_Mutation | | c.976N>G | p.His326Asp | p.H326D | | protein_coding | deleterious(0) | probably_damaging(1) | TCGA-A2-A0SY-01 | Breast | breast invasive carcinoma | Female | <65 | III/IV | Hormone Therapy | arimidex | SD |
| MAST4 | SNV | Missense_Mutation | novel | c.6466A>C | p.Ser2156Arg | p.S2156R | | protein_coding | tolerated_low_confidence(0.05) | benign(0.029) | TCGA-A8-A06O-01 | Breast | breast invasive carcinoma | Female | <65 | I/II | Hormone Therapy | letrozole | SD |
| MAST4 | SNV | Missense_Mutation | novel | c.1999N>A | p.Val667Ile | p.V667I | | protein_coding | deleterious(0) | probably_damaging(0.999) | TCGA-A8-A085-01 | Breast | breast invasive carcinoma | Male | <65 | I/II | Hormone Therapy | tamoxiphen | SD |
| MAST4 | SNV | Missense_Mutation | | c.1279N>C | p.Asp427His | p.D427H | | protein_coding | deleterious(0.01) | probably_damaging(0.998) | TCGA-AC-A23H-01 | Breast | breast invasive carcinoma | Female | >=65 | I/II | Unknown | Unknown | PD |
| MAST4 | SNV | Missense_Mutation | novel | c.4880N>T | p.Ala1627Val | p.A1627V | | protein_coding | tolerated_low_confidence(0.28) | benign(0.003) | TCGA-AC-A8OQ-01 | Breast | breast invasive carcinoma | Female | >=65 | I/II | Unknown | Unknown | SD |
| MAST4 | SNV | Missense_Mutation | | c.2599N>A | p.Asp867Asn | p.D867N | | protein_coding | deleterious(0) | probably_damaging(1) | TCGA-AN-A0FZ-01 | Breast | breast invasive carcinoma | Female | <65 | III/IV | Unknown | Unknown | SD |
| MAST4 | SNV | Missense_Mutation | | c.2614N>A | p.Asp872Asn | p.D872N | | protein_coding | deleterious(0) | probably_damaging(1) | TCGA-AO-A0J9-01 | Breast | breast invasive carcinoma | Female | <65 | III/IV | Chemotherapy | cyclophosphamide | PD |
| MAST4 | SNV | Missense_Mutation | | c.2416N>A | p.Asp806Asn | p.D806N | | protein_coding | deleterious(0.03) | probably_damaging(0.975) | TCGA-AR-A1AO-01 | Breast | breast invasive carcinoma | Female | <65 | I/II | Chemotherapy | doxorubicin | SD |
| MAST4 | SNV | Missense_Mutation | | c.626N>T | p.Ser209Leu | p.S209L | | protein_coding | deleterious_low_confidence(0.02) | benign(0.007) | TCGA-BH-A18P-01 | Breast | breast invasive carcinoma | Female | <65 | I/II | Unknown | Unknown | PD |
| MAST4 | SNV | Missense_Mutation | | c.1102G>A | p.Glu368Lys | p.E368K | | protein_coding | deleterious(0) | probably_damaging(0.999) | TCGA-D8-A1J9-01 | Breast | breast invasive carcinoma | Female | <65 | I/II | Unknown | Unknown | SD |


