
|
|||||
|
 | |
| |
| |
| |
| |
| |
|
Gene: MARCH3 |
Gene summary for MARCH3 |
| Gene information | Species | Human | Gene symbol | MARCH3 | Gene ID | 115123 |
| Gene name | membrane associated ring-CH-type finger 3 | |
| Gene Alias | MARCH-III | |
| Cytomap | 5q23.2 | |
| Gene Type | protein-coding | GO ID | GO:0006464 | UniProtAcc | Q86UD3 |
Top |
Malignant transformation analysis |
| Identification of the aberrant gene expression in precancerous and cancerous lesions by comparing the gene expression of stem-like cells in diseased tissues with normal stem cells |
| Entrez ID | Symbol | Replicates | Species | Organ | Tissue | Adj P-value | Log2FC | Malignancy |
| 115123 | MARCH3 | C38 | Human | Oral cavity | OSCC | 4.08e-02 | 5.24e-01 | 0.172 |
| 115123 | MARCH3 | C57 | Human | Oral cavity | OSCC | 4.83e-02 | -1.42e-02 | 0.1679 |
| 115123 | MARCH3 | C08 | Human | Oral cavity | OSCC | 1.04e-02 | 8.92e-02 | 0.1919 |
| 115123 | MARCH3 | LN22 | Human | Oral cavity | OSCC | 1.25e-03 | 2.60e-01 | 0.1733 |
| 115123 | MARCH3 | EOLP-1 | Human | Oral cavity | EOLP | 8.99e-07 | 3.85e-01 | -0.0202 |
| 115123 | MARCH3 | EOLP-2 | Human | Oral cavity | EOLP | 6.21e-11 | 5.22e-01 | -0.0203 |
| 115123 | MARCH3 | NEOLP-1 | Human | Oral cavity | NEOLP | 5.83e-05 | 4.33e-01 | -0.0194 |
| 115123 | MARCH3 | NEOLP-2 | Human | Oral cavity | NEOLP | 2.67e-05 | 2.66e-01 | -0.0196 |
| 115123 | MARCH3 | NEOLP-3 | Human | Oral cavity | NEOLP | 1.90e-04 | 2.64e-01 | -0.0191 |
| 115123 | MARCH3 | SYSMH1 | Human | Oral cavity | OSCC | 3.09e-07 | -4.08e-03 | 0.1127 |
| 115123 | MARCH3 | SYSMH6 | Human | Oral cavity | OSCC | 1.72e-02 | 6.00e-02 | 0.1275 |
| 115123 | MARCH3 | HTA12-15-2 | Human | Pancreas | PDAC | 4.47e-05 | 3.36e-01 | 0.2315 |
| 115123 | MARCH3 | HTA12-18-3 | Human | Pancreas | PDAC | 4.07e-03 | 5.01e-01 | 0.0716 |
| 115123 | MARCH3 | HTA12-25-1 | Human | Pancreas | PDAC | 3.33e-07 | 6.31e-01 | 0.313 |
| 115123 | MARCH3 | HTA12-26-1 | Human | Pancreas | PDAC | 9.18e-12 | 5.78e-01 | 0.3728 |
| 115123 | MARCH3 | HTA12-29-1 | Human | Pancreas | PDAC | 6.81e-17 | 4.54e-01 | 0.3722 |
| 115123 | MARCH3 | HTA12-30-1 | Human | Pancreas | PDAC | 1.14e-02 | 7.87e-01 | 0.3671 |
| 115123 | MARCH3 | HTA12-9-1 | Human | Pancreas | PDAC | 1.32e-03 | 3.70e-01 | 0.1532 |
| 115123 | MARCH3 | HTA12-9-2 | Human | Pancreas | PDAC | 1.65e-02 | 2.31e-01 | 0.0835 |
| 115123 | MARCH3 | Pat01-B | Human | Stomach | GC | 2.60e-35 | 6.93e-01 | 0.5754 |
| Page: 1 2 3 4 5 6 7 8 |
| Tissue | Expression Dynamics | Abbreviation |
| Colorectum (GSE201348) | 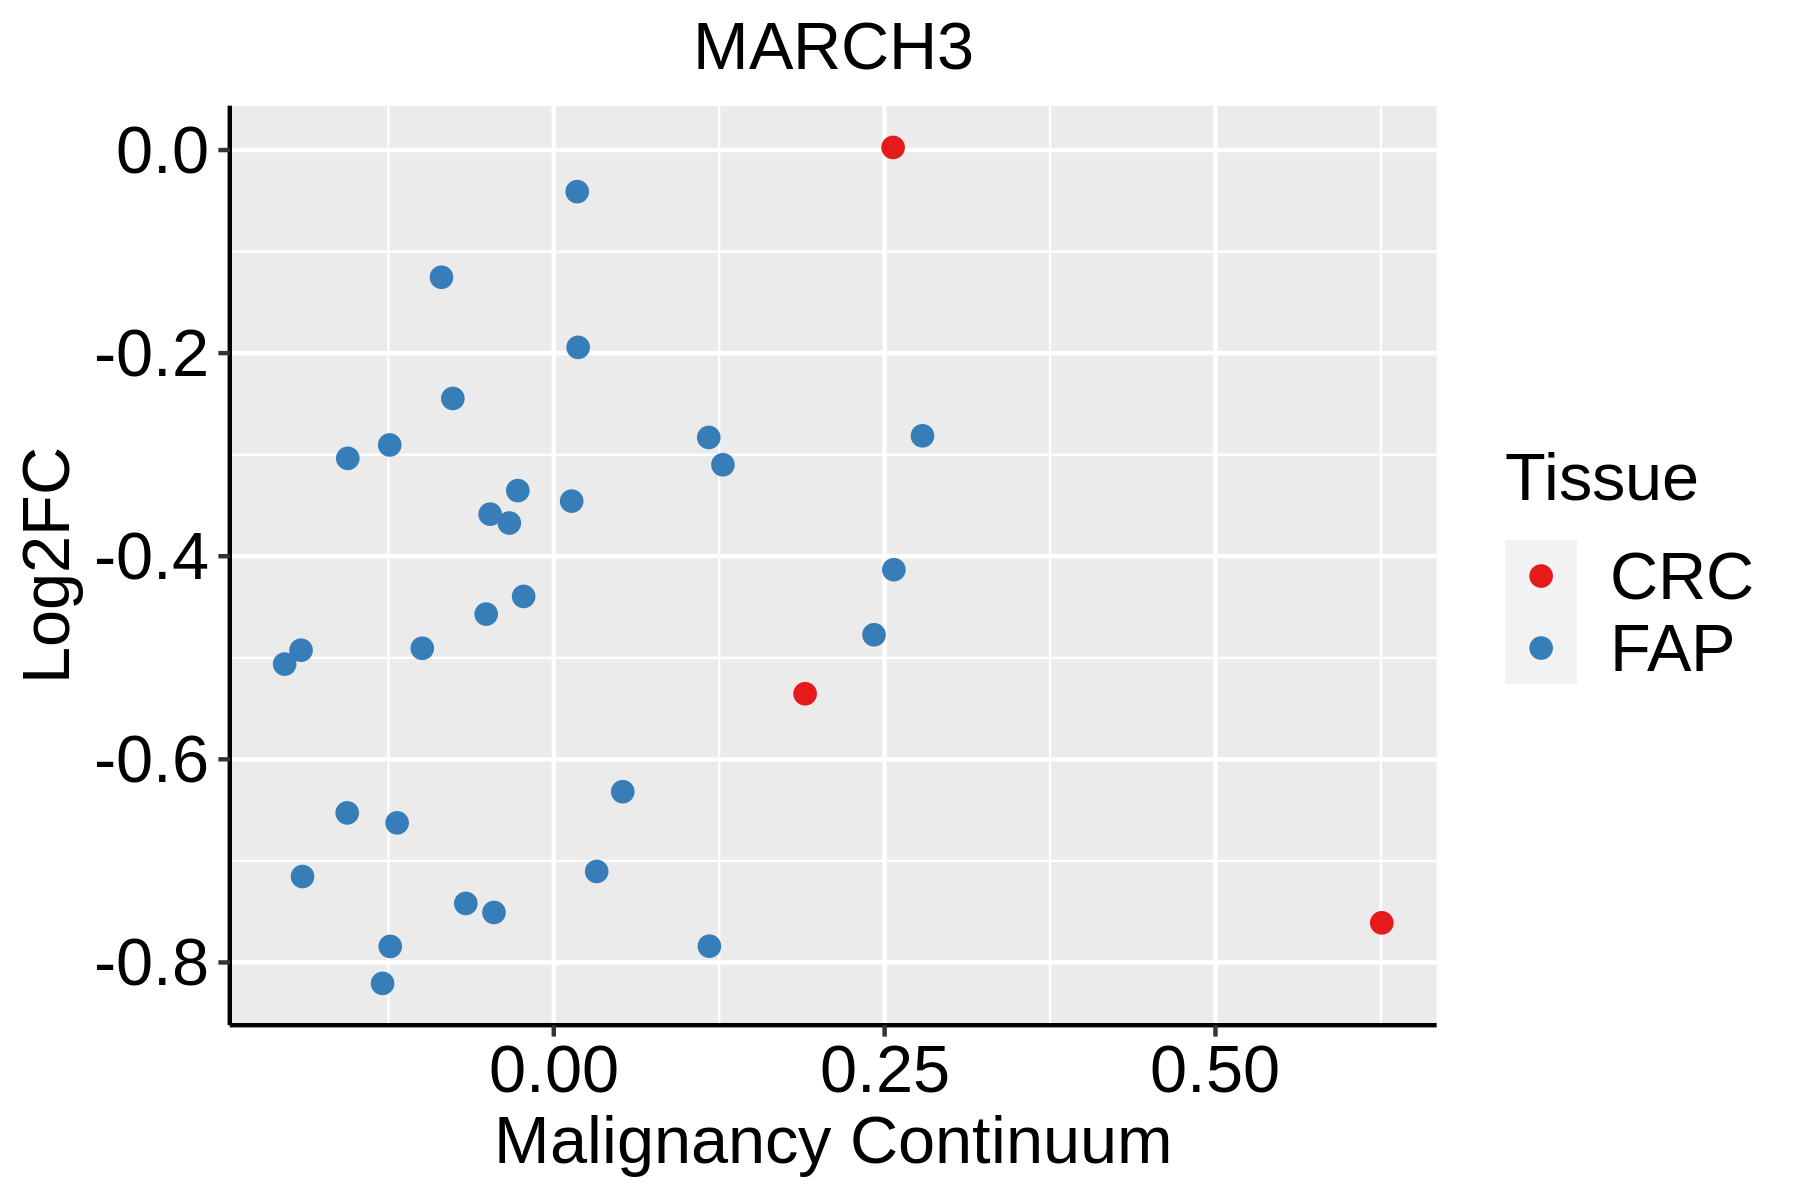 | FAP: Familial adenomatous polyposis |
| CRC: Colorectal cancer | ||
| Colorectum (HTA11) |  | AD: Adenomas |
| SER: Sessile serrated lesions | ||
| MSI-H: Microsatellite-high colorectal cancer | ||
| MSS: Microsatellite stable colorectal cancer | ||
| Esophagus |  | ESCC: Esophageal squamous cell carcinoma |
| HGIN: High-grade intraepithelial neoplasias | ||
| LGIN: Low-grade intraepithelial neoplasias | ||
| GC | 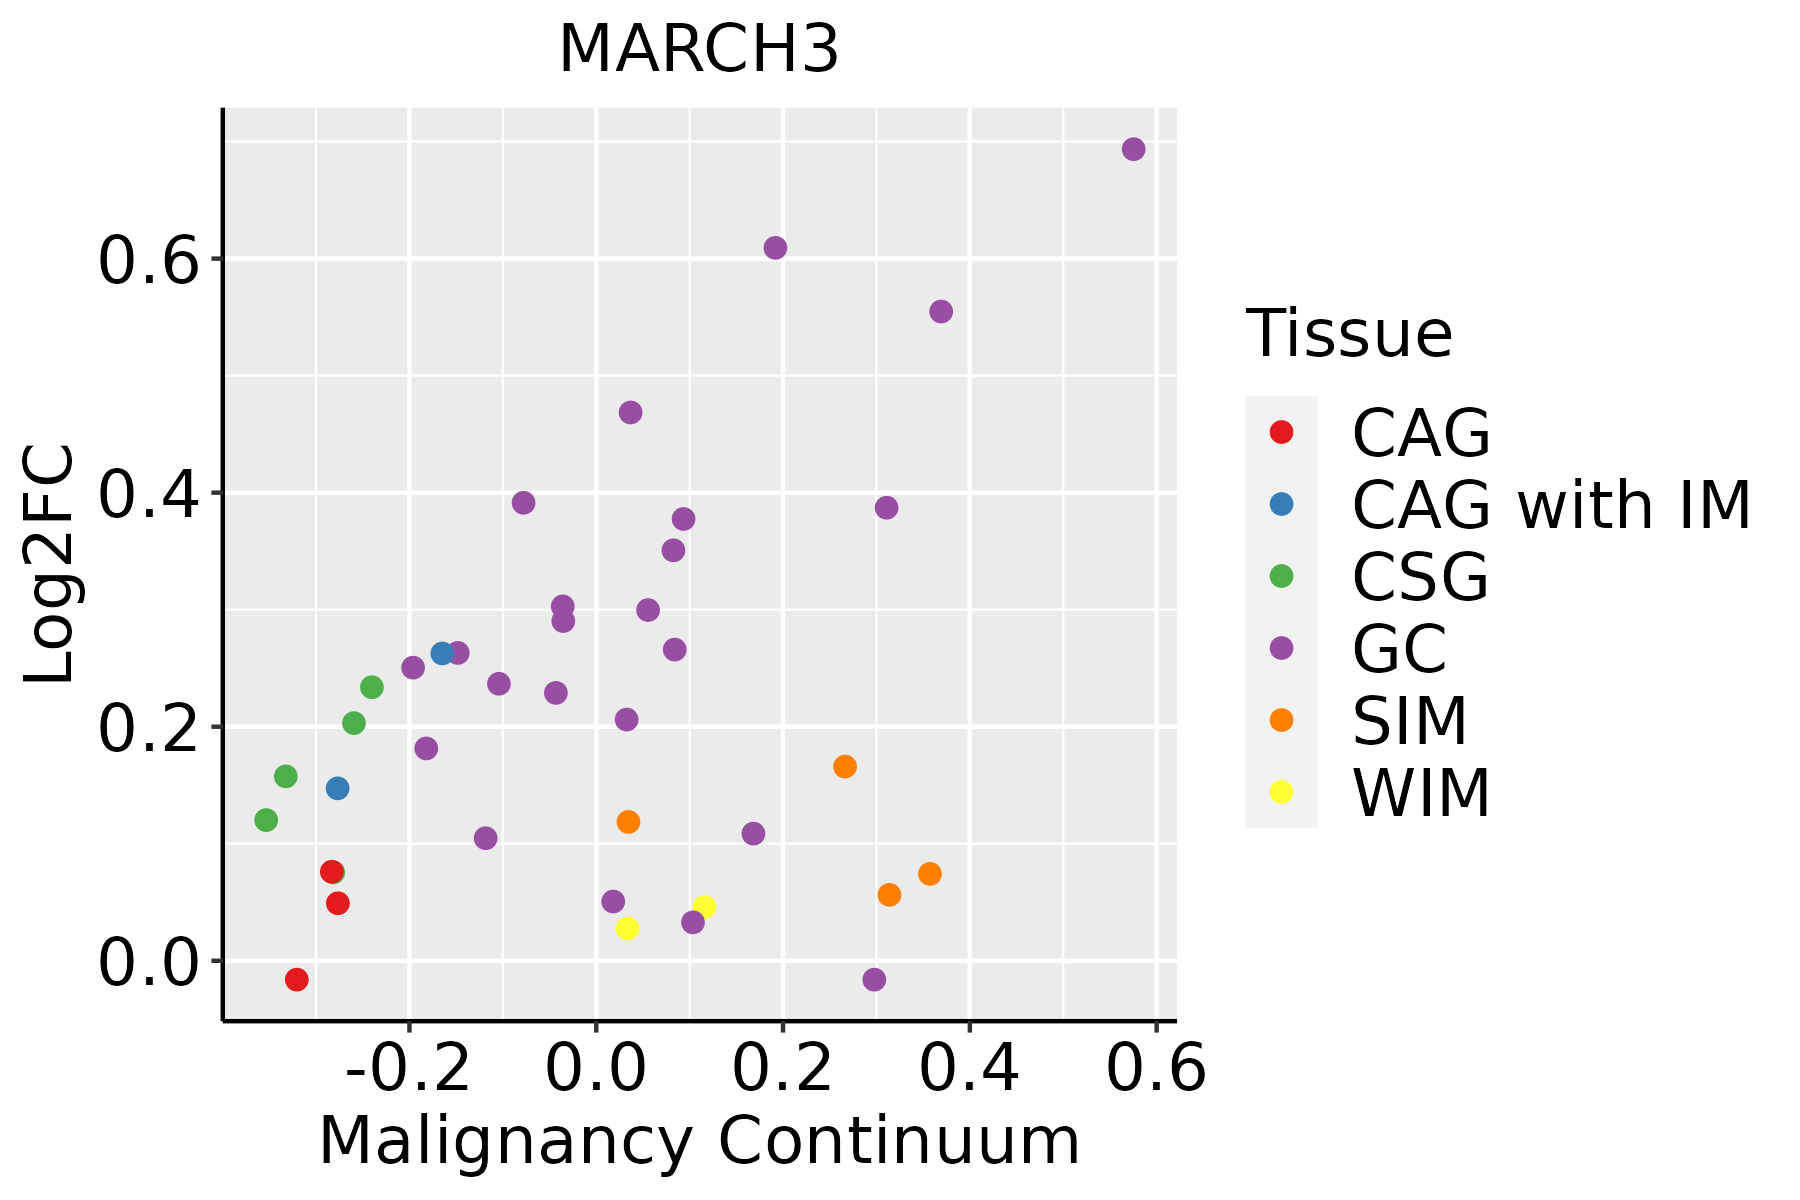 | CAG: Chronic atrophic gastritis |
| CAG with IM: Chronic atrophic gastritis with intestinal metaplasia | ||
| CSG: Chronic superficial gastritis | ||
| GC: Gastric cancer | ||
| SIM: Severe intestinal metaplasia | ||
| WIM: Wild intestinal metaplasia | ||
| Oral Cavity | 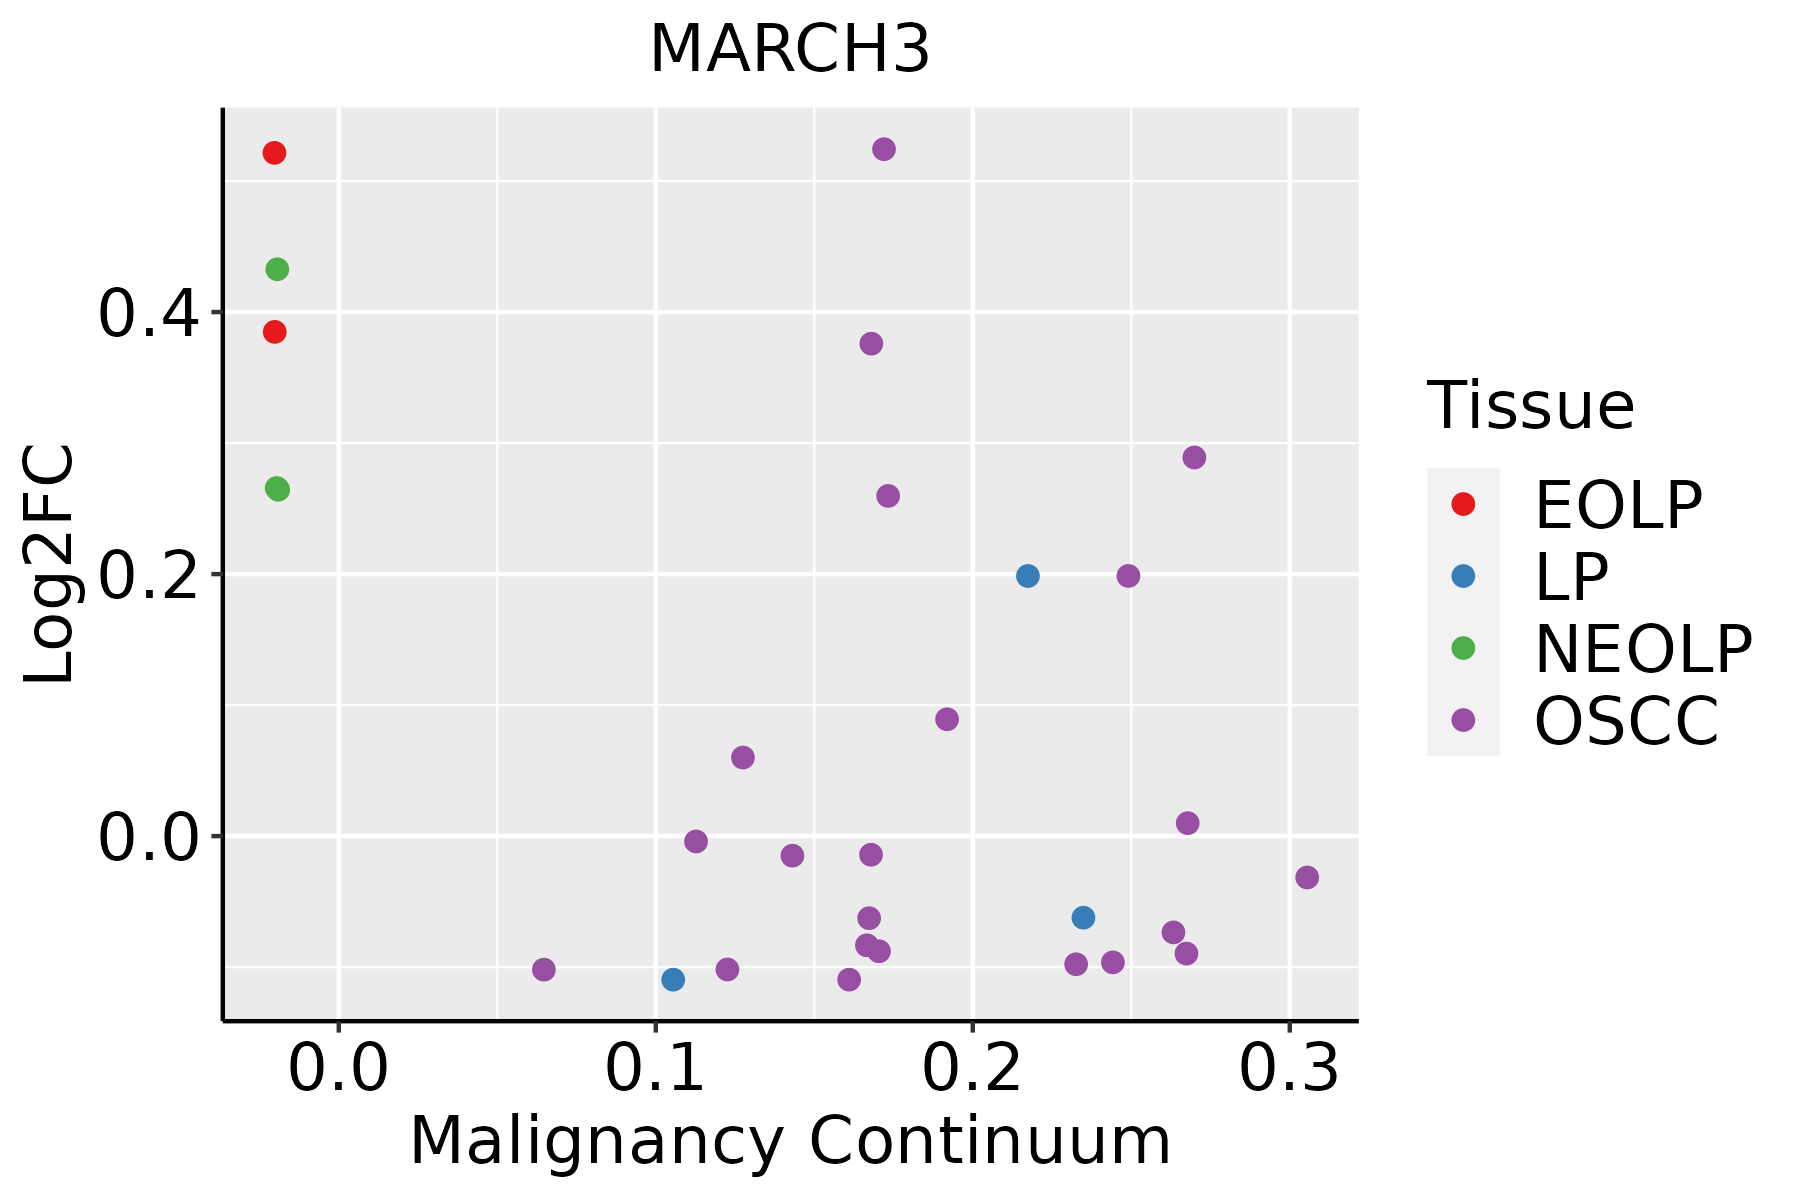 | EOLP: Erosive Oral lichen planus |
| LP: leukoplakia | ||
| NEOLP: Non-erosive oral lichen planus | ||
| OSCC: Oral squamous cell carcinoma |
| ∗log2FC in expression of this searched gene in stem-like cells from each diseased tissue sample relative to stem-like cells in normal samples in each tissue plotted against the malignancy continuum. Samples are colored based on if they are from different disease stage. |
Top |
Malignant transformation related pathway analysis |
| Find out the enriched GO biological processes and KEGG pathways involved in transition from healthy to precancer to cancer |
| Tissue | Disease Stage | Enriched GO biological Processes |
| Colorectum | AD |  |
| Colorectum | SER |  |
| Colorectum | MSS |  |
| Colorectum | MSI-H |  |
| Colorectum | FAP |  |
| ∗Top 15 enriched GO BP terms are showed in the bar plot of each disease state in each tissue. Each row represents a significant GO biological process which is colored according to the -log10(p.adjust). |
| Page: 1 2 3 4 5 6 7 8 9 |
| GO ID | Tissue | Disease Stage | Description | Gene Ratio | Bg Ratio | pvalue | p.adjust | Count |
| Page: 1 |
| Pathway ID | Tissue | Disease Stage | Description | Gene Ratio | Bg Ratio | pvalue | p.adjust | qvalue | Count |
| Page: 1 |
Top |
Cell-cell communication analysis |
| Identification of potential cell-cell interactions between two cell types and their ligand-receptor pairs for different disease states |
| Ligand | Receptor | LRpair | Pathway | Tissue | Disease Stage |
| Page: 1 |
Top |
Single-cell gene regulatory network inference analysis |
| Find out the significant the regulons (TFs) and the target genes of each regulon across cell types for different disease states |
| TF | Cell Type | Tissue | Disease Stage | Target Gene | RSS | Regulon Activity |
| ∗The dot plots of a searched regulon are shown for all cell subpopulations in each disease state of each tissue based on the regulon specific score inferred using pySCENIC and by calculating the average expression. |
| Page: 1 |
Top |
Somatic mutation of malignant transformation related genes |
| Annotation of somatic variants for genes involved in malignant transformation |
| Hugo Symbol | Variant Class | Variant Classification | dbSNP RS | HGVSc | HGVSp | HGVSp Short | SWISSPROT | BIOTYPE | SIFT | PolyPhen | Tumor Sample Barcode | Tissue | Histology | Sex | Age | Stage | Therapy Types | Drugs | Outcome |
| MARCH3 | SNV | Missense_Mutation | novel | c.551N>C | p.Gly184Ala | p.G184A | Q86UD3 | protein_coding | deleterious(0.04) | probably_damaging(0.993) | TCGA-A2-A4RW-01 | Breast | breast invasive carcinoma | Female | <65 | III/IV | Unknown | Unknown | SD |
| MARCH3 | SNV | Missense_Mutation | c.13N>G | p.Arg5Gly | p.R5G | Q86UD3 | protein_coding | tolerated_low_confidence(0.51) | benign(0.001) | TCGA-VS-A957-01 | Cervix | cervical & endocervical cancer | Female | <65 | I/II | Chemotherapy | cisplatin | CR | |
| MARCH3 | SNV | Missense_Mutation | rs548204139 | c.292C>T | p.Arg98Trp | p.R98W | Q86UD3 | protein_coding | deleterious(0) | probably_damaging(0.981) | TCGA-A6-6781-01 | Colorectum | colon adenocarcinoma | Male | <65 | III/IV | Chemotherapy | oxaliplatin | SD |
| MARCH3 | SNV | Missense_Mutation | rs759245490 | c.644G>A | p.Arg215His | p.R215H | Q86UD3 | protein_coding | deleterious(0) | possibly_damaging(0.891) | TCGA-QG-A5YX-01 | Colorectum | colon adenocarcinoma | Female | <65 | I/II | Chemotherapy | xeloda | CR |
| MARCH3 | SNV | Missense_Mutation | rs762900876 | c.370N>T | p.Arg124Cys | p.R124C | Q86UD3 | protein_coding | deleterious(0) | probably_damaging(0.935) | TCGA-A5-A0G1-01 | Endometrium | uterine corpus endometrioid carcinoma | Female | >=65 | I/II | Unknown | Unknown | SD |
| MARCH3 | SNV | Missense_Mutation | novel | c.243N>T | p.Glu81Asp | p.E81D | Q86UD3 | protein_coding | tolerated(0.08) | benign(0.409) | TCGA-AJ-A2QO-01 | Endometrium | uterine corpus endometrioid carcinoma | Female | >=65 | I/II | Unknown | Unknown | SD |
| MARCH3 | SNV | Missense_Mutation | novel | c.592N>C | p.Phe198Leu | p.F198L | Q86UD3 | protein_coding | tolerated(0.91) | benign(0.003) | TCGA-AJ-A3EL-01 | Endometrium | uterine corpus endometrioid carcinoma | Female | <65 | I/II | Unknown | Unknown | SD |
| MARCH3 | SNV | Missense_Mutation | novel | c.124N>G | p.Met42Val | p.M42V | Q86UD3 | protein_coding | tolerated(0.38) | benign(0.013) | TCGA-AP-A1E1-01 | Endometrium | uterine corpus endometrioid carcinoma | Female | >=65 | I/II | Unknown | Unknown | SD |
| MARCH3 | SNV | Missense_Mutation | novel | c.535C>T | p.Arg179Trp | p.R179W | Q86UD3 | protein_coding | tolerated(0.09) | benign(0.003) | TCGA-AX-A2HC-01 | Endometrium | uterine corpus endometrioid carcinoma | Female | <65 | III/IV | Chemotherapy | paclitaxel | PD |
| MARCH3 | SNV | Missense_Mutation | novel | c.167N>A | p.Val56Glu | p.V56E | Q86UD3 | protein_coding | deleterious(0) | benign(0.408) | TCGA-EO-A3KX-01 | Endometrium | uterine corpus endometrioid carcinoma | Female | >=65 | I/II | Unknown | Unknown | SD |
| Page: 1 2 3 |
Top |
Related drugs of malignant transformation related genes |
| Identification of chemicals and drugs interact with genes involved in malignant transfromation |
| (DGIdb 4.0) |
| Entrez ID | Symbol | Category | Interaction Types | Drug Claim Name | Drug Name | PMIDs |
| Page: 1 |

Copyright 2023-Present -The University of Texas Health Science Center at Houston |