
|
|||||
|
 | |
| |
| |
| |
| |
| |
|
Gene: LRPAP1 |
Gene summary for LRPAP1 |
| Gene information | Species | Human | Gene symbol | LRPAP1 | Gene ID | 4043 |
| Gene name | LDL receptor related protein associated protein 1 | |
| Gene Alias | A2MRAP | |
| Cytomap | 4p16.3 | |
| Gene Type | protein-coding | GO ID | GO:0002090 | UniProtAcc | P30533 |
Top |
Malignant transformation analysis |
| Identification of the aberrant gene expression in precancerous and cancerous lesions by comparing the gene expression of stem-like cells in diseased tissues with normal stem cells |
| Entrez ID | Symbol | Replicates | Species | Organ | Tissue | Adj P-value | Log2FC | Malignancy |
| 4043 | LRPAP1 | HCC2 | Human | Liver | HCC | 1.73e-24 | 4.72e+00 | 0.5341 |
| 4043 | LRPAP1 | HCC5 | Human | Liver | HCC | 6.84e-11 | 2.21e+00 | 0.4932 |
| 4043 | LRPAP1 | Pt13.b | Human | Liver | HCC | 2.46e-22 | 1.51e-01 | 0.0251 |
| 4043 | LRPAP1 | Pt14.b | Human | Liver | HCC | 7.02e-05 | 1.49e-01 | 0.018 |
| 4043 | LRPAP1 | S014 | Human | Liver | HCC | 4.54e-24 | 1.68e+00 | 0.2254 |
| 4043 | LRPAP1 | S015 | Human | Liver | HCC | 3.32e-23 | 2.19e+00 | 0.2375 |
| 4043 | LRPAP1 | S016 | Human | Liver | HCC | 1.56e-20 | 1.48e+00 | 0.2243 |
| 4043 | LRPAP1 | S027 | Human | Liver | HCC | 2.12e-16 | 1.77e+00 | 0.2446 |
| 4043 | LRPAP1 | S028 | Human | Liver | HCC | 6.24e-39 | 1.97e+00 | 0.2503 |
| 4043 | LRPAP1 | S029 | Human | Liver | HCC | 1.11e-42 | 2.23e+00 | 0.2581 |
| 4043 | LRPAP1 | C04 | Human | Oral cavity | OSCC | 6.80e-33 | 1.96e+00 | 0.2633 |
| 4043 | LRPAP1 | C21 | Human | Oral cavity | OSCC | 7.32e-76 | 3.23e+00 | 0.2678 |
| 4043 | LRPAP1 | C30 | Human | Oral cavity | OSCC | 1.46e-47 | 3.05e+00 | 0.3055 |
| 4043 | LRPAP1 | C38 | Human | Oral cavity | OSCC | 2.69e-10 | 1.64e+00 | 0.172 |
| 4043 | LRPAP1 | C43 | Human | Oral cavity | OSCC | 3.14e-26 | 6.70e-01 | 0.1704 |
| 4043 | LRPAP1 | C46 | Human | Oral cavity | OSCC | 1.21e-38 | 1.20e+00 | 0.1673 |
| 4043 | LRPAP1 | C51 | Human | Oral cavity | OSCC | 7.29e-35 | 2.31e+00 | 0.2674 |
| 4043 | LRPAP1 | C57 | Human | Oral cavity | OSCC | 3.21e-10 | 7.93e-01 | 0.1679 |
| 4043 | LRPAP1 | C06 | Human | Oral cavity | OSCC | 5.01e-17 | 2.63e+00 | 0.2699 |
| 4043 | LRPAP1 | C07 | Human | Oral cavity | OSCC | 2.37e-08 | 2.09e+00 | 0.2491 |
| Page: 1 2 3 4 5 6 7 8 9 10 |
| Tissue | Expression Dynamics | Abbreviation |
| Colorectum (GSE201348) |  | FAP: Familial adenomatous polyposis |
| CRC: Colorectal cancer | ||
| Colorectum (HTA11) |  | AD: Adenomas |
| SER: Sessile serrated lesions | ||
| MSI-H: Microsatellite-high colorectal cancer | ||
| MSS: Microsatellite stable colorectal cancer | ||
| Endometrium | 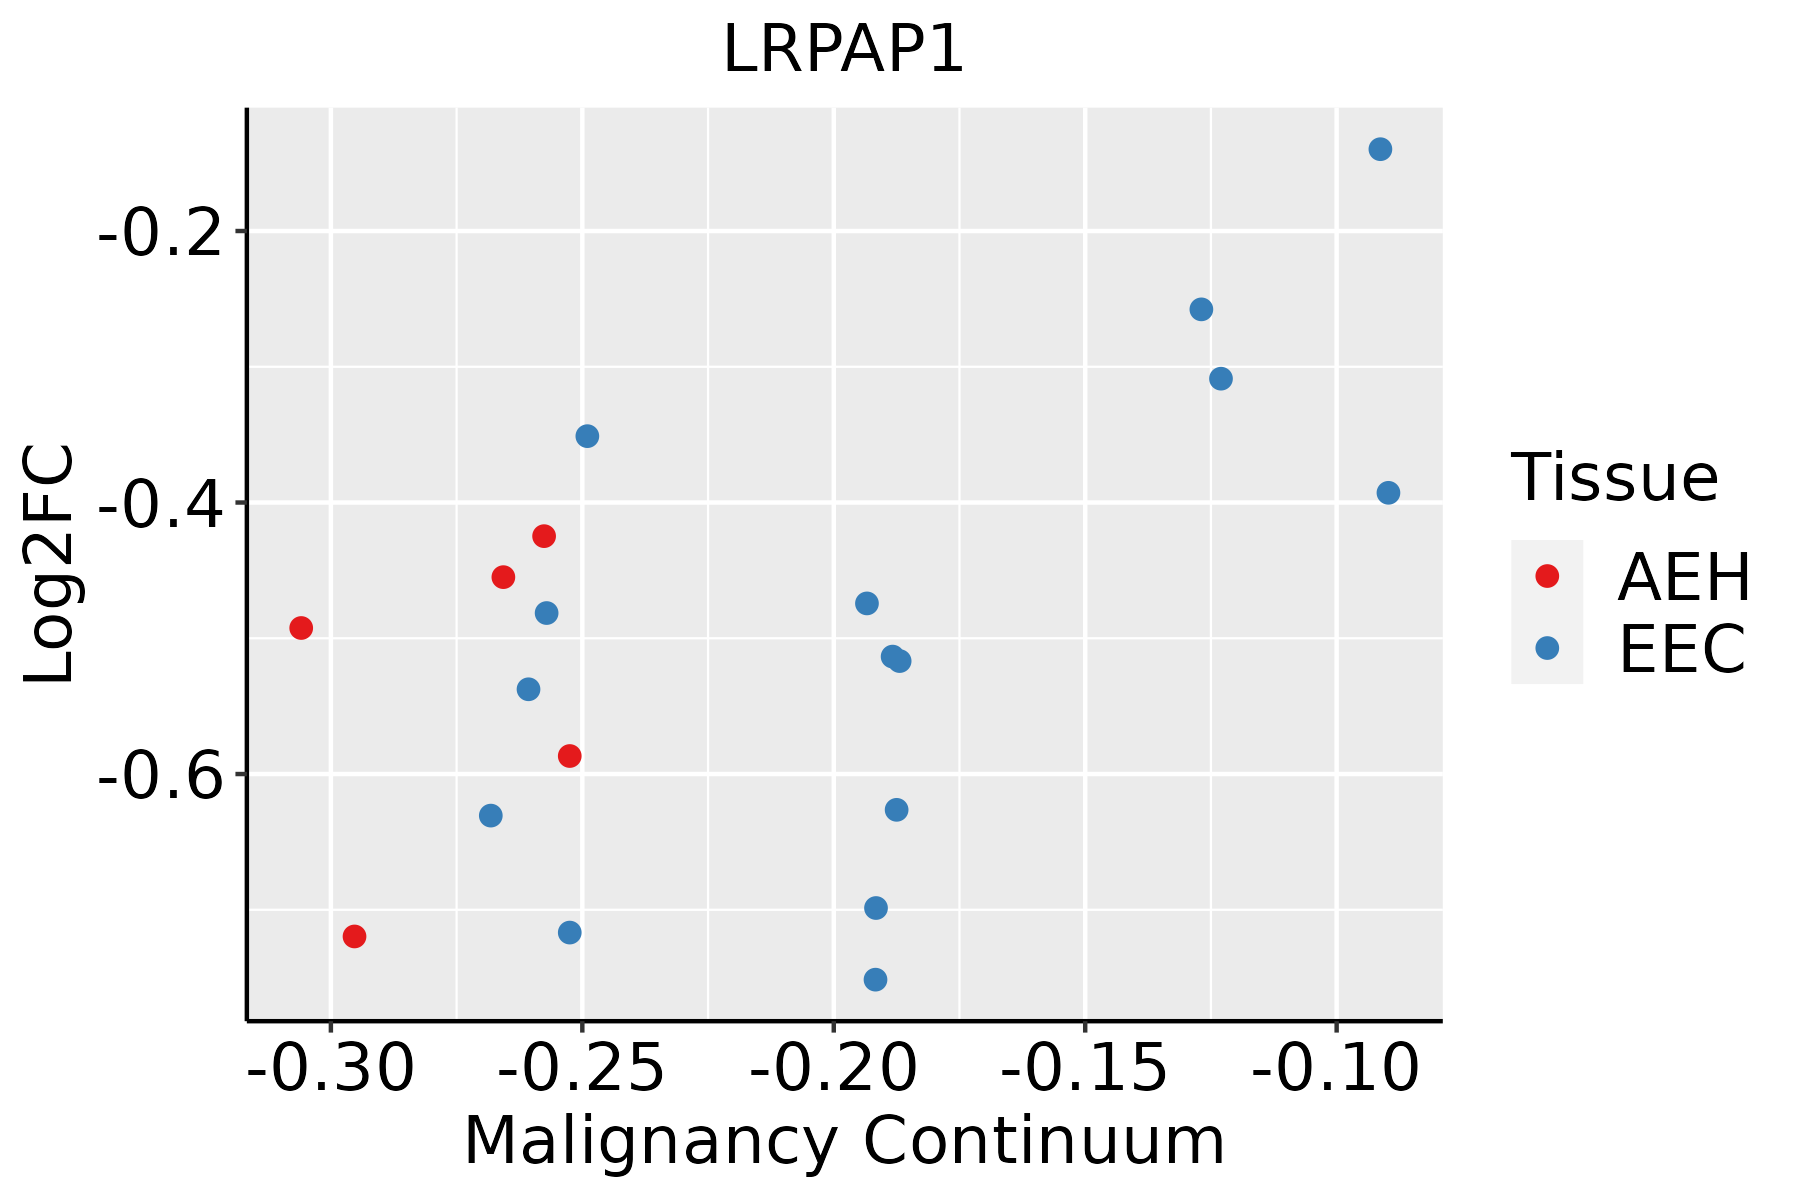 | AEH: Atypical endometrial hyperplasia |
| EEC: Endometrioid Cancer | ||
| Esophagus | 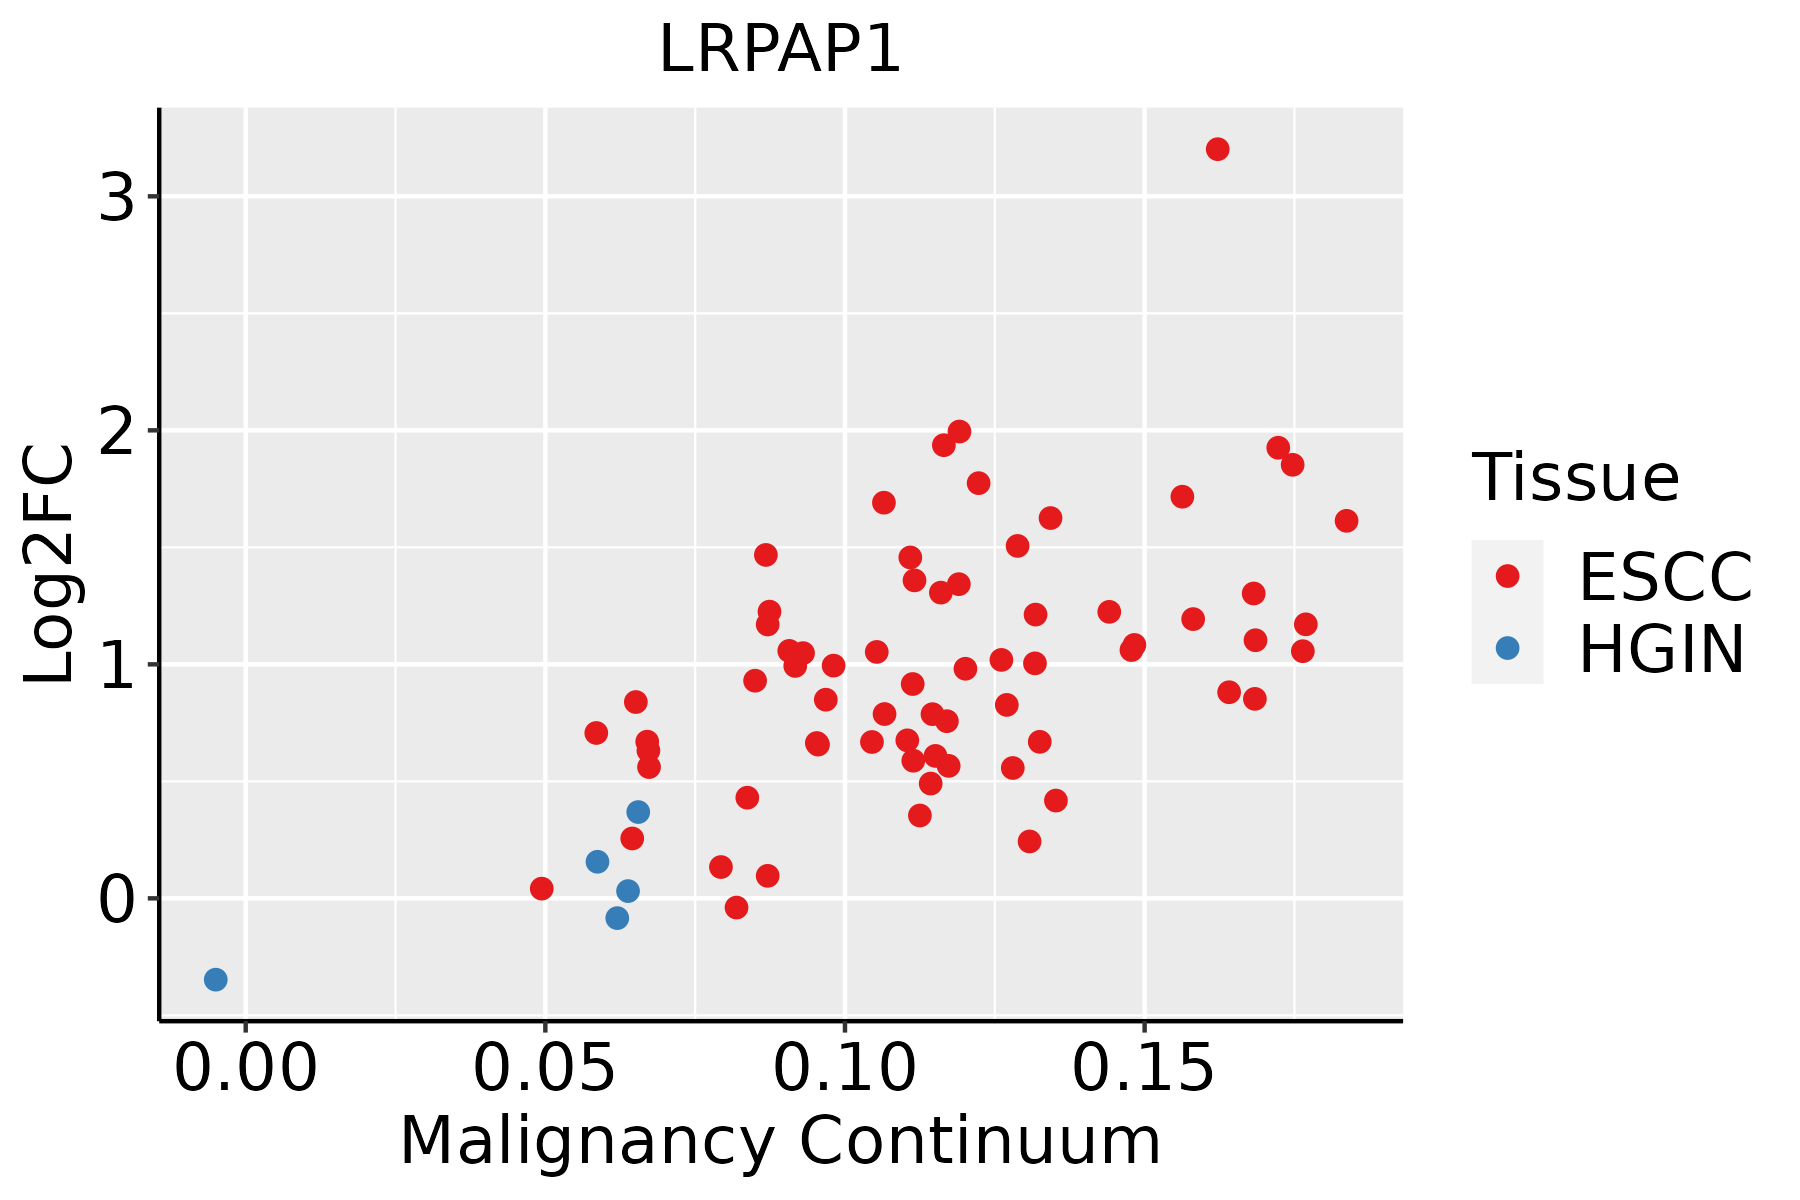 | ESCC: Esophageal squamous cell carcinoma |
| HGIN: High-grade intraepithelial neoplasias | ||
| LGIN: Low-grade intraepithelial neoplasias | ||
| Liver |  | HCC: Hepatocellular carcinoma |
| NAFLD: Non-alcoholic fatty liver disease | ||
| Oral Cavity | 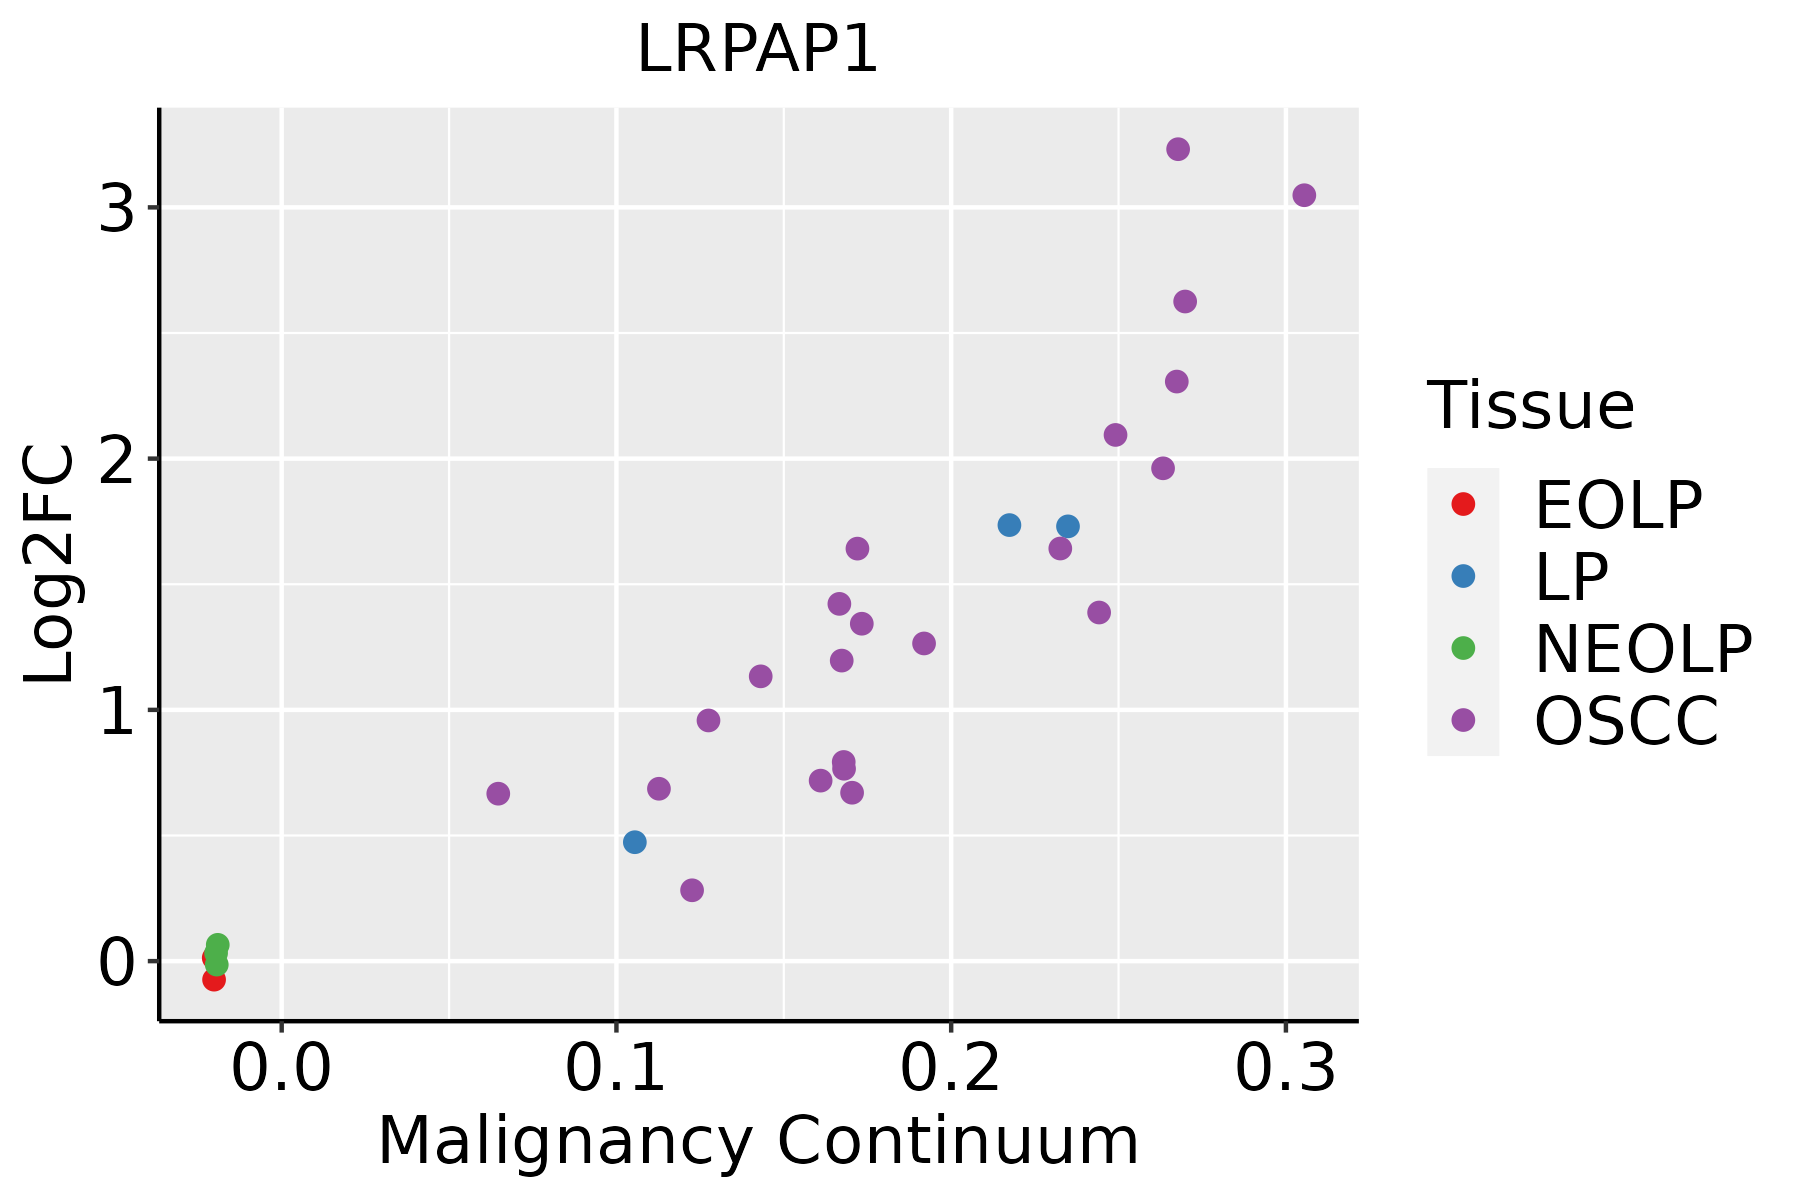 | EOLP: Erosive Oral lichen planus |
| LP: leukoplakia | ||
| NEOLP: Non-erosive oral lichen planus | ||
| OSCC: Oral squamous cell carcinoma | ||
| Prostate | 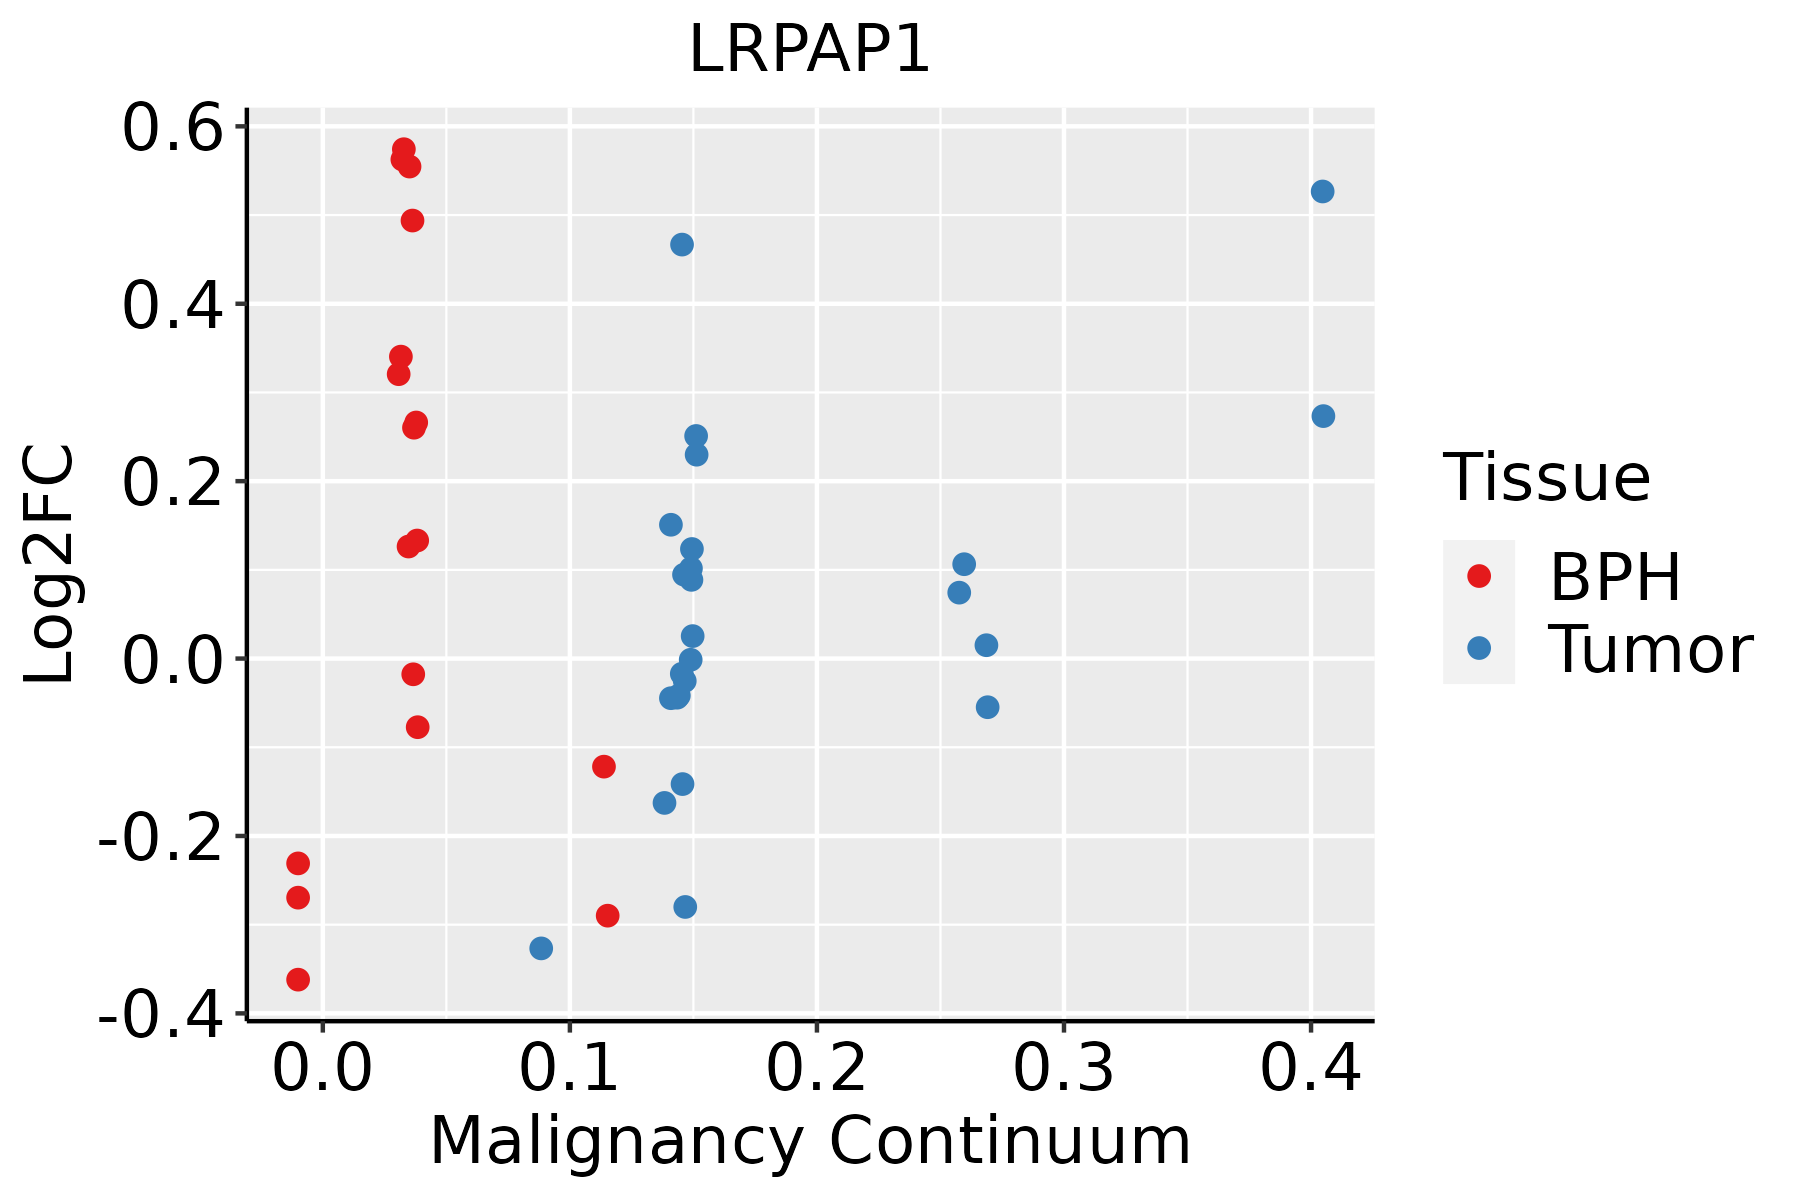 | BPH: Benign Prostatic Hyperplasia |
| Skin | 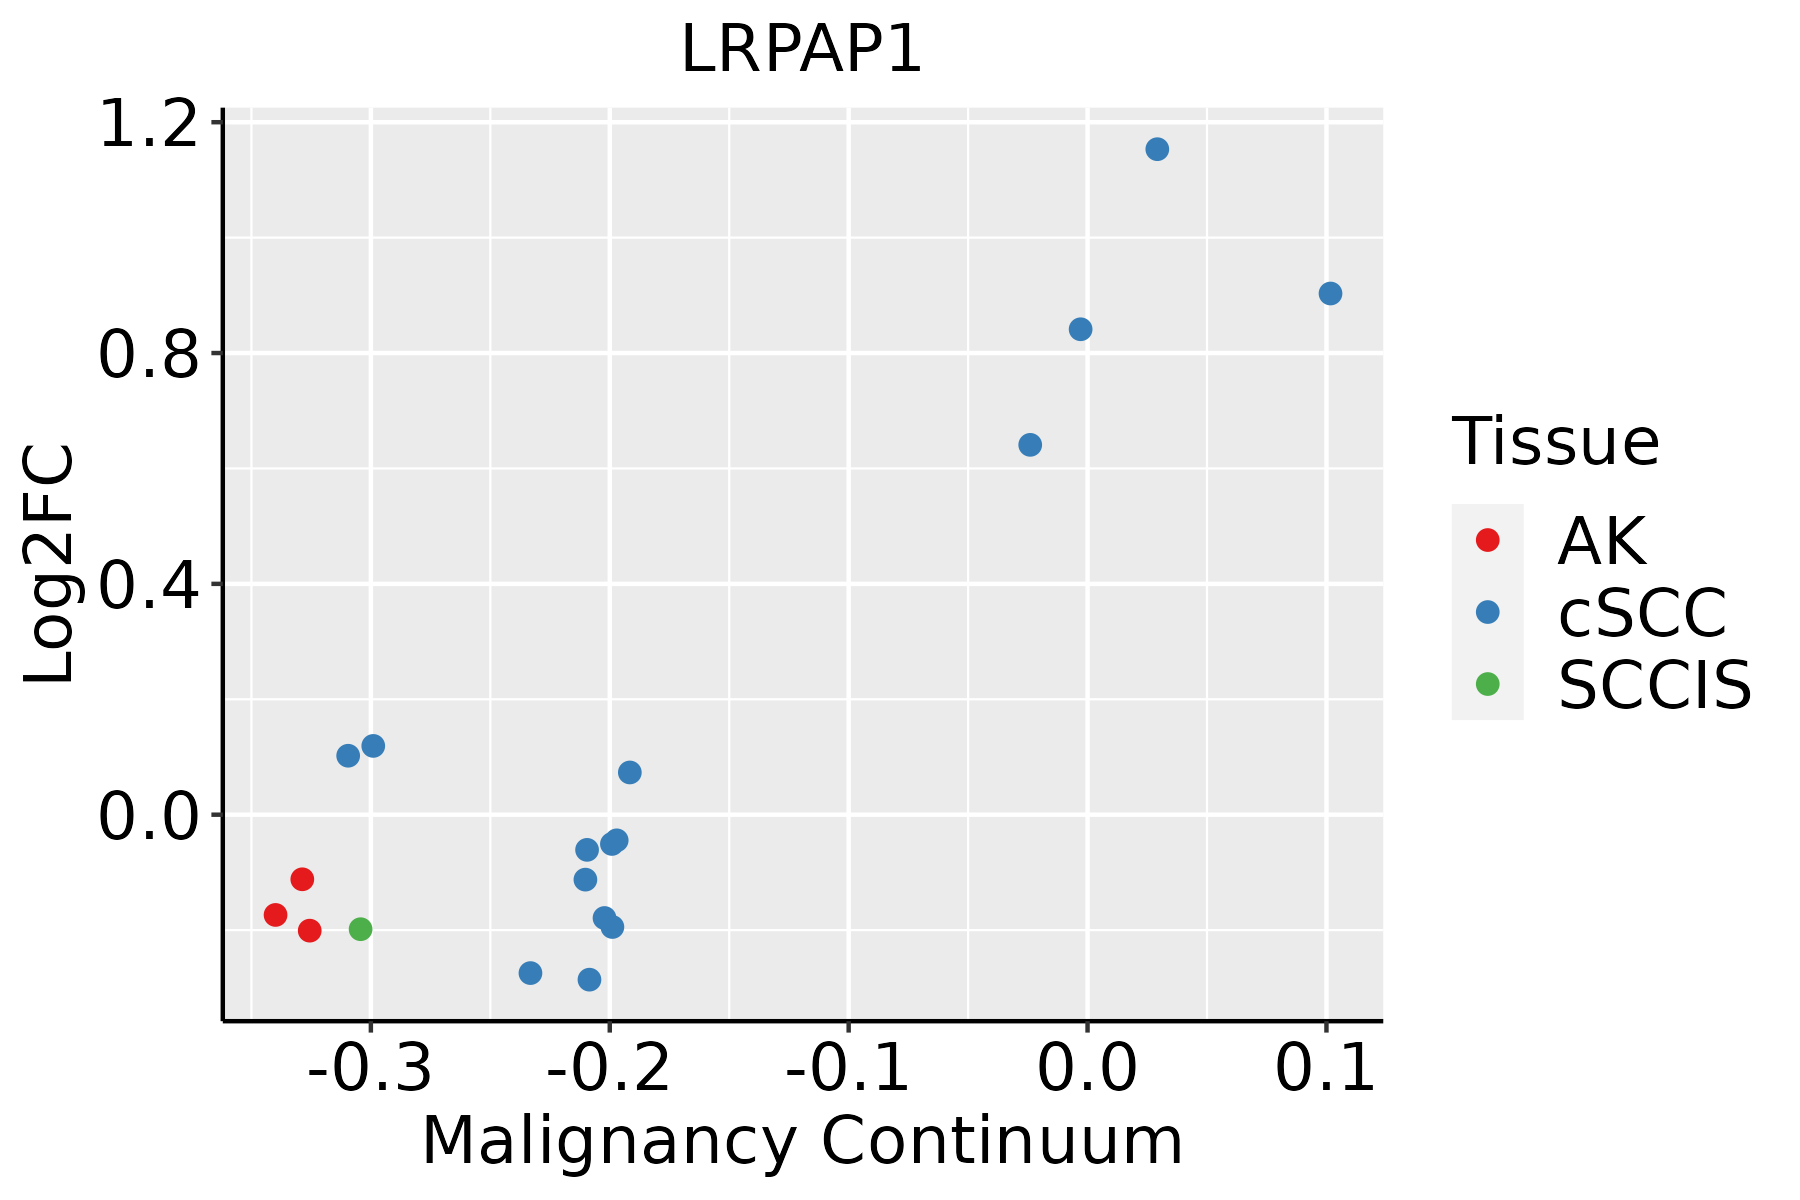 | AK: Actinic keratosis |
| cSCC: Cutaneous squamous cell carcinoma | ||
| SCCIS:squamous cell carcinoma in situ | ||
| Thyroid | 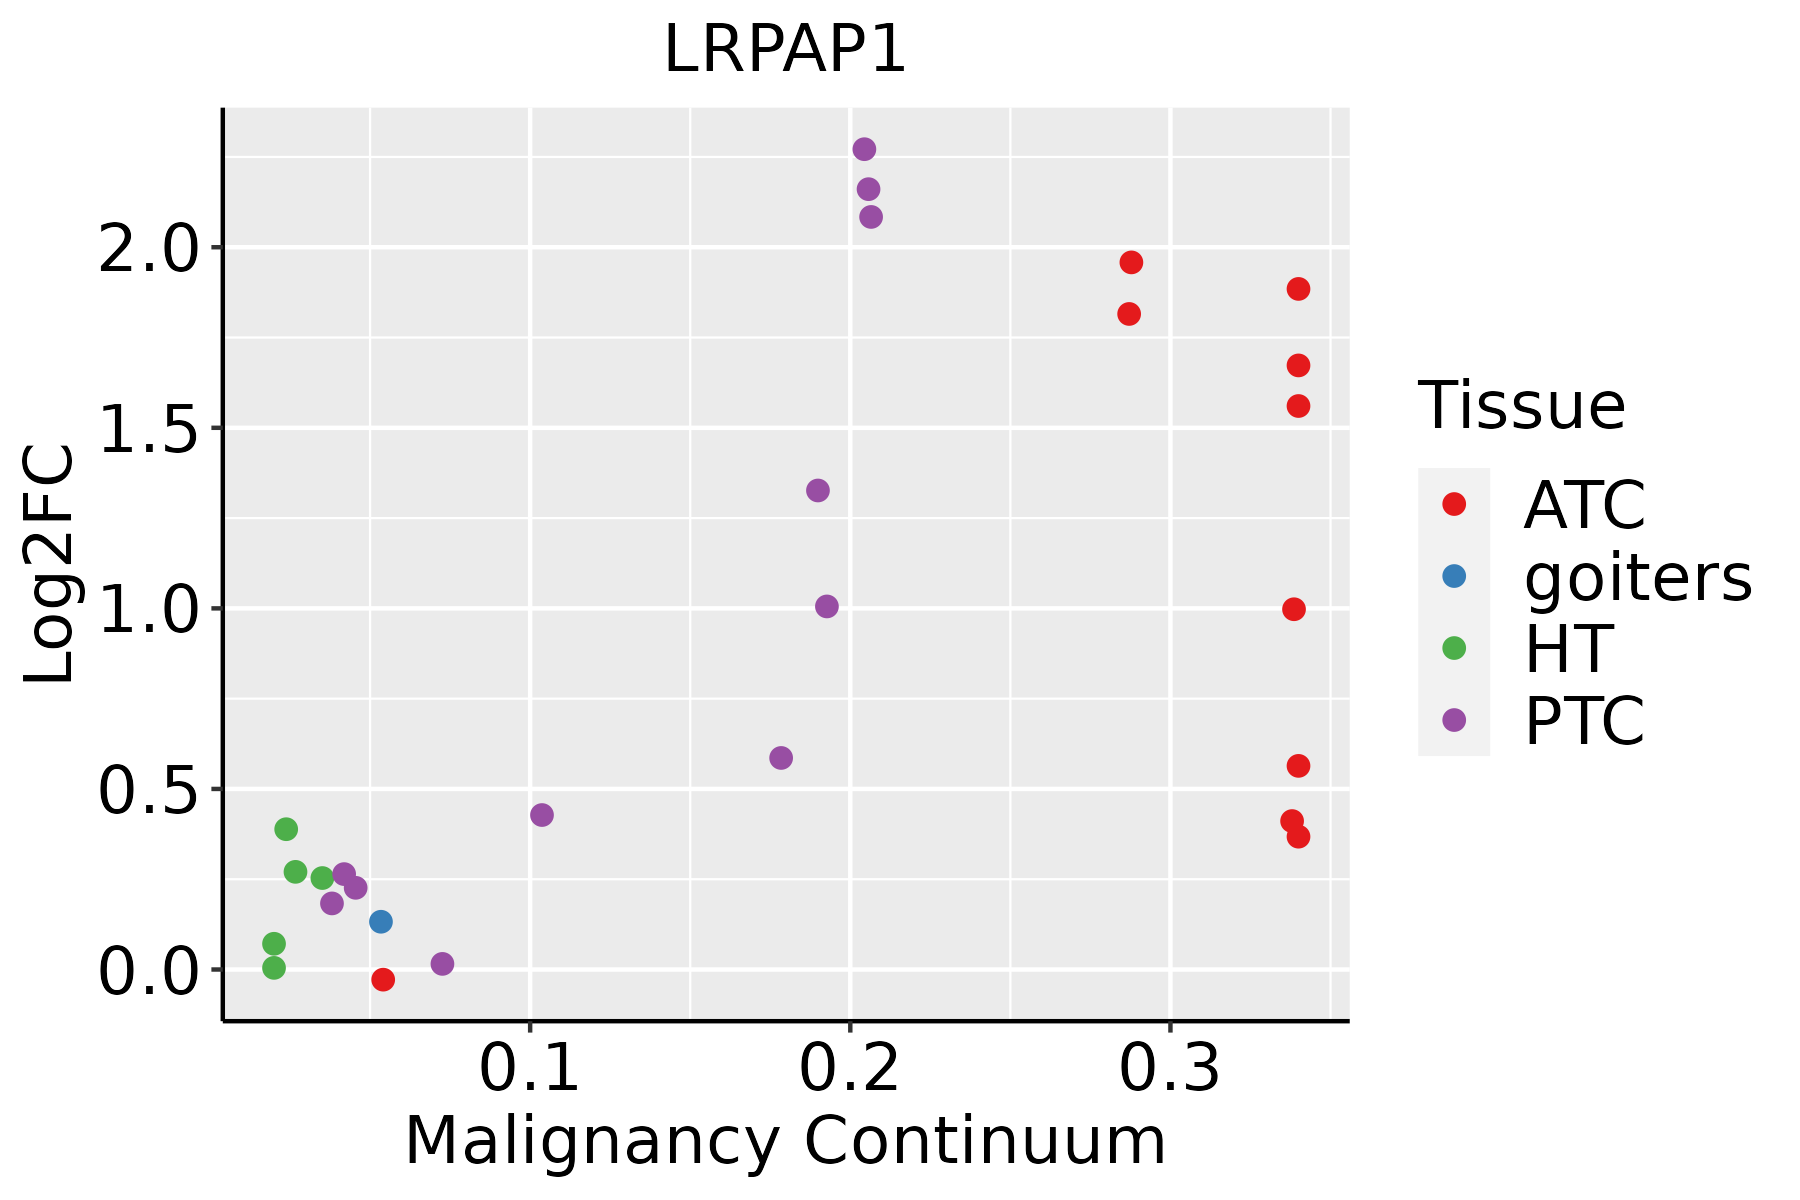 | ATC: Anaplastic thyroid cancer |
| HT: Hashimoto's thyroiditis | ||
| PTC: Papillary thyroid cancer |
| ∗log2FC in expression of this searched gene in stem-like cells from each diseased tissue sample relative to stem-like cells in normal samples in each tissue plotted against the malignancy continuum. Samples are colored based on if they are from different disease stage. |
Top |
Malignant transformation related pathway analysis |
| Find out the enriched GO biological processes and KEGG pathways involved in transition from healthy to precancer to cancer |
| Tissue | Disease Stage | Enriched GO biological Processes |
| Colorectum | AD |  |
| Colorectum | SER |  |
| Colorectum | MSS |  |
| Colorectum | MSI-H |  |
| Colorectum | FAP |  |
| ∗Top 15 enriched GO BP terms are showed in the bar plot of each disease state in each tissue. Each row represents a significant GO biological process which is colored according to the -log10(p.adjust). |
| Page: 1 2 3 4 5 6 7 8 9 |
| GO ID | Tissue | Disease Stage | Description | Gene Ratio | Bg Ratio | pvalue | p.adjust | Count |
| GO:0051098 | Colorectum | AD | regulation of binding | 126/3918 | 363/18723 | 6.01e-10 | 4.88e-08 | 126 |
| GO:0043112 | Colorectum | AD | receptor metabolic process | 62/3918 | 166/18723 | 8.18e-07 | 2.85e-05 | 62 |
| GO:0043393 | Colorectum | AD | regulation of protein binding | 68/3918 | 196/18723 | 5.17e-06 | 1.34e-04 | 68 |
| GO:0006898 | Colorectum | AD | receptor-mediated endocytosis | 76/3918 | 244/18723 | 1.07e-04 | 1.59e-03 | 76 |
| GO:0030100 | Colorectum | AD | regulation of endocytosis | 67/3918 | 211/18723 | 1.42e-04 | 2.01e-03 | 67 |
| GO:0051100 | Colorectum | AD | negative regulation of binding | 50/3918 | 162/18723 | 1.84e-03 | 1.51e-02 | 50 |
| GO:0048259 | Colorectum | AD | regulation of receptor-mediated endocytosis | 35/3918 | 110/18723 | 4.85e-03 | 3.27e-02 | 35 |
| GO:0045056 | Colorectum | AD | transcytosis | 10/3918 | 21/18723 | 5.71e-03 | 3.64e-02 | 10 |
| GO:0031623 | Colorectum | AD | receptor internalization | 35/3918 | 113/18723 | 7.72e-03 | 4.66e-02 | 35 |
| GO:0032091 | Colorectum | AD | negative regulation of protein binding | 30/3918 | 94/18723 | 8.26e-03 | 4.85e-02 | 30 |
| GO:00510981 | Colorectum | SER | regulation of binding | 97/2897 | 363/18723 | 1.98e-08 | 1.43e-06 | 97 |
| GO:00433931 | Colorectum | SER | regulation of protein binding | 54/2897 | 196/18723 | 1.00e-05 | 3.31e-04 | 54 |
| GO:0051051 | Colorectum | SER | negative regulation of transport | 98/2897 | 470/18723 | 1.01e-03 | 1.19e-02 | 98 |
| GO:00511001 | Colorectum | SER | negative regulation of binding | 40/2897 | 162/18723 | 1.46e-03 | 1.59e-02 | 40 |
| GO:00320911 | Colorectum | SER | negative regulation of protein binding | 26/2897 | 94/18723 | 1.76e-03 | 1.81e-02 | 26 |
| GO:00450561 | Colorectum | SER | transcytosis | 9/2897 | 21/18723 | 2.50e-03 | 2.33e-02 | 9 |
| GO:00301001 | Colorectum | SER | regulation of endocytosis | 48/2897 | 211/18723 | 3.29e-03 | 2.82e-02 | 48 |
| GO:00510982 | Colorectum | MSS | regulation of binding | 113/3467 | 363/18723 | 3.55e-09 | 2.41e-07 | 113 |
| GO:00431121 | Colorectum | MSS | receptor metabolic process | 57/3467 | 166/18723 | 8.47e-07 | 2.97e-05 | 57 |
| GO:00433932 | Colorectum | MSS | regulation of protein binding | 62/3467 | 196/18723 | 6.44e-06 | 1.69e-04 | 62 |
| Page: 1 2 3 4 5 6 7 8 |
| Pathway ID | Tissue | Disease Stage | Description | Gene Ratio | Bg Ratio | pvalue | p.adjust | qvalue | Count |
| hsa049792 | Liver | Cirrhotic | Cholesterol metabolism | 30/2530 | 51/8465 | 1.59e-05 | 1.39e-04 | 8.60e-05 | 30 |
| hsa049793 | Liver | Cirrhotic | Cholesterol metabolism | 30/2530 | 51/8465 | 1.59e-05 | 1.39e-04 | 8.60e-05 | 30 |
| hsa049794 | Liver | HCC | Cholesterol metabolism | 41/4020 | 51/8465 | 1.33e-06 | 1.35e-05 | 7.49e-06 | 41 |
| hsa049795 | Liver | HCC | Cholesterol metabolism | 41/4020 | 51/8465 | 1.33e-06 | 1.35e-05 | 7.49e-06 | 41 |
| Page: 1 |
Top |
Cell-cell communication analysis |
| Identification of potential cell-cell interactions between two cell types and their ligand-receptor pairs for different disease states |
| Ligand | Receptor | LRpair | Pathway | Tissue | Disease Stage |
| Page: 1 |
Top |
Single-cell gene regulatory network inference analysis |
| Find out the significant the regulons (TFs) and the target genes of each regulon across cell types for different disease states |
| TF | Cell Type | Tissue | Disease Stage | Target Gene | RSS | Regulon Activity |
| ∗The dot plots of a searched regulon are shown for all cell subpopulations in each disease state of each tissue based on the regulon specific score inferred using pySCENIC and by calculating the average expression. |
| Page: 1 |
Top |
Somatic mutation of malignant transformation related genes |
| Annotation of somatic variants for genes involved in malignant transformation |
| Hugo Symbol | Variant Class | Variant Classification | dbSNP RS | HGVSc | HGVSp | HGVSp Short | SWISSPROT | BIOTYPE | SIFT | PolyPhen | Tumor Sample Barcode | Tissue | Histology | Sex | Age | Stage | Therapy Types | Drugs | Outcome |
| LRPAP1 | SNV | Missense_Mutation | c.1037N>G | p.Ser346Cys | p.S346C | P30533 | protein_coding | deleterious(0) | possibly_damaging(0.789) | TCGA-A8-A097-01 | Breast | breast invasive carcinoma | Female | >=65 | I/II | Hormone Therapy | tamoxiphen | SD | |
| LRPAP1 | SNV | Missense_Mutation | rs746310452 | c.307G>A | p.Glu103Lys | p.E103K | P30533 | protein_coding | tolerated(0.34) | benign(0.011) | TCGA-AN-A046-01 | Breast | breast invasive carcinoma | Female | >=65 | I/II | Unknown | Unknown | SD |
| LRPAP1 | SNV | Missense_Mutation | rs374011051 | c.601N>A | p.Glu201Lys | p.E201K | P30533 | protein_coding | tolerated(1) | benign(0.005) | TCGA-AO-A128-01 | Breast | breast invasive carcinoma | Female | <65 | I/II | Chemotherapy | doxorubicin | SD |
| LRPAP1 | SNV | Missense_Mutation | rs770127302 | c.232G>A | p.Glu78Lys | p.E78K | P30533 | protein_coding | deleterious(0.04) | benign(0.017) | TCGA-E2-A2P6-01 | Breast | breast invasive carcinoma | Female | >=65 | I/II | Hormone Therapy | anastrozole | SD |
| LRPAP1 | SNV | Missense_Mutation | rs368226243 | c.757N>A | p.Glu253Lys | p.E253K | P30533 | protein_coding | tolerated(0.62) | benign(0.02) | TCGA-Z7-A8R6-01 | Breast | breast invasive carcinoma | Female | <65 | I/II | Chemotherapy | taxol | CR |
| LRPAP1 | SNV | Missense_Mutation | c.388N>T | p.Ala130Ser | p.A130S | P30533 | protein_coding | tolerated(0.54) | benign(0.022) | TCGA-AA-3846-01 | Colorectum | colon adenocarcinoma | Female | >=65 | I/II | Unknown | Unknown | SD | |
| LRPAP1 | SNV | Missense_Mutation | c.389N>T | p.Ala130Val | p.A130V | P30533 | protein_coding | tolerated(0.14) | benign(0.007) | TCGA-AA-3864-01 | Colorectum | colon adenocarcinoma | Male | >=65 | I/II | Unknown | Unknown | SD | |
| LRPAP1 | SNV | Missense_Mutation | novel | c.455N>T | p.Glu152Val | p.E152V | P30533 | protein_coding | deleterious(0.01) | possibly_damaging(0.872) | TCGA-AA-3952-01 | Colorectum | colon adenocarcinoma | Male | >=65 | III/IV | Unknown | Unknown | PD |
| LRPAP1 | SNV | Missense_Mutation | rs755497927 | c.799N>A | p.Ala267Thr | p.A267T | P30533 | protein_coding | deleterious(0.03) | possibly_damaging(0.751) | TCGA-CK-4951-01 | Colorectum | colon adenocarcinoma | Female | >=65 | I/II | Unknown | Unknown | PD |
| LRPAP1 | SNV | Missense_Mutation | novel | c.986G>A | p.Gly329Glu | p.G329E | P30533 | protein_coding | tolerated(1) | benign(0) | TCGA-A5-A0G2-01 | Endometrium | uterine corpus endometrioid carcinoma | Female | <65 | III/IV | Unknown | Unknown | SD |
| Page: 1 2 3 4 |
Top |
Related drugs of malignant transformation related genes |
| Identification of chemicals and drugs interact with genes involved in malignant transfromation |
| (DGIdb 4.0) |
| Entrez ID | Symbol | Category | Interaction Types | Drug Claim Name | Drug Name | PMIDs |
| Page: 1 |

Copyright 2023-Present -The University of Texas Health Science Center at Houston |