
|
|||||
|
 | |
| |
| |
| |
| |
| |
|
Gene: ISOC2 |
Gene summary for ISOC2 |
| Gene information | Species | Human | Gene symbol | ISOC2 | Gene ID | 79763 |
| Gene name | isochorismatase domain containing 2 | |
| Gene Alias | ISOC2 | |
| Cytomap | 19q13.42 | |
| Gene Type | protein-coding | GO ID | GO:0008150 | UniProtAcc | Q96AB3 |
Top |
Malignant transformation analysis |
| Identification of the aberrant gene expression in precancerous and cancerous lesions by comparing the gene expression of stem-like cells in diseased tissues with normal stem cells |
| Entrez ID | Symbol | Replicates | Species | Organ | Tissue | Adj P-value | Log2FC | Malignancy |
| 79763 | ISOC2 | C57 | Human | Oral cavity | OSCC | 7.05e-11 | 8.86e-01 | 0.1679 |
| 79763 | ISOC2 | C06 | Human | Oral cavity | OSCC | 3.90e-15 | 2.35e+00 | 0.2699 |
| 79763 | ISOC2 | C07 | Human | Oral cavity | OSCC | 5.79e-07 | 1.25e+00 | 0.2491 |
| 79763 | ISOC2 | C08 | Human | Oral cavity | OSCC | 3.83e-35 | 8.43e-01 | 0.1919 |
| 79763 | ISOC2 | C09 | Human | Oral cavity | OSCC | 4.73e-34 | 1.05e+00 | 0.1431 |
| 79763 | ISOC2 | LN22 | Human | Oral cavity | OSCC | 9.12e-06 | 1.27e+00 | 0.1733 |
| 79763 | ISOC2 | LN38 | Human | Oral cavity | OSCC | 3.66e-06 | 1.52e+00 | 0.168 |
| 79763 | ISOC2 | LN46 | Human | Oral cavity | OSCC | 2.35e-20 | 1.04e+00 | 0.1666 |
| 79763 | ISOC2 | LP15 | Human | Oral cavity | LP | 8.64e-10 | 1.37e+00 | 0.2174 |
| 79763 | ISOC2 | LP17 | Human | Oral cavity | LP | 2.79e-07 | 1.44e+00 | 0.2349 |
| 79763 | ISOC2 | SYSMH1 | Human | Oral cavity | OSCC | 1.27e-10 | 4.29e-01 | 0.1127 |
| 79763 | ISOC2 | SYSMH2 | Human | Oral cavity | OSCC | 6.03e-33 | 1.22e+00 | 0.2326 |
| 79763 | ISOC2 | SYSMH3 | Human | Oral cavity | OSCC | 5.89e-48 | 1.57e+00 | 0.2442 |
| 79763 | ISOC2 | SYSMH4 | Human | Oral cavity | OSCC | 6.16e-14 | 3.16e-01 | 0.1226 |
| 79763 | ISOC2 | SYSMH5 | Human | Oral cavity | OSCC | 4.25e-14 | 5.65e-01 | 0.0647 |
| 79763 | ISOC2 | SYSMH6 | Human | Oral cavity | OSCC | 1.64e-16 | 7.06e-01 | 0.1275 |
| 79763 | ISOC2 | P4_S8_cSCC | Human | Skin | cSCC | 1.26e-11 | 1.89e-01 | -0.3095 |
| 79763 | ISOC2 | P5_S10_cSCC | Human | Skin | cSCC | 2.41e-04 | 6.19e-02 | -0.299 |
| 79763 | ISOC2 | P1_cSCC | Human | Skin | cSCC | 3.83e-45 | 1.46e+00 | 0.0292 |
| 79763 | ISOC2 | P2_cSCC | Human | Skin | cSCC | 3.77e-40 | 9.79e-01 | -0.024 |
| Page: 1 2 3 4 5 6 7 8 |
| Tissue | Expression Dynamics | Abbreviation |
| Breast | 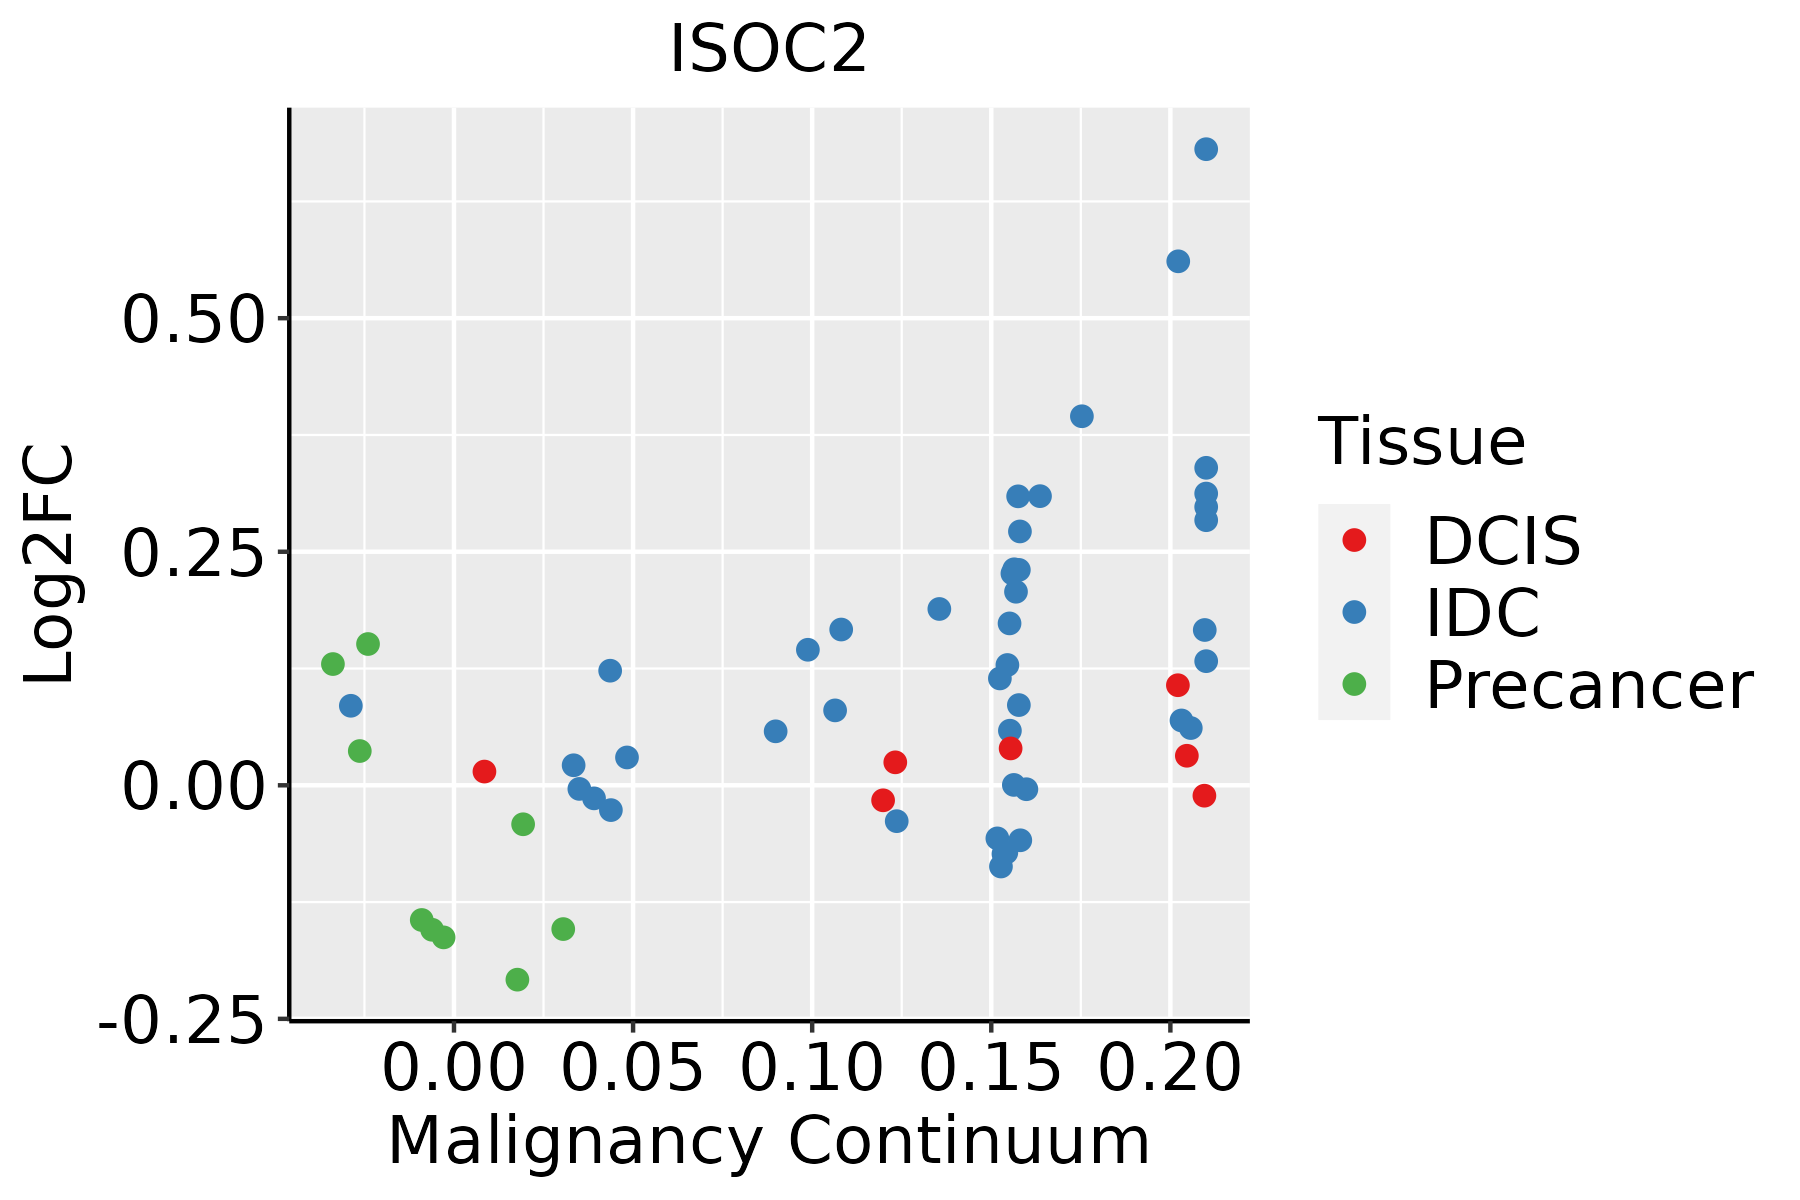 | IDC: Invasive ductal carcinoma |
| DCIS: Ductal carcinoma in situ | ||
| Precancer(BRCA1-mut): Precancerous lesion from BRCA1 mutation carriers | ||
| Colorectum (GSE201348) |  | FAP: Familial adenomatous polyposis |
| CRC: Colorectal cancer | ||
| Colorectum (HTA11) |  | AD: Adenomas |
| SER: Sessile serrated lesions | ||
| MSI-H: Microsatellite-high colorectal cancer | ||
| MSS: Microsatellite stable colorectal cancer | ||
| Esophagus | 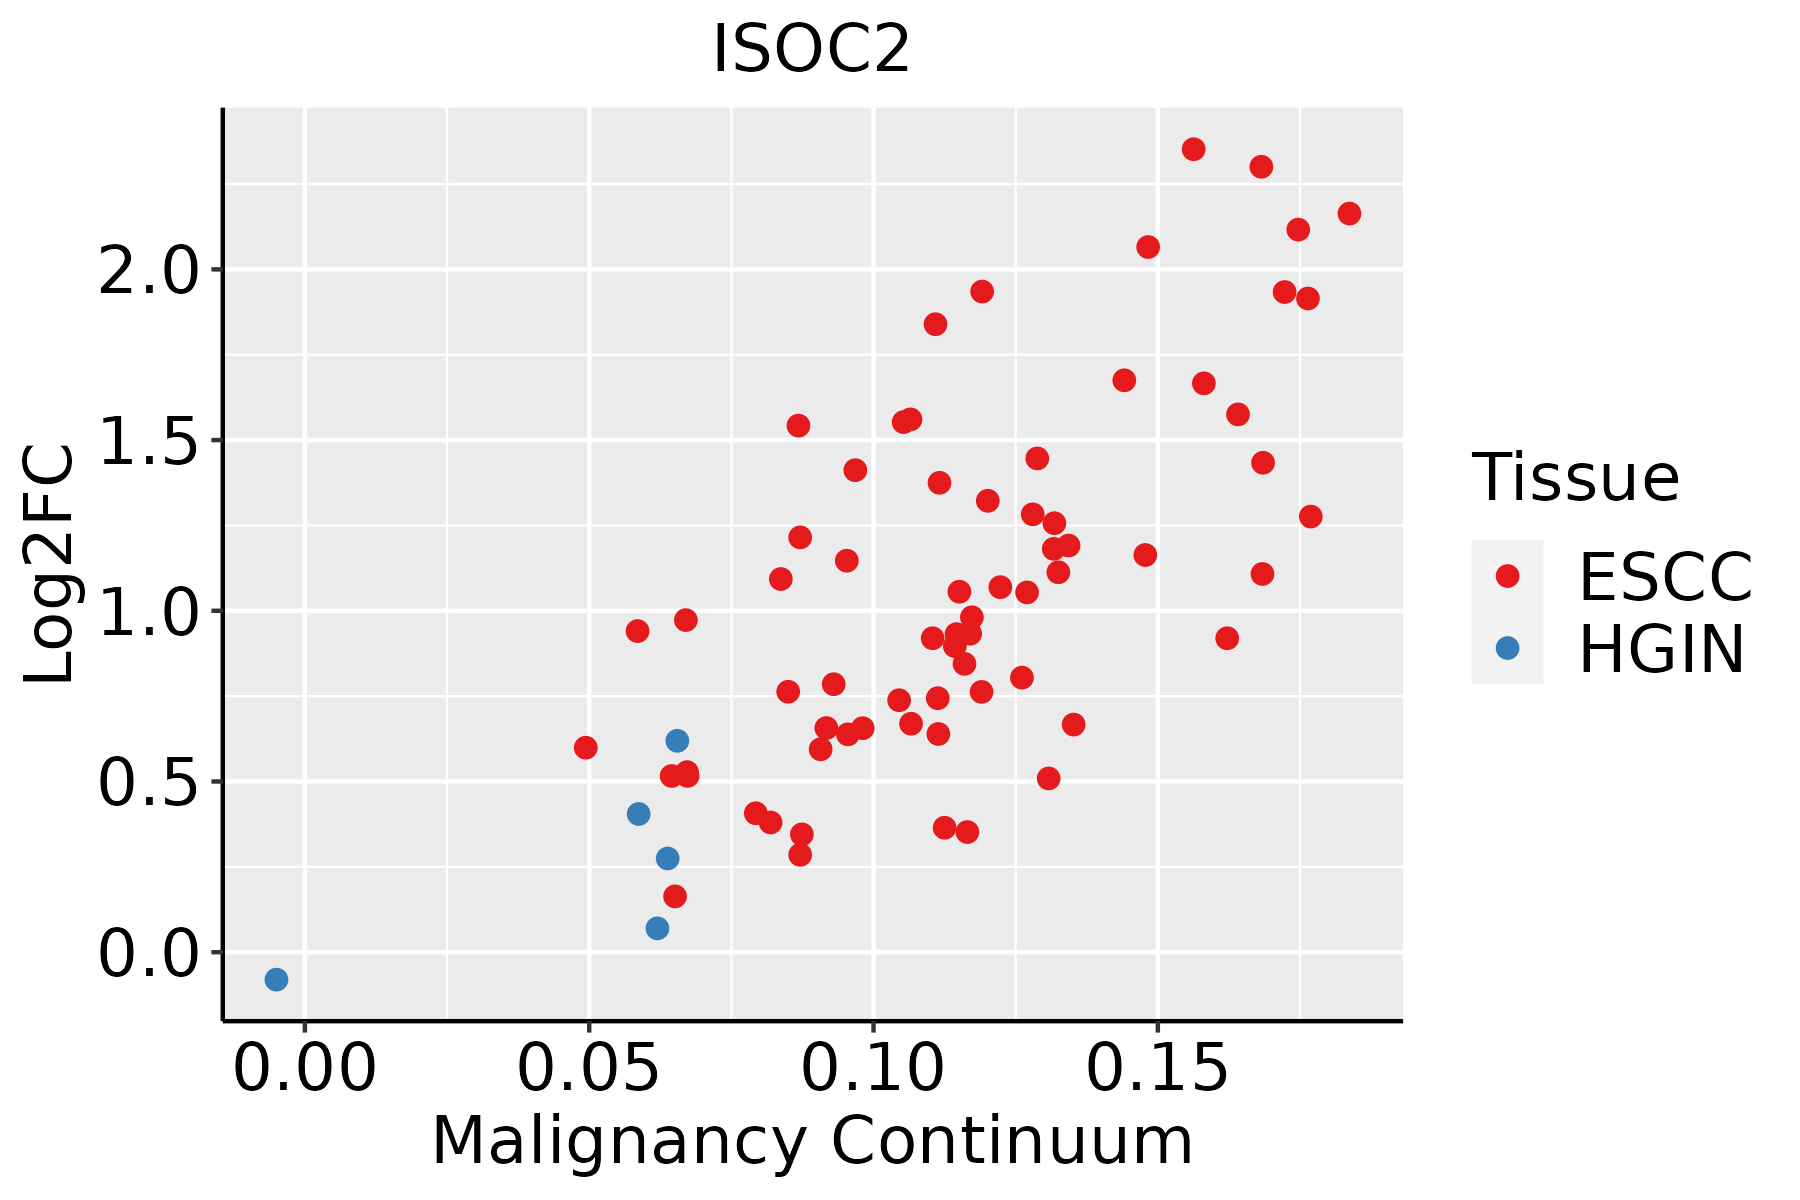 | ESCC: Esophageal squamous cell carcinoma |
| HGIN: High-grade intraepithelial neoplasias | ||
| LGIN: Low-grade intraepithelial neoplasias | ||
| Liver |  | HCC: Hepatocellular carcinoma |
| NAFLD: Non-alcoholic fatty liver disease | ||
| Oral Cavity | 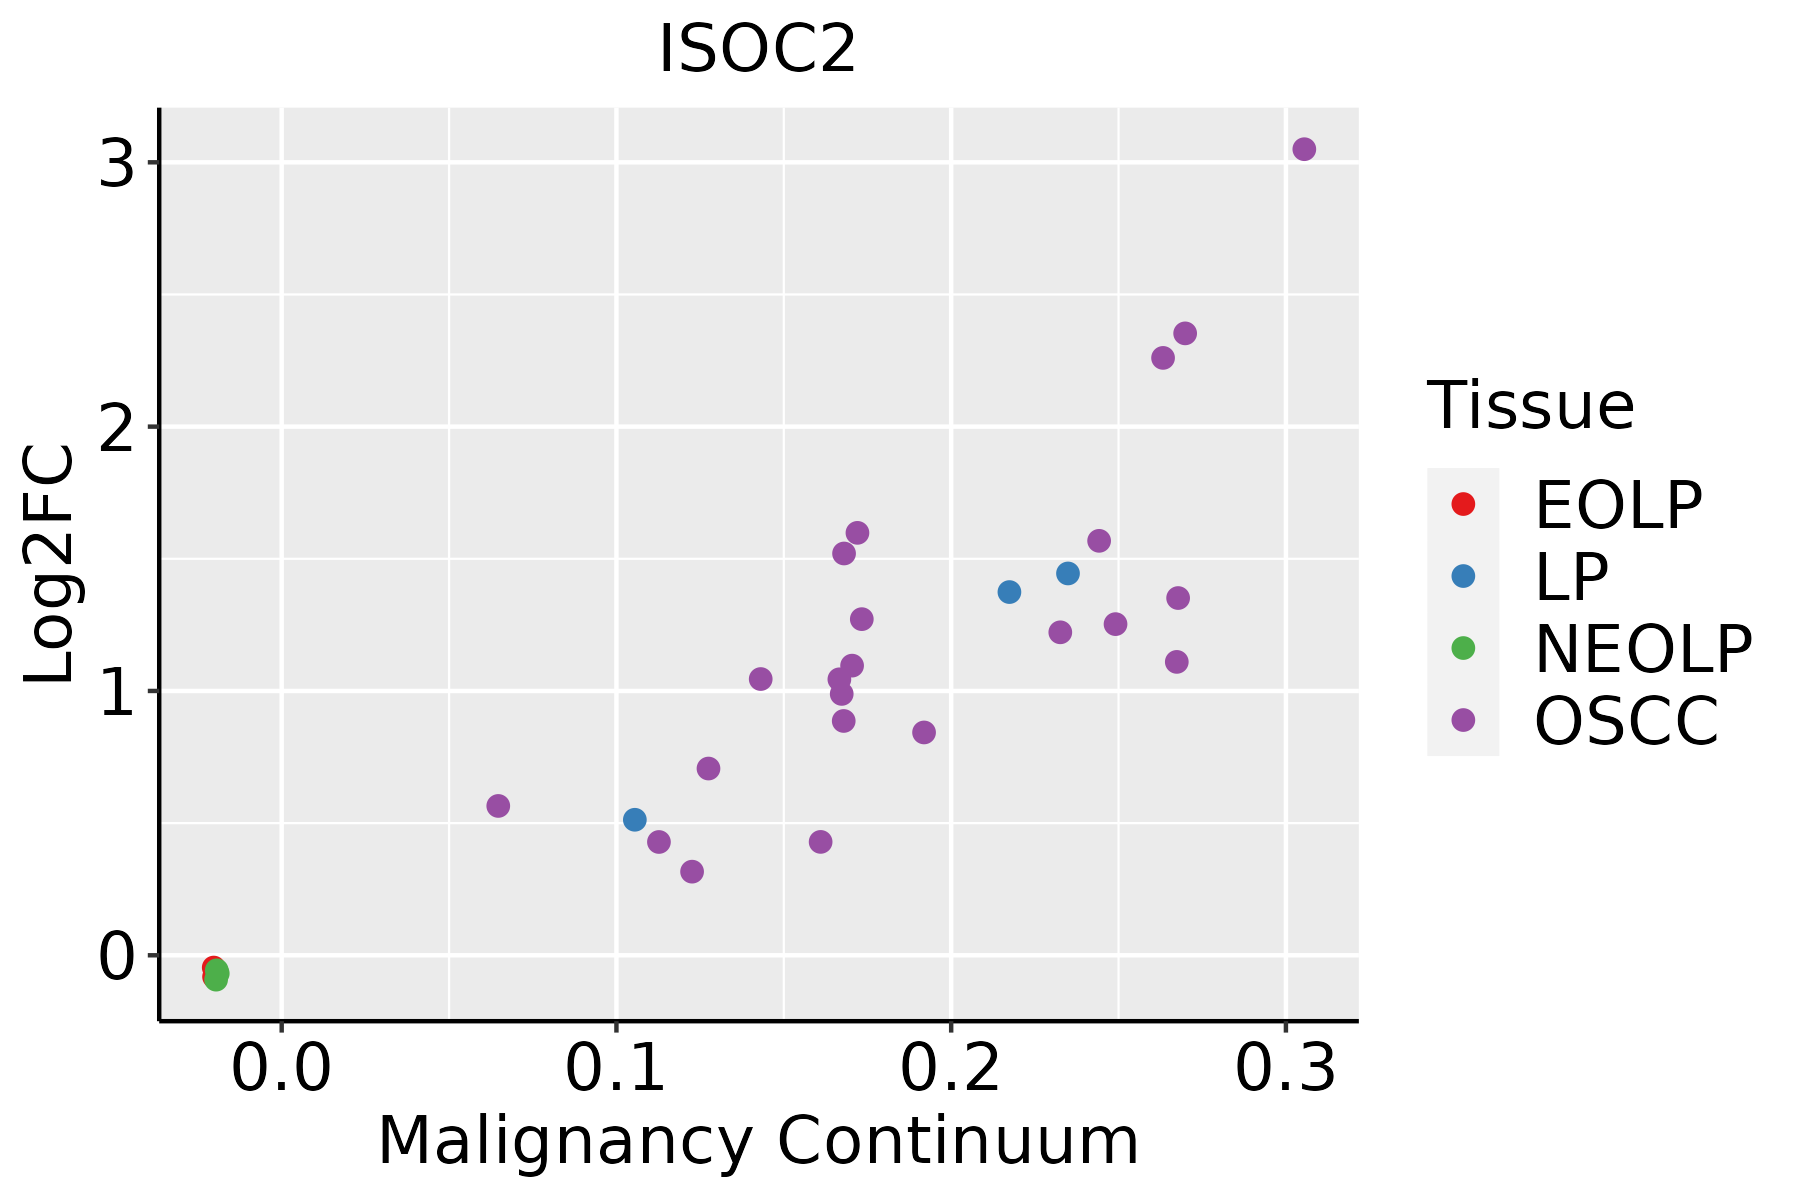 | EOLP: Erosive Oral lichen planus |
| LP: leukoplakia | ||
| NEOLP: Non-erosive oral lichen planus | ||
| OSCC: Oral squamous cell carcinoma | ||
| Skin | 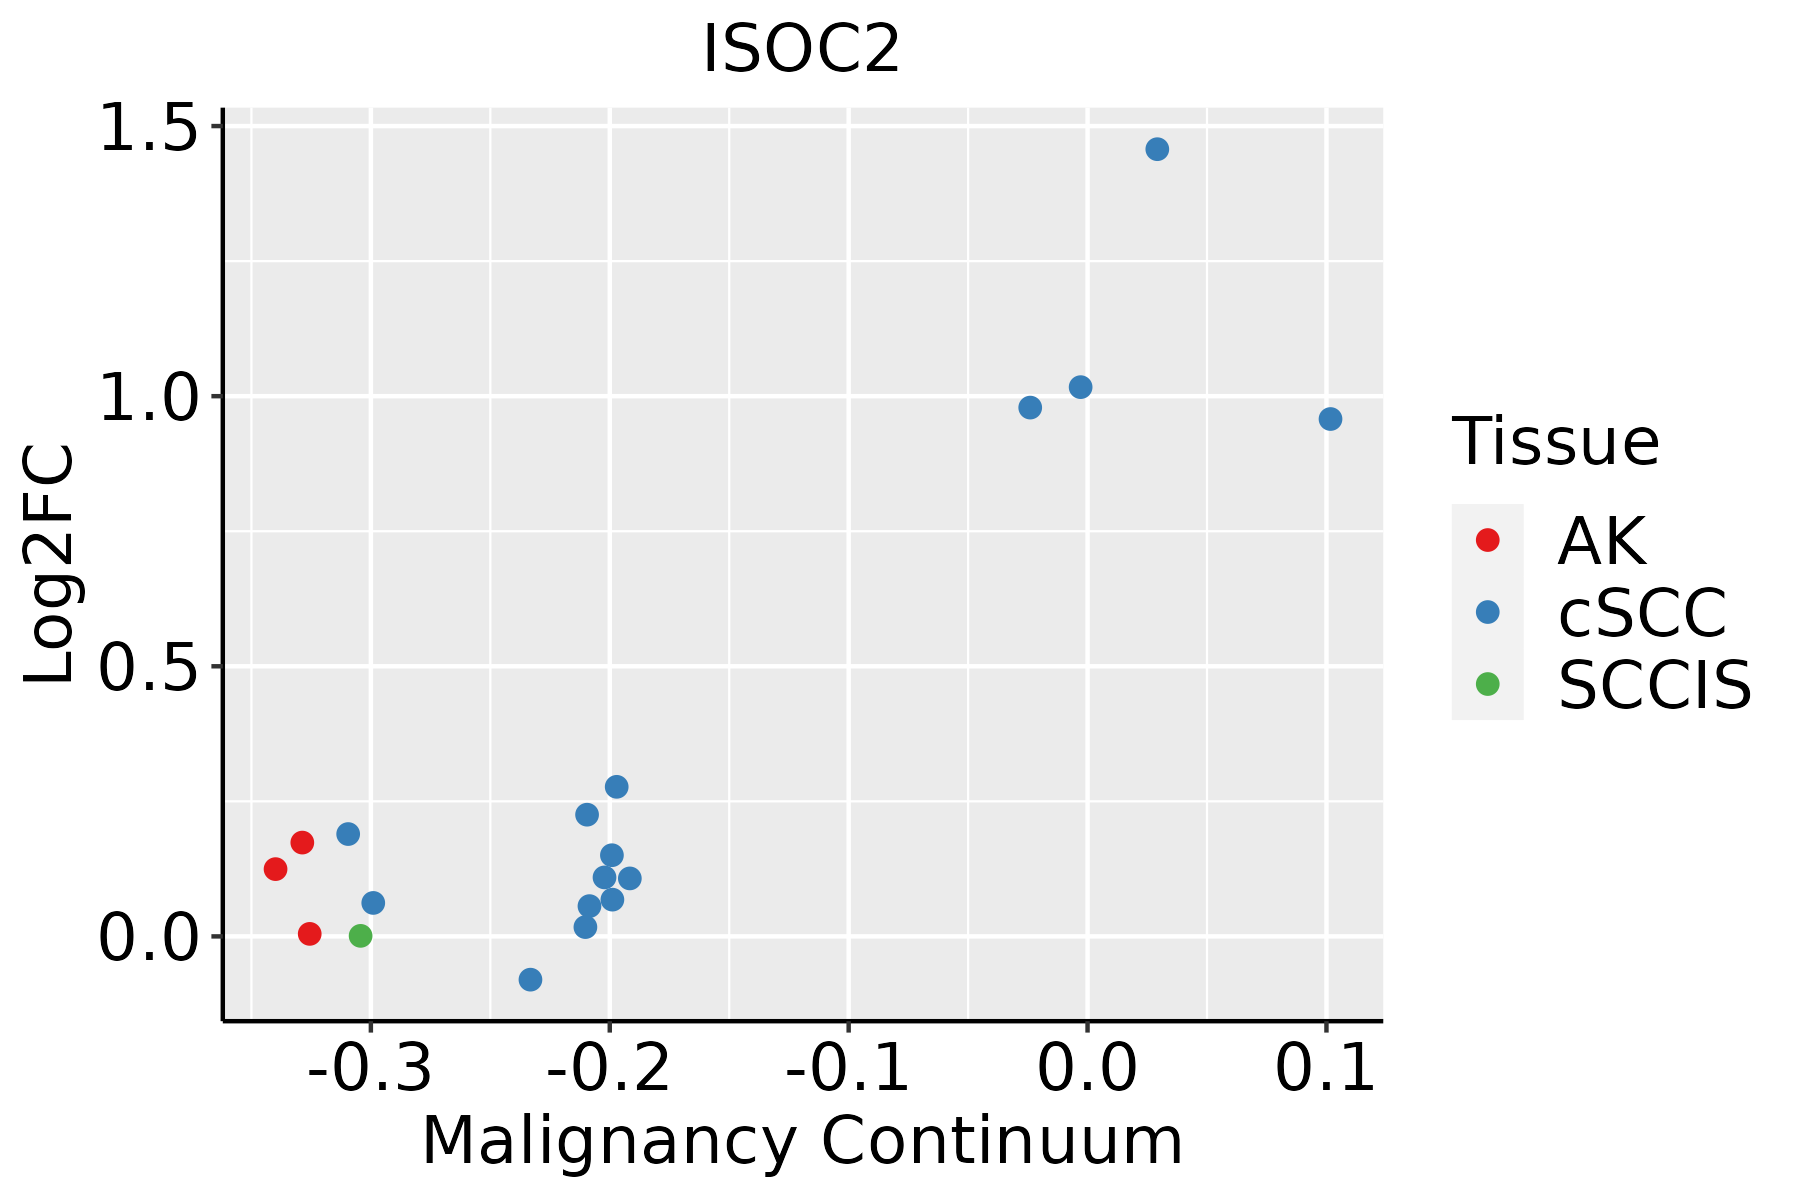 | AK: Actinic keratosis |
| cSCC: Cutaneous squamous cell carcinoma | ||
| SCCIS:squamous cell carcinoma in situ | ||
| Thyroid | 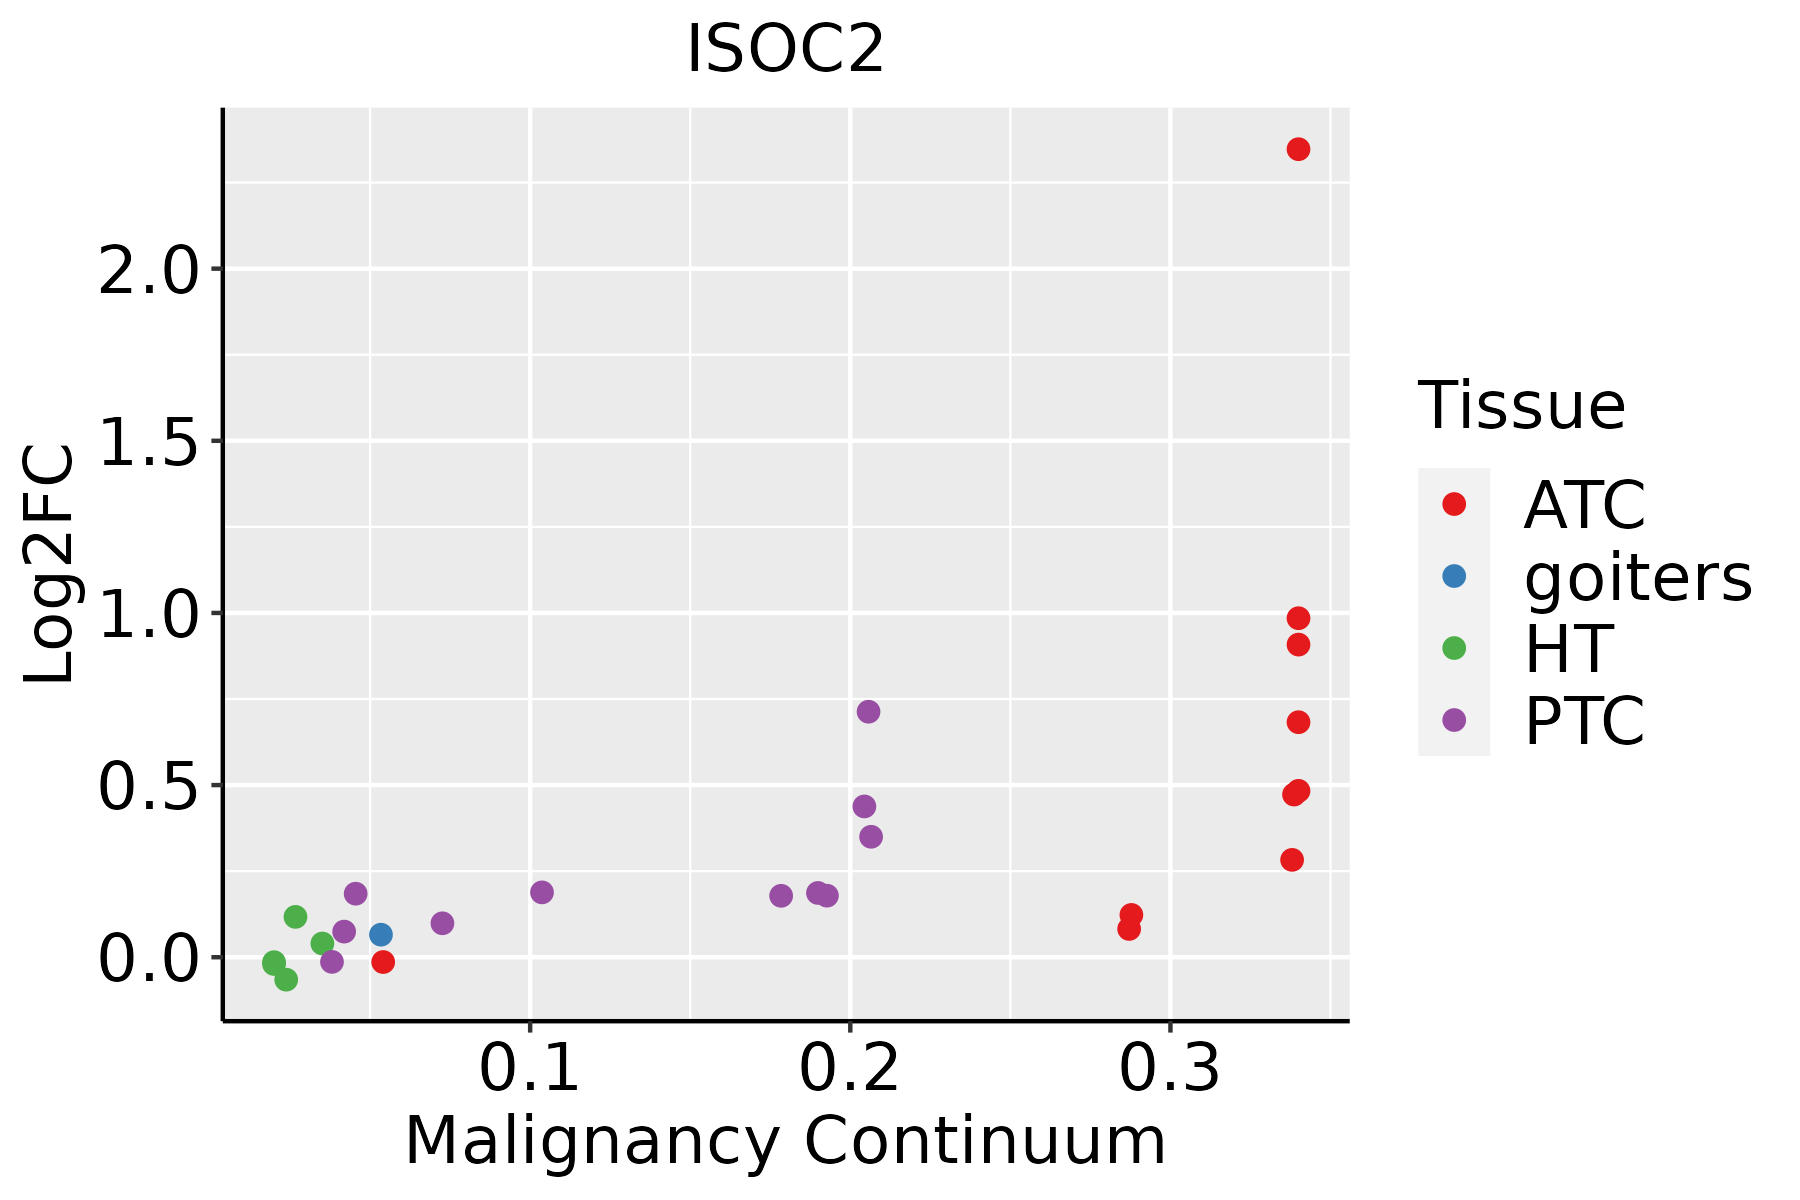 | ATC: Anaplastic thyroid cancer |
| HT: Hashimoto's thyroiditis | ||
| PTC: Papillary thyroid cancer |
| ∗log2FC in expression of this searched gene in stem-like cells from each diseased tissue sample relative to stem-like cells in normal samples in each tissue plotted against the malignancy continuum. Samples are colored based on if they are from different disease stage. |
Top |
Malignant transformation related pathway analysis |
| Find out the enriched GO biological processes and KEGG pathways involved in transition from healthy to precancer to cancer |
| Tissue | Disease Stage | Enriched GO biological Processes |
| Colorectum | AD |  |
| Colorectum | SER |  |
| Colorectum | MSS |  |
| Colorectum | MSI-H |  |
| Colorectum | FAP |  |
| ∗Top 15 enriched GO BP terms are showed in the bar plot of each disease state in each tissue. Each row represents a significant GO biological process which is colored according to the -log10(p.adjust). |
| Page: 1 2 3 4 5 6 7 8 9 |
| GO ID | Tissue | Disease Stage | Description | Gene Ratio | Bg Ratio | pvalue | p.adjust | Count |
| GO:003164714 | Breast | IDC | regulation of protein stability | 50/1434 | 298/18723 | 1.14e-07 | 6.57e-06 | 50 |
| GO:003164724 | Breast | DCIS | regulation of protein stability | 51/1390 | 298/18723 | 1.63e-08 | 1.15e-06 | 51 |
| GO:0031647 | Colorectum | AD | regulation of protein stability | 108/3918 | 298/18723 | 6.33e-10 | 5.08e-08 | 108 |
| GO:00316471 | Colorectum | SER | regulation of protein stability | 86/2897 | 298/18723 | 2.56e-09 | 2.42e-07 | 86 |
| GO:00316472 | Colorectum | MSS | regulation of protein stability | 103/3467 | 298/18723 | 2.52e-11 | 3.49e-09 | 103 |
| GO:003164727 | Esophagus | HGIN | regulation of protein stability | 96/2587 | 298/18723 | 2.21e-16 | 5.76e-14 | 96 |
| GO:0031647111 | Esophagus | ESCC | regulation of protein stability | 223/8552 | 298/18723 | 5.76e-25 | 1.52e-22 | 223 |
| GO:00316486 | Esophagus | ESCC | protein destabilization | 33/8552 | 46/18723 | 3.06e-04 | 1.83e-03 | 33 |
| GO:003164712 | Liver | Cirrhotic | regulation of protein stability | 144/4634 | 298/18723 | 6.74e-19 | 1.28e-16 | 144 |
| GO:00316481 | Liver | Cirrhotic | protein destabilization | 20/4634 | 46/18723 | 4.15e-03 | 2.22e-02 | 20 |
| GO:003164722 | Liver | HCC | regulation of protein stability | 211/7958 | 298/18723 | 2.29e-23 | 5.01e-21 | 211 |
| GO:00316482 | Liver | HCC | protein destabilization | 29/7958 | 46/18723 | 3.95e-03 | 1.74e-02 | 29 |
| GO:003164720 | Oral cavity | OSCC | regulation of protein stability | 193/7305 | 298/18723 | 1.30e-19 | 1.95e-17 | 193 |
| GO:00316485 | Oral cavity | OSCC | protein destabilization | 29/7305 | 46/18723 | 8.26e-04 | 4.38e-03 | 29 |
| GO:0031647110 | Oral cavity | LP | regulation of protein stability | 132/4623 | 298/18723 | 8.16e-14 | 7.99e-12 | 132 |
| GO:003164729 | Skin | cSCC | regulation of protein stability | 144/4864 | 298/18723 | 6.51e-17 | 6.80e-15 | 144 |
| GO:0031647113 | Thyroid | PTC | regulation of protein stability | 174/5968 | 298/18723 | 2.05e-21 | 4.05e-19 | 174 |
| GO:003164734 | Thyroid | ATC | regulation of protein stability | 177/6293 | 298/18723 | 4.08e-20 | 6.46e-18 | 177 |
| Page: 1 |
| Pathway ID | Tissue | Disease Stage | Description | Gene Ratio | Bg Ratio | pvalue | p.adjust | qvalue | Count |
| Page: 1 |
Top |
Cell-cell communication analysis |
| Identification of potential cell-cell interactions between two cell types and their ligand-receptor pairs for different disease states |
| Ligand | Receptor | LRpair | Pathway | Tissue | Disease Stage |
| Page: 1 |
Top |
Single-cell gene regulatory network inference analysis |
| Find out the significant the regulons (TFs) and the target genes of each regulon across cell types for different disease states |
| TF | Cell Type | Tissue | Disease Stage | Target Gene | RSS | Regulon Activity |
| ∗The dot plots of a searched regulon are shown for all cell subpopulations in each disease state of each tissue based on the regulon specific score inferred using pySCENIC and by calculating the average expression. |
| Page: 1 |
Top |
Somatic mutation of malignant transformation related genes |
| Annotation of somatic variants for genes involved in malignant transformation |
| Hugo Symbol | Variant Class | Variant Classification | dbSNP RS | HGVSc | HGVSp | HGVSp Short | SWISSPROT | BIOTYPE | SIFT | PolyPhen | Tumor Sample Barcode | Tissue | Histology | Sex | Age | Stage | Therapy Types | Drugs | Outcome |
| ISOC2 | SNV | Missense_Mutation | c.293N>T | p.Arg98Leu | p.R98L | Q96AB3 | protein_coding | tolerated(0.71) | benign(0.006) | TCGA-A6-5665-01 | Colorectum | colon adenocarcinoma | Female | >=65 | I/II | Unknown | Unknown | PD | |
| ISOC2 | SNV | Missense_Mutation | rs561051209 | c.83G>A | p.Arg28His | p.R28H | Q96AB3 | protein_coding | deleterious(0) | probably_damaging(0.988) | TCGA-AA-A024-01 | Colorectum | colon adenocarcinoma | Male | >=65 | I/II | Unknown | Unknown | SD |
| ISOC2 | SNV | Missense_Mutation | novel | c.622N>A | p.Gly208Arg | p.G208R | Q96AB3 | protein_coding | deleterious(0) | probably_damaging(0.993) | TCGA-AZ-6601-01 | Colorectum | colon adenocarcinoma | Male | >=65 | I/II | Unknown | Unknown | PD |
| ISOC2 | SNV | Missense_Mutation | rs537689871 | c.464N>A | p.Arg155His | p.R155H | Q96AB3 | protein_coding | deleterious(0.02) | benign(0.16) | TCGA-F4-6570-01 | Colorectum | colon adenocarcinoma | Female | >=65 | I/II | Unknown | Unknown | SD |
| ISOC2 | SNV | Missense_Mutation | rs561051209 | c.83G>A | p.Arg28His | p.R28H | Q96AB3 | protein_coding | deleterious(0) | probably_damaging(0.988) | TCGA-AX-A1CE-01 | Endometrium | uterine corpus endometrioid carcinoma | Female | <65 | I/II | Unspecific | Paclitaxel | SD |
| ISOC2 | SNV | Missense_Mutation | novel | c.138N>T | p.Lys46Asn | p.K46N | Q96AB3 | protein_coding | deleterious(0.04) | benign(0.161) | TCGA-AX-A2HC-01 | Endometrium | uterine corpus endometrioid carcinoma | Female | <65 | III/IV | Chemotherapy | paclitaxel | PD |
| ISOC2 | SNV | Missense_Mutation | novel | c.190N>T | p.Gly64Cys | p.G64C | Q96AB3 | protein_coding | deleterious(0) | probably_damaging(0.999) | TCGA-AX-A3FS-01 | Endometrium | uterine corpus endometrioid carcinoma | Female | >=65 | I/II | Unknown | Unknown | SD |
| ISOC2 | SNV | Missense_Mutation | novel | c.398N>G | p.Asn133Ser | p.N133S | Q96AB3 | protein_coding | tolerated(0.26) | benign(0.003) | TCGA-D1-A103-01 | Endometrium | uterine corpus endometrioid carcinoma | Female | >=65 | I/II | Unknown | Unknown | SD |
| ISOC2 | SNV | Missense_Mutation | c.535N>T | p.Gly179Trp | p.G179W | Q96AB3 | protein_coding | deleterious(0.01) | probably_damaging(0.915) | TCGA-DF-A2KU-01 | Endometrium | uterine corpus endometrioid carcinoma | Female | Unknown | I/II | Unknown | Unknown | SD | |
| ISOC2 | SNV | Missense_Mutation | novel | c.646N>A | p.Gln216Lys | p.Q216K | Q96AB3 | protein_coding | tolerated_low_confidence(0.16) | benign(0.007) | TCGA-FI-A2D6-01 | Endometrium | uterine corpus endometrioid carcinoma | Female | >=65 | I/II | Unknown | Unknown | SD |
| Page: 1 2 |
Top |
Related drugs of malignant transformation related genes |
| Identification of chemicals and drugs interact with genes involved in malignant transfromation |
| (DGIdb 4.0) |
| Entrez ID | Symbol | Category | Interaction Types | Drug Claim Name | Drug Name | PMIDs |
| Page: 1 |

Copyright 2023-Present -The University of Texas Health Science Center at Houston |