
|
|||||
|
 | |
| |
| |
| |
| |
| |
|
Gene: ISG20 |
Gene summary for ISG20 |
| Gene information | Species | Human | Gene symbol | ISG20 | Gene ID | 3669 |
| Gene name | interferon stimulated exonuclease gene 20 | |
| Gene Alias | CD25 | |
| Cytomap | 15q26.1 | |
| Gene Type | protein-coding | GO ID | GO:0000738 | UniProtAcc | Q96AZ6 |
Top |
Malignant transformation analysis |
| Identification of the aberrant gene expression in precancerous and cancerous lesions by comparing the gene expression of stem-like cells in diseased tissues with normal stem cells |
| Entrez ID | Symbol | Replicates | Species | Organ | Tissue | Adj P-value | Log2FC | Malignancy |
| 3669 | ISG20 | Pat11-B | Human | Stomach | GC | 7.06e-09 | -2.07e-01 | -0.182 |
| 3669 | ISG20 | Pat12-B | Human | Stomach | GC | 3.33e-11 | -1.44e-01 | 0.0325 |
| 3669 | ISG20 | Pat15-B | Human | Stomach | GC | 2.92e-11 | -2.09e-01 | -0.0778 |
| 3669 | ISG20 | Pat16-B | Human | Stomach | GC | 2.86e-05 | -3.72e-01 | 0.1918 |
| 3669 | ISG20 | Pat18-B | Human | Stomach | GC | 4.35e-10 | -3.05e-01 | -0.0432 |
| 3669 | ISG20 | Pat19-B | Human | Stomach | GC | 1.01e-04 | -2.37e-01 | 0.0826 |
| 3669 | ISG20 | Pat22-B | Human | Stomach | GC | 7.87e-19 | 1.96e-02 | -0.1042 |
| 3669 | ISG20 | Pat24-B | Human | Stomach | GC | 9.12e-05 | -5.38e-02 | -0.1184 |
| 3669 | ISG20 | Pat25-A | Human | Stomach | CAG with IM | 1.59e-25 | -4.69e-01 | -0.1648 |
| 3669 | ISG20 | Pat26-A | Human | Stomach | CSG | 7.32e-34 | -4.48e-01 | -0.2402 |
| 3669 | ISG20 | Pat28-A | Human | Stomach | CSG | 3.76e-14 | -2.45e-01 | -0.2594 |
| 3669 | ISG20 | Pat29-A | Human | Stomach | CAG with IM | 4.18e-04 | -2.92e-01 | -0.2769 |
| 3669 | ISG20 | NAG_2 | Human | Stomach | CSG | 2.02e-06 | 2.73e-01 | -0.3324 |
| 3669 | ISG20 | CAG_2 | Human | Stomach | CAG | 1.06e-03 | -5.09e-01 | -0.2831 |
| 3669 | ISG20 | CAG_3 | Human | Stomach | CAG | 5.67e-04 | -2.84e-01 | -0.2766 |
| 3669 | ISG20 | SIM_1 | Human | Stomach | SIM | 1.15e-02 | 1.64e-01 | 0.3573 |
| 3669 | ISG20 | SIM_2 | Human | Stomach | SIM | 1.28e-04 | -2.26e-01 | 0.3139 |
| 3669 | ISG20 | SIM_3 | Human | Stomach | SIM | 6.31e-03 | -6.04e-01 | 0.0345 |
| 3669 | ISG20 | EGC | Human | Stomach | GC | 4.62e-08 | -5.80e-01 | 0.1683 |
| 3669 | ISG20 | male-WTA | Human | Thyroid | PTC | 2.44e-11 | -1.44e-02 | 0.1037 |
| Page: 1 2 3 4 5 6 7 8 |
| Tissue | Expression Dynamics | Abbreviation |
| Cervix | 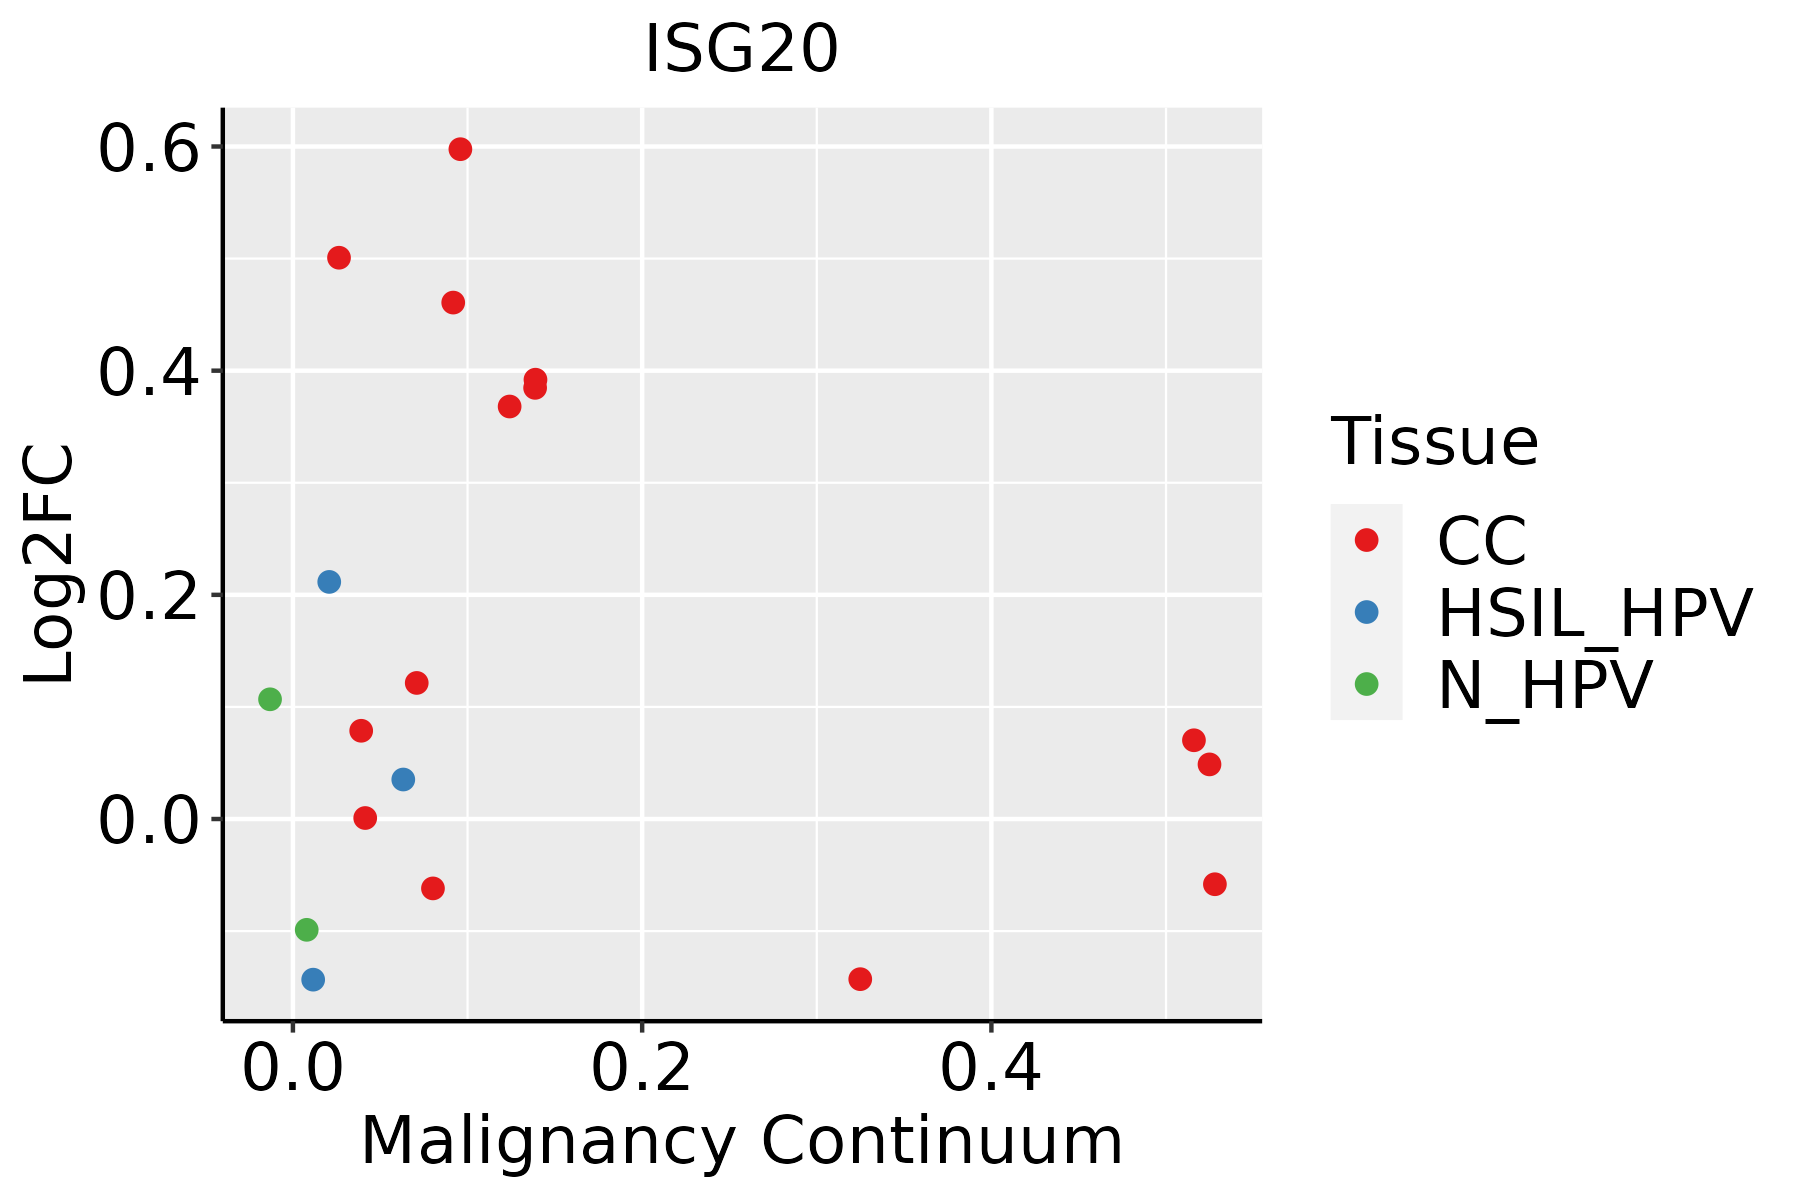 | CC: Cervix cancer |
| HSIL_HPV: HPV-infected high-grade squamous intraepithelial lesions | ||
| N_HPV: HPV-infected normal cervix | ||
| Colorectum (GSE201348) |  | FAP: Familial adenomatous polyposis |
| CRC: Colorectal cancer | ||
| Colorectum (HTA11) |  | AD: Adenomas |
| SER: Sessile serrated lesions | ||
| MSI-H: Microsatellite-high colorectal cancer | ||
| MSS: Microsatellite stable colorectal cancer | ||
| Endometrium |  | AEH: Atypical endometrial hyperplasia |
| EEC: Endometrioid Cancer | ||
| Esophagus |  | ESCC: Esophageal squamous cell carcinoma |
| HGIN: High-grade intraepithelial neoplasias | ||
| LGIN: Low-grade intraepithelial neoplasias | ||
| GC | 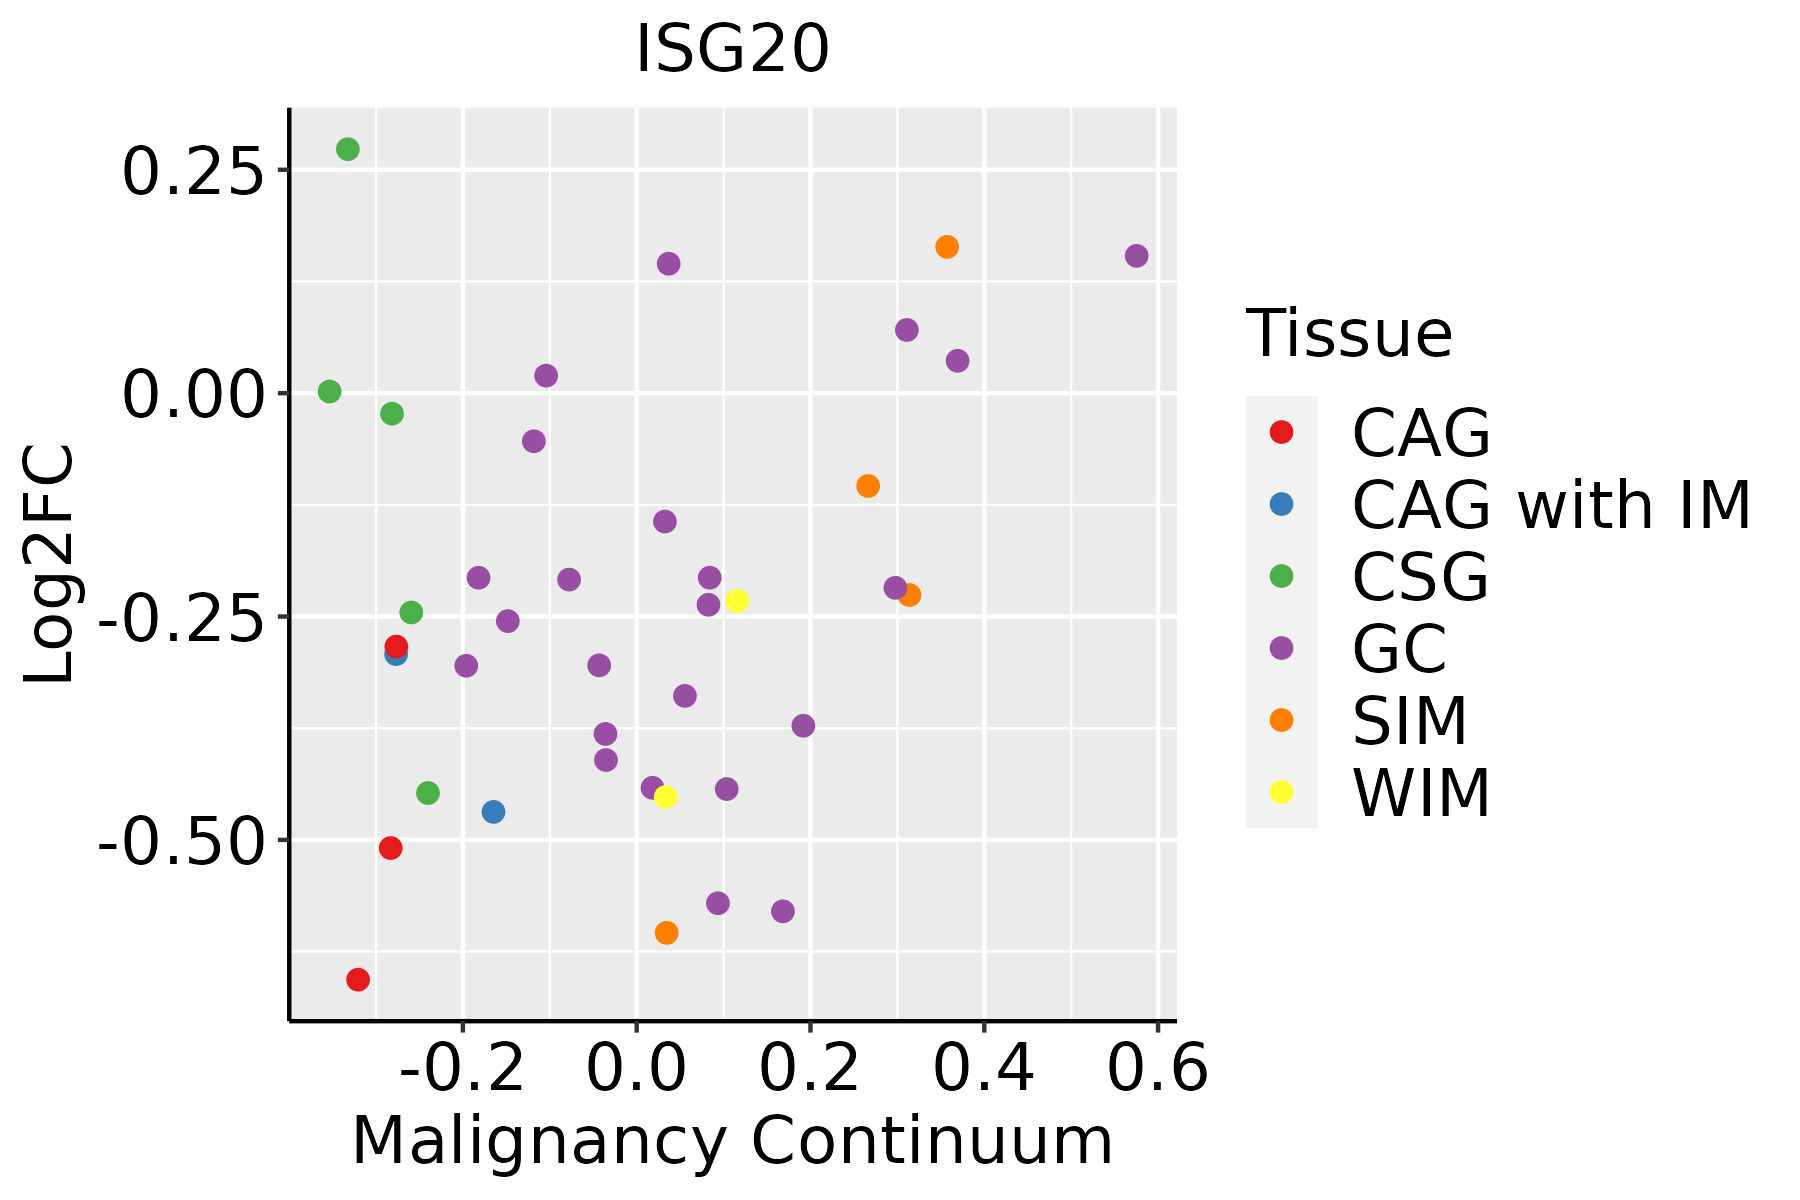 | CAG: Chronic atrophic gastritis |
| CAG with IM: Chronic atrophic gastritis with intestinal metaplasia | ||
| CSG: Chronic superficial gastritis | ||
| GC: Gastric cancer | ||
| SIM: Severe intestinal metaplasia | ||
| WIM: Wild intestinal metaplasia | ||
| Liver | 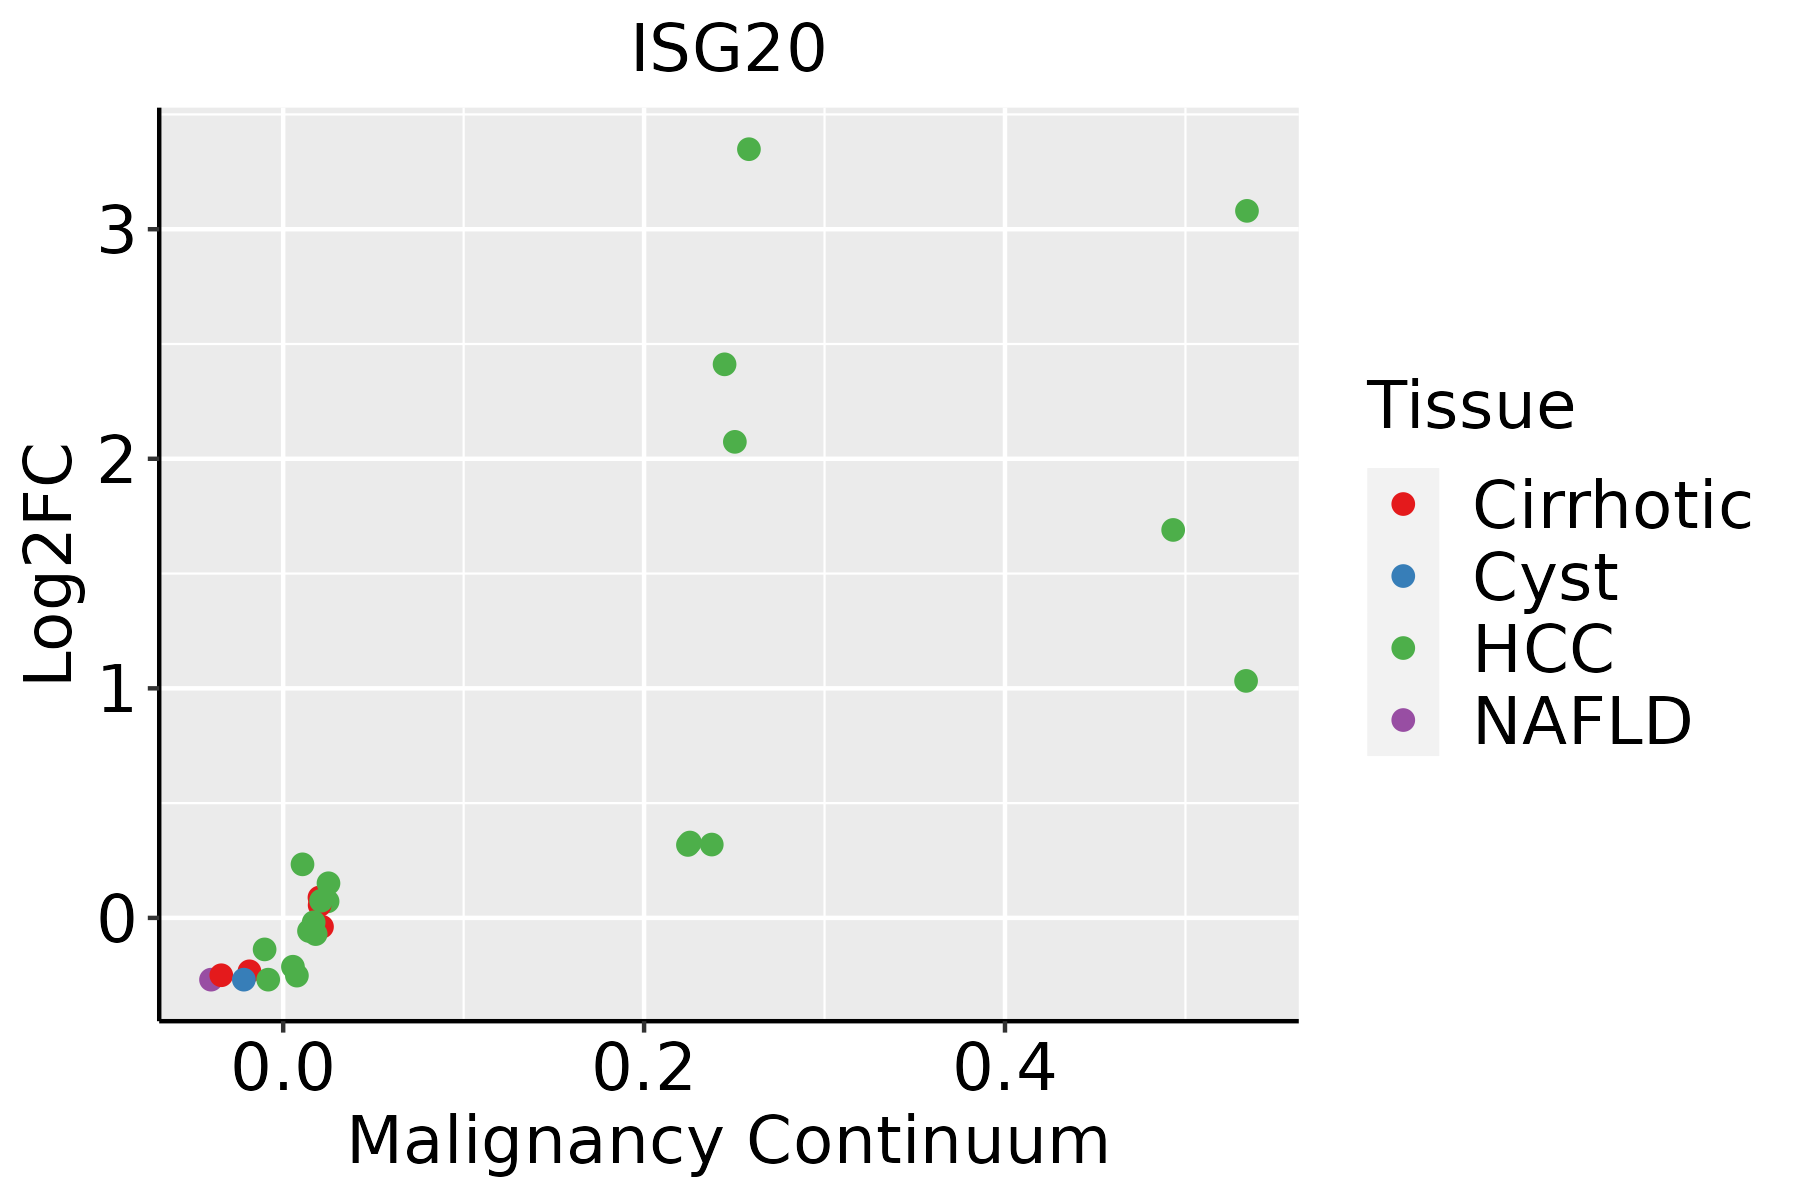 | HCC: Hepatocellular carcinoma |
| NAFLD: Non-alcoholic fatty liver disease | ||
| Oral Cavity | 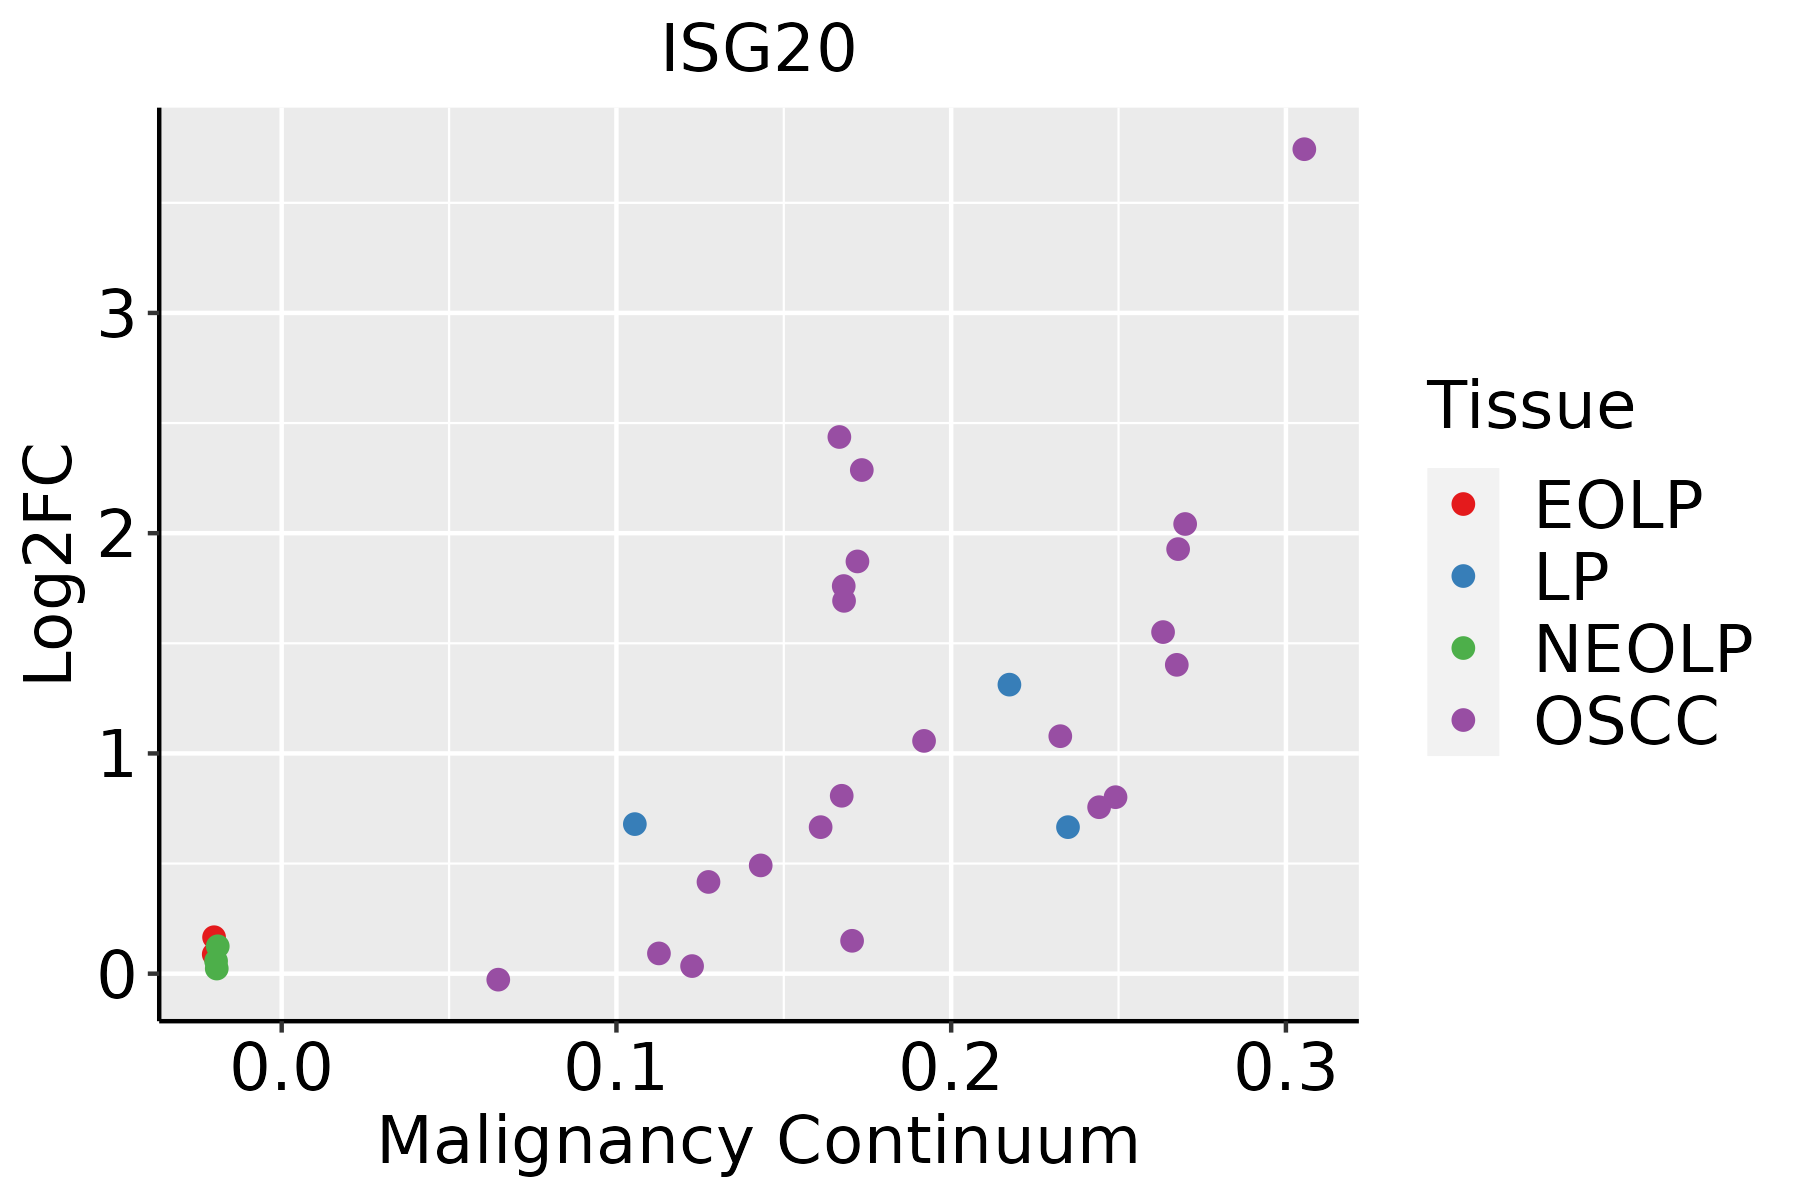 | EOLP: Erosive Oral lichen planus |
| LP: leukoplakia | ||
| NEOLP: Non-erosive oral lichen planus | ||
| OSCC: Oral squamous cell carcinoma | ||
| Prostate | 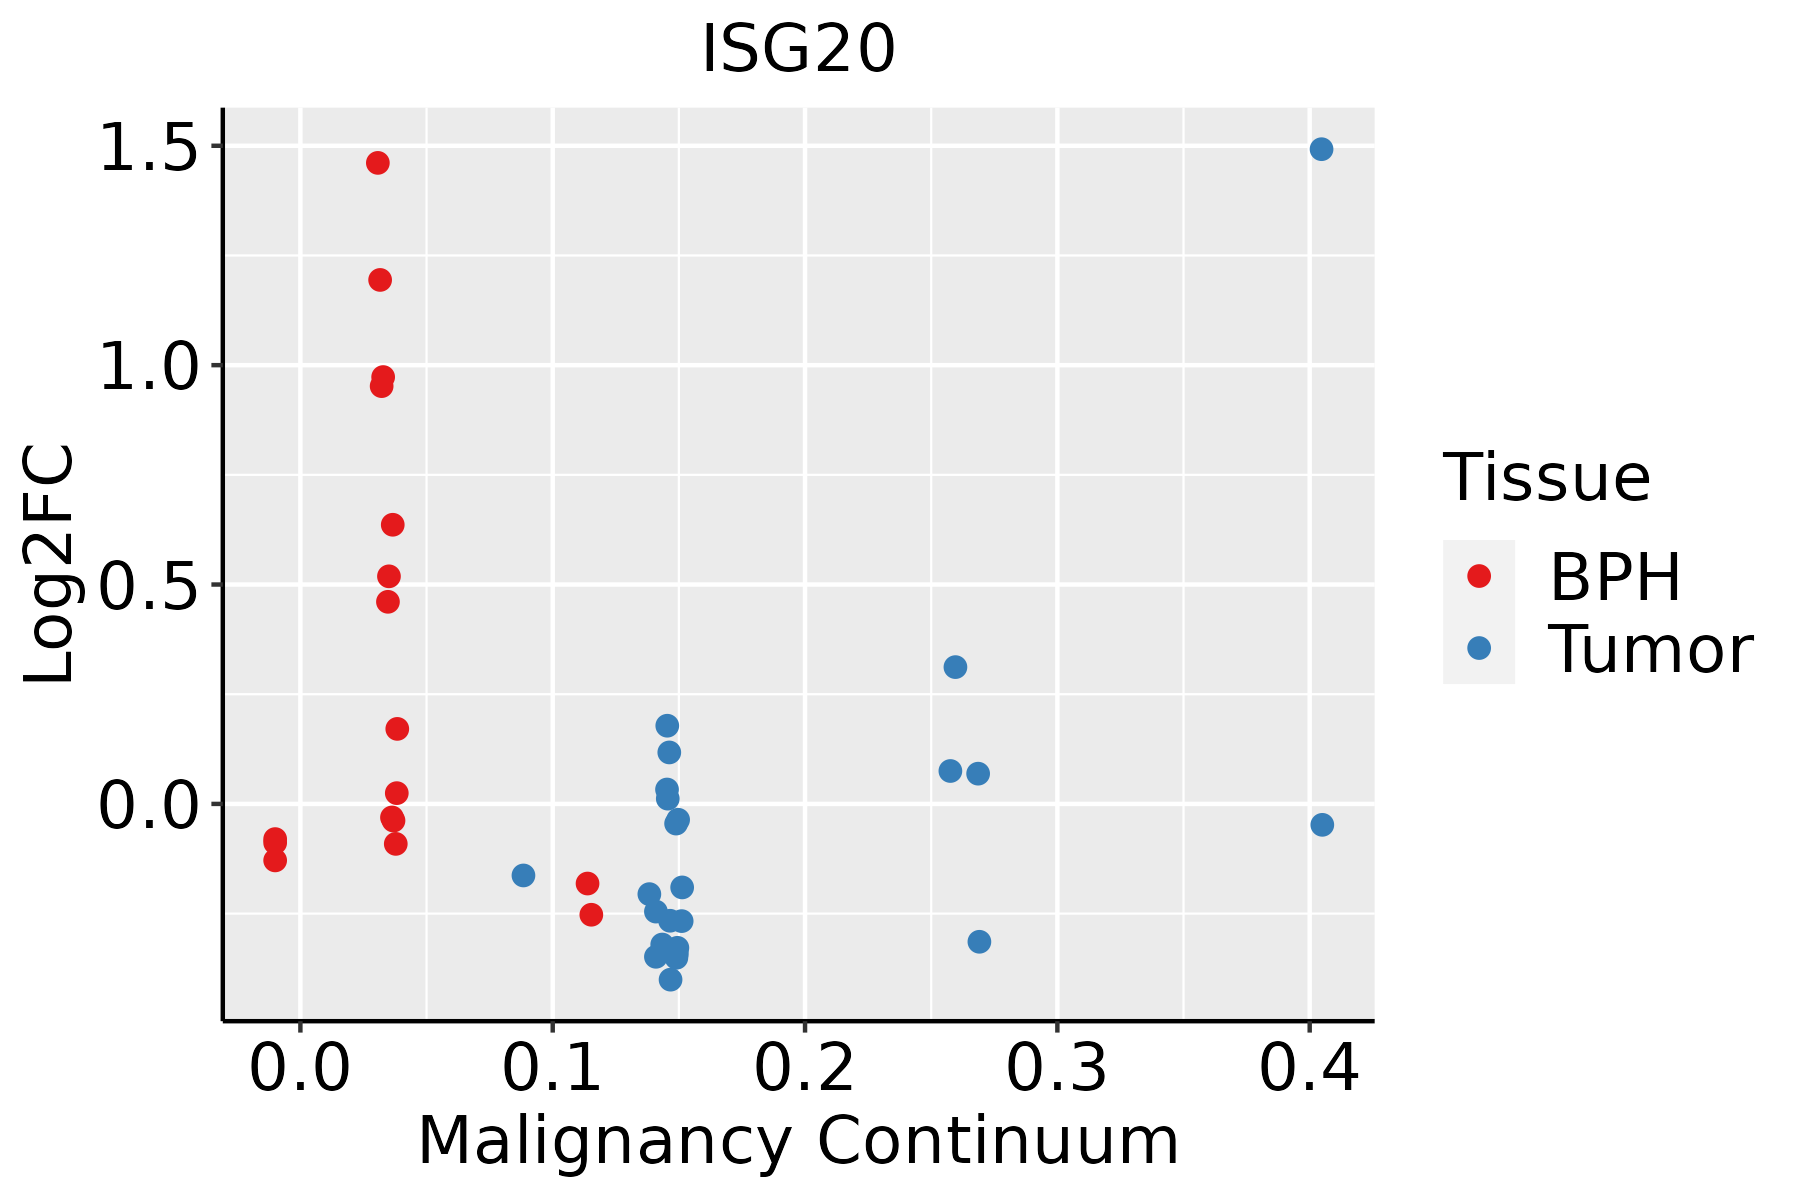 | BPH: Benign Prostatic Hyperplasia |
| Thyroid | 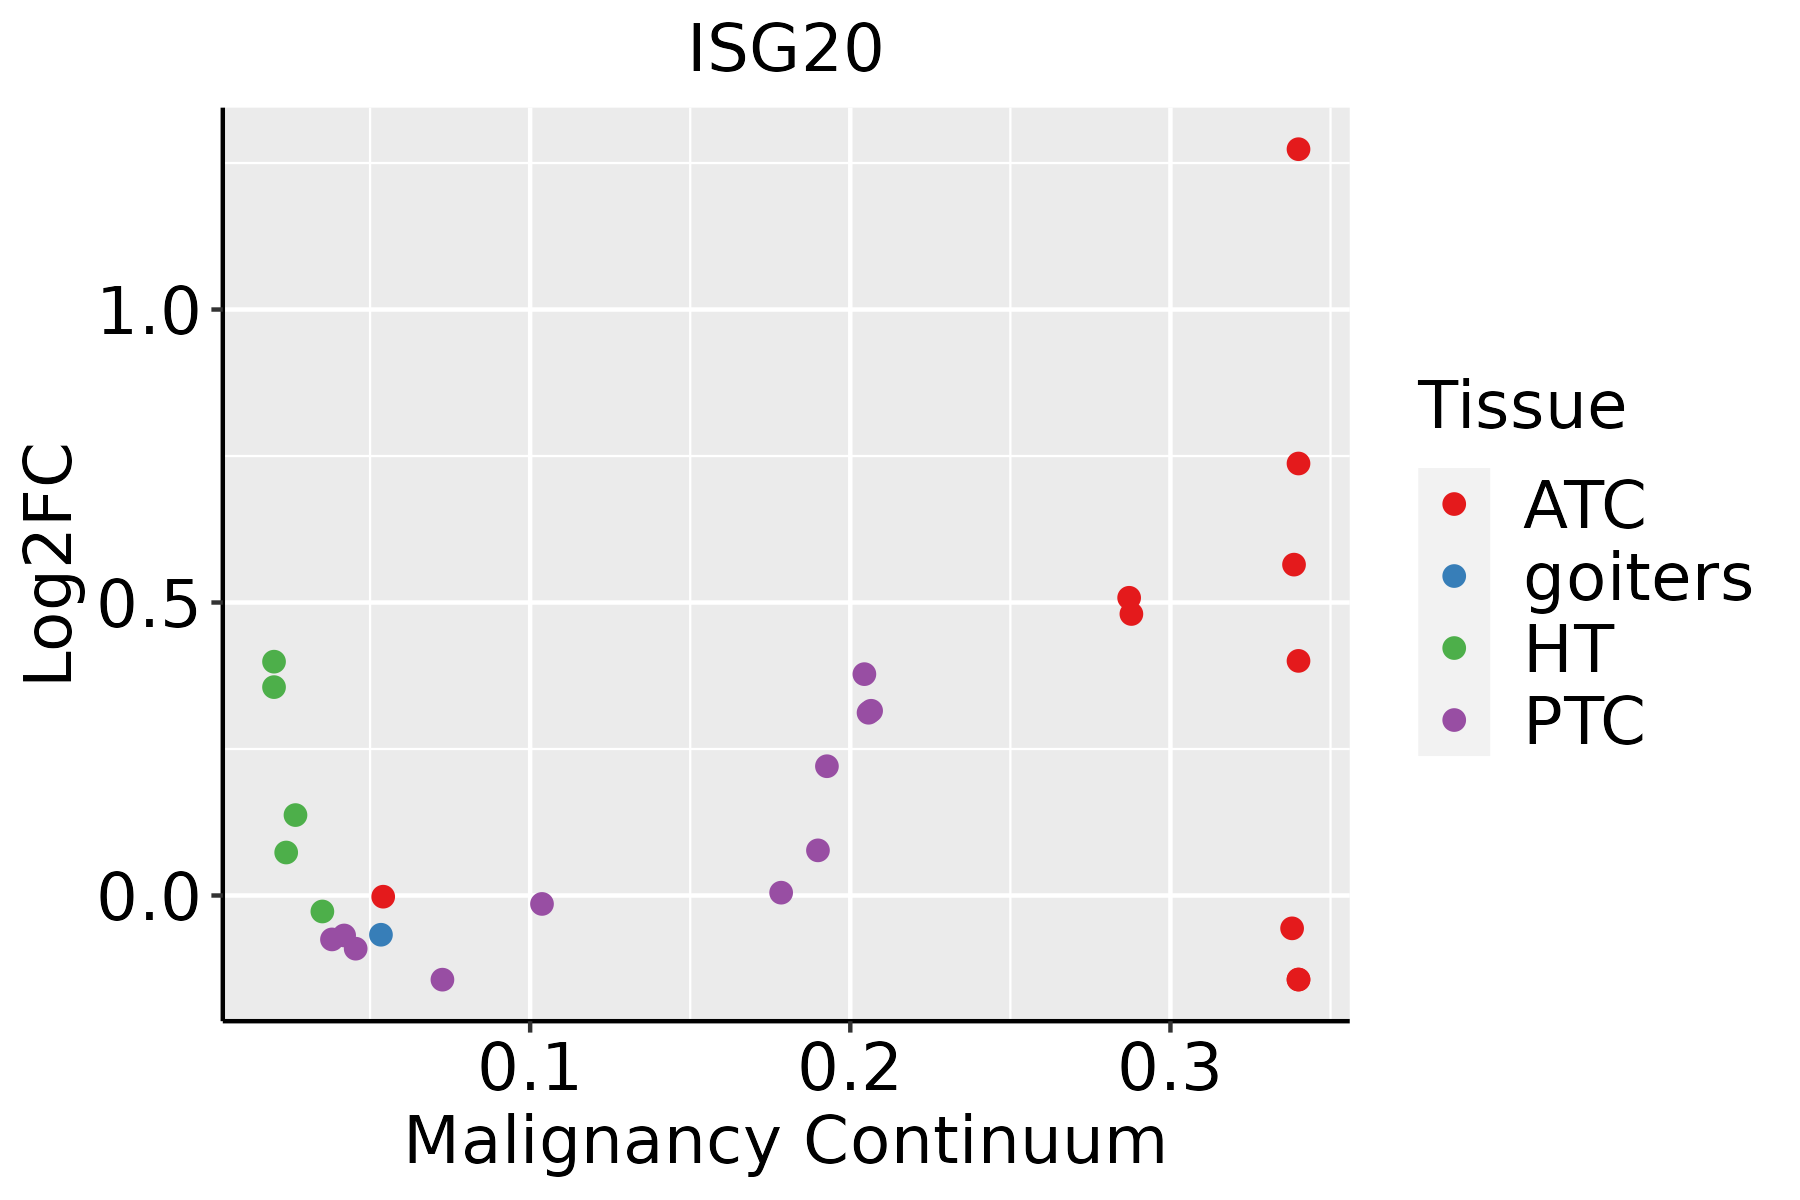 | ATC: Anaplastic thyroid cancer |
| HT: Hashimoto's thyroiditis | ||
| PTC: Papillary thyroid cancer |
| ∗log2FC in expression of this searched gene in stem-like cells from each diseased tissue sample relative to stem-like cells in normal samples in each tissue plotted against the malignancy continuum. Samples are colored based on if they are from different disease stage. |
Top |
Malignant transformation related pathway analysis |
| Find out the enriched GO biological processes and KEGG pathways involved in transition from healthy to precancer to cancer |
| Tissue | Disease Stage | Enriched GO biological Processes |
| Colorectum | AD |  |
| Colorectum | SER |  |
| Colorectum | MSS |  |
| Colorectum | MSI-H |  |
| Colorectum | FAP |  |
| ∗Top 15 enriched GO BP terms are showed in the bar plot of each disease state in each tissue. Each row represents a significant GO biological process which is colored according to the -log10(p.adjust). |
| Page: 1 2 3 4 5 6 7 8 9 |
| GO ID | Tissue | Disease Stage | Description | Gene Ratio | Bg Ratio | pvalue | p.adjust | Count |
| GO:001603210 | Cervix | CC | viral process | 109/2311 | 415/18723 | 5.40e-15 | 6.46e-12 | 109 |
| GO:001905810 | Cervix | CC | viral life cycle | 87/2311 | 317/18723 | 2.20e-13 | 1.20e-10 | 87 |
| GO:00064019 | Cervix | CC | RNA catabolic process | 62/2311 | 278/18723 | 2.18e-06 | 6.56e-05 | 62 |
| GO:001907910 | Cervix | CC | viral genome replication | 35/2311 | 131/18723 | 6.11e-06 | 1.49e-04 | 35 |
| GO:002261310 | Cervix | CC | ribonucleoprotein complex biogenesis | 88/2311 | 463/18723 | 2.11e-05 | 3.82e-04 | 88 |
| GO:00096158 | Cervix | CC | response to virus | 73/2311 | 367/18723 | 2.22e-05 | 3.95e-04 | 73 |
| GO:004225410 | Cervix | CC | ribosome biogenesis | 62/2311 | 299/18723 | 2.48e-05 | 4.27e-04 | 62 |
| GO:005079210 | Cervix | CC | regulation of viral process | 38/2311 | 164/18723 | 8.12e-05 | 1.10e-03 | 38 |
| GO:00467008 | Cervix | CC | heterocycle catabolic process | 80/2311 | 445/18723 | 3.23e-04 | 3.42e-03 | 80 |
| GO:00346559 | Cervix | CC | nucleobase-containing compound catabolic process | 74/2311 | 407/18723 | 3.77e-04 | 3.88e-03 | 74 |
| GO:190390010 | Cervix | CC | regulation of viral life cycle | 33/2311 | 148/18723 | 4.86e-04 | 4.76e-03 | 33 |
| GO:00485256 | Cervix | CC | negative regulation of viral process | 23/2311 | 92/18723 | 6.39e-04 | 5.97e-03 | 23 |
| GO:00442709 | Cervix | CC | cellular nitrogen compound catabolic process | 79/2311 | 451/18723 | 7.80e-04 | 6.91e-03 | 79 |
| GO:00450698 | Cervix | CC | regulation of viral genome replication | 21/2311 | 85/18723 | 1.27e-03 | 1.01e-02 | 21 |
| GO:00194398 | Cervix | CC | aromatic compound catabolic process | 79/2311 | 467/18723 | 2.14e-03 | 1.54e-02 | 79 |
| GO:00450714 | Cervix | CC | negative regulation of viral genome replication | 15/2311 | 56/18723 | 2.60e-03 | 1.80e-02 | 15 |
| GO:19013618 | Cervix | CC | organic cyclic compound catabolic process | 80/2311 | 495/18723 | 6.77e-03 | 3.72e-02 | 80 |
| GO:00160727 | Cervix | CC | rRNA metabolic process | 42/2311 | 236/18723 | 9.12e-03 | 4.60e-02 | 42 |
| GO:00516072 | Cervix | CC | defense response to virus | 46/2311 | 265/18723 | 1.04e-02 | 4.97e-02 | 46 |
| GO:01405462 | Cervix | CC | defense response to symbiont | 46/2311 | 265/18723 | 1.04e-02 | 4.97e-02 | 46 |
| Page: 1 2 3 4 5 6 7 8 9 10 11 12 13 14 15 16 17 18 19 |
| Pathway ID | Tissue | Disease Stage | Description | Gene Ratio | Bg Ratio | pvalue | p.adjust | qvalue | Count |
| Page: 1 |
Top |
Cell-cell communication analysis |
| Identification of potential cell-cell interactions between two cell types and their ligand-receptor pairs for different disease states |
| Ligand | Receptor | LRpair | Pathway | Tissue | Disease Stage |
| Page: 1 |
Top |
Single-cell gene regulatory network inference analysis |
| Find out the significant the regulons (TFs) and the target genes of each regulon across cell types for different disease states |
| TF | Cell Type | Tissue | Disease Stage | Target Gene | RSS | Regulon Activity |
| ∗The dot plots of a searched regulon are shown for all cell subpopulations in each disease state of each tissue based on the regulon specific score inferred using pySCENIC and by calculating the average expression. |
| Page: 1 |
Top |
Somatic mutation of malignant transformation related genes |
| Annotation of somatic variants for genes involved in malignant transformation |
| Hugo Symbol | Variant Class | Variant Classification | dbSNP RS | HGVSc | HGVSp | HGVSp Short | SWISSPROT | BIOTYPE | SIFT | PolyPhen | Tumor Sample Barcode | Tissue | Histology | Sex | Age | Stage | Therapy Types | Drugs | Outcome |
| ISG20 | SNV | Missense_Mutation | rs371941091 | c.182N>A | p.Pro61His | p.P61H | Q96AZ6 | protein_coding | tolerated(0.08) | benign(0.222) | TCGA-A6-3809-01 | Colorectum | colon adenocarcinoma | Female | >=65 | I/II | Unknown | Unknown | SD |
| ISG20 | SNV | Missense_Mutation | novel | c.439N>T | p.Leu147Phe | p.L147F | Q96AZ6 | protein_coding | tolerated(0.07) | benign(0.003) | TCGA-AA-3947-01 | Colorectum | colon adenocarcinoma | Female | <65 | I/II | Unknown | Unknown | SD |
| ISG20 | SNV | Missense_Mutation | rs549880749 | c.353N>A | p.Arg118His | p.R118H | Q96AZ6 | protein_coding | tolerated(0.2) | benign(0.006) | TCGA-AG-3731-01 | Colorectum | rectum adenocarcinoma | Male | >=65 | III/IV | Chemotherapy | folinic | PR |
| ISG20 | SNV | Missense_Mutation | rs149381576 | c.380G>A | p.Arg127His | p.R127H | Q96AZ6 | protein_coding | tolerated(0.14) | benign(0.148) | TCGA-AP-A051-01 | Endometrium | uterine corpus endometrioid carcinoma | Female | >=65 | I/II | Unknown | Unknown | SD |
| ISG20 | SNV | Missense_Mutation | c.209N>G | p.Phe70Cys | p.F70C | Q96AZ6 | protein_coding | deleterious(0) | probably_damaging(0.999) | TCGA-AP-A056-01 | Endometrium | uterine corpus endometrioid carcinoma | Female | <65 | I/II | Unknown | Unknown | SD | |
| ISG20 | SNV | Missense_Mutation | c.325N>A | p.Asp109Asn | p.D109N | Q96AZ6 | protein_coding | deleterious(0) | probably_damaging(0.997) | TCGA-AX-A0J1-01 | Endometrium | uterine corpus endometrioid carcinoma | Female | >=65 | I/II | Unknown | Unknown | SD | |
| ISG20 | SNV | Missense_Mutation | rs772920253 | c.329C>T | p.Thr110Met | p.T110M | Q96AZ6 | protein_coding | deleterious(0) | probably_damaging(1) | TCGA-AX-A1CE-01 | Endometrium | uterine corpus endometrioid carcinoma | Female | <65 | I/II | Unspecific | Paclitaxel | SD |
| ISG20 | SNV | Missense_Mutation | novel | c.464N>T | p.Ala155Val | p.A155V | Q96AZ6 | protein_coding | deleterious(0) | probably_damaging(0.998) | TCGA-B5-A3FC-01 | Endometrium | uterine corpus endometrioid carcinoma | Female | <65 | I/II | Unknown | Unknown | SD |
| ISG20 | SNV | Missense_Mutation | rs760289978 | c.406N>T | p.Arg136Cys | p.R136C | Q96AZ6 | protein_coding | deleterious(0.01) | possibly_damaging(0.882) | TCGA-EY-A549-01 | Endometrium | uterine corpus endometrioid carcinoma | Female | >=65 | I/II | Unknown | Unknown | SD |
| ISG20 | SNV | Missense_Mutation | novel | c.378N>C | p.Arg126Ser | p.R126S | Q96AZ6 | protein_coding | tolerated(0.52) | benign(0.014) | TCGA-69-8254-01 | Lung | lung adenocarcinoma | Male | >=65 | I/II | Unknown | Unknown | SD |
| Page: 1 2 |
Top |
Related drugs of malignant transformation related genes |
| Identification of chemicals and drugs interact with genes involved in malignant transfromation |
| (DGIdb 4.0) |
| Entrez ID | Symbol | Category | Interaction Types | Drug Claim Name | Drug Name | PMIDs |
| Page: 1 |

Copyright 2023-Present -The University of Texas Health Science Center at Houston |