
|
|||||
|
 | |
| |
| |
| |
| |
| |
|
Gene: HACD3 |
Gene summary for HACD3 |
| Gene information | Species | Human | Gene symbol | HACD3 | Gene ID | 51495 |
| Gene name | 3-hydroxyacyl-CoA dehydratase 3 | |
| Gene Alias | B-IND1 | |
| Cytomap | 15q22.31 | |
| Gene Type | protein-coding | GO ID | GO:0000038 | UniProtAcc | Q9P035 |
Top |
Malignant transformation analysis |
| Identification of the aberrant gene expression in precancerous and cancerous lesions by comparing the gene expression of stem-like cells in diseased tissues with normal stem cells |
| Entrez ID | Symbol | Replicates | Species | Organ | Tissue | Adj P-value | Log2FC | Malignancy |
| 51495 | HACD3 | SYSMH4 | Human | Oral cavity | OSCC | 9.28e-07 | 1.29e-01 | 0.1226 |
| 51495 | HACD3 | SYSMH5 | Human | Oral cavity | OSCC | 2.42e-11 | 4.09e-01 | 0.0647 |
| 51495 | HACD3 | SYSMH6 | Human | Oral cavity | OSCC | 3.72e-08 | 4.38e-01 | 0.1275 |
| 51495 | HACD3 | male-WTA | Human | Thyroid | PTC | 6.34e-61 | 6.15e-01 | 0.1037 |
| 51495 | HACD3 | PTC01 | Human | Thyroid | PTC | 2.10e-28 | 1.03e+00 | 0.1899 |
| 51495 | HACD3 | PTC04 | Human | Thyroid | PTC | 3.43e-22 | 8.72e-01 | 0.1927 |
| 51495 | HACD3 | PTC05 | Human | Thyroid | PTC | 4.13e-30 | 1.48e+00 | 0.2065 |
| 51495 | HACD3 | PTC06 | Human | Thyroid | PTC | 4.42e-67 | 1.90e+00 | 0.2057 |
| 51495 | HACD3 | PTC07 | Human | Thyroid | PTC | 2.04e-86 | 1.79e+00 | 0.2044 |
| 51495 | HACD3 | ATC11 | Human | Thyroid | ATC | 1.60e-02 | 5.49e-01 | 0.3386 |
| 51495 | HACD3 | ATC12 | Human | Thyroid | ATC | 1.41e-03 | 2.67e-01 | 0.34 |
| 51495 | HACD3 | ATC13 | Human | Thyroid | ATC | 8.32e-41 | 1.19e+00 | 0.34 |
| 51495 | HACD3 | ATC2 | Human | Thyroid | ATC | 2.62e-13 | 1.56e+00 | 0.34 |
| 51495 | HACD3 | ATC3 | Human | Thyroid | ATC | 3.50e-02 | 5.10e-01 | 0.338 |
| 51495 | HACD3 | ATC4 | Human | Thyroid | ATC | 1.08e-09 | 3.93e-01 | 0.34 |
| 51495 | HACD3 | ATC5 | Human | Thyroid | ATC | 7.56e-43 | 1.32e+00 | 0.34 |
| Page: 1 2 3 4 5 6 7 |
| Tissue | Expression Dynamics | Abbreviation |
| Breast |  | IDC: Invasive ductal carcinoma |
| DCIS: Ductal carcinoma in situ | ||
| Precancer(BRCA1-mut): Precancerous lesion from BRCA1 mutation carriers | ||
| Esophagus |  | ESCC: Esophageal squamous cell carcinoma |
| HGIN: High-grade intraepithelial neoplasias | ||
| LGIN: Low-grade intraepithelial neoplasias | ||
| Liver | 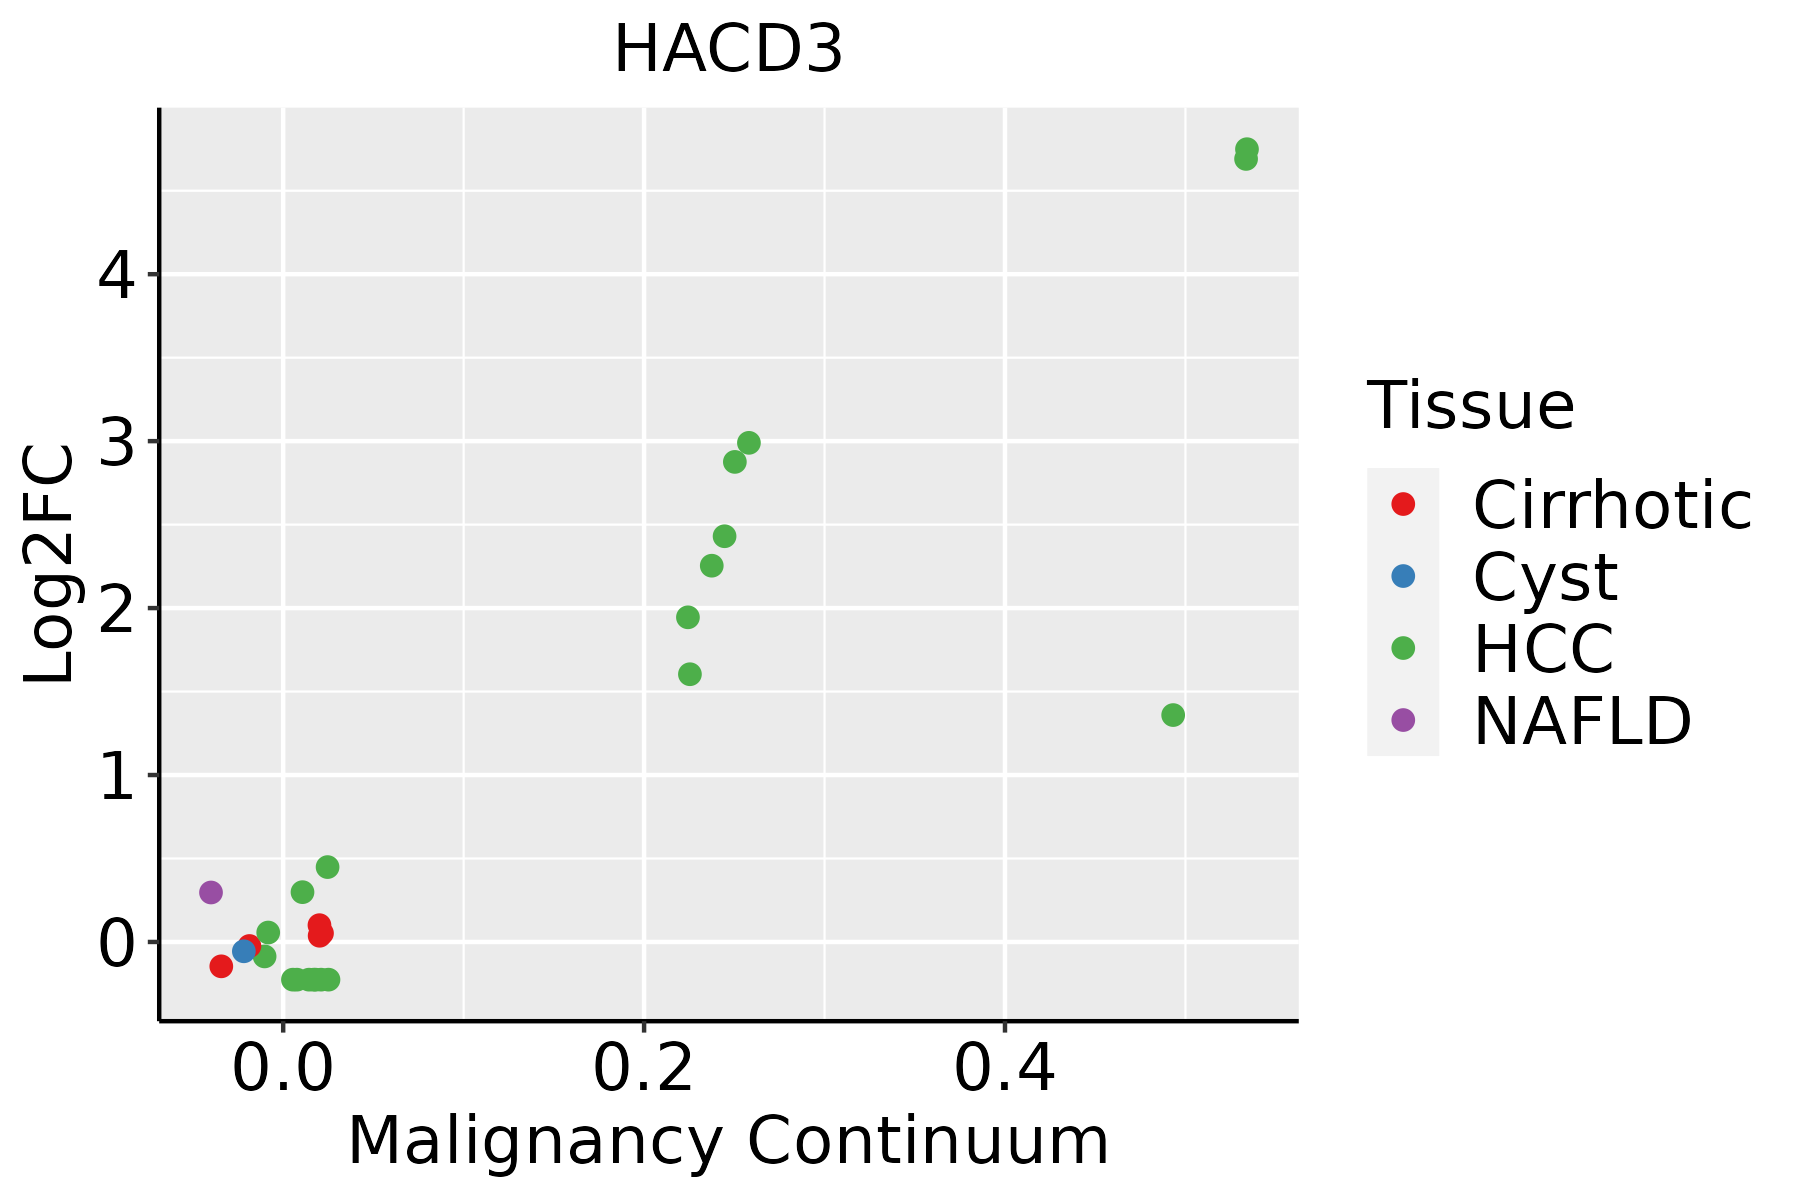 | HCC: Hepatocellular carcinoma |
| NAFLD: Non-alcoholic fatty liver disease | ||
| Oral Cavity | 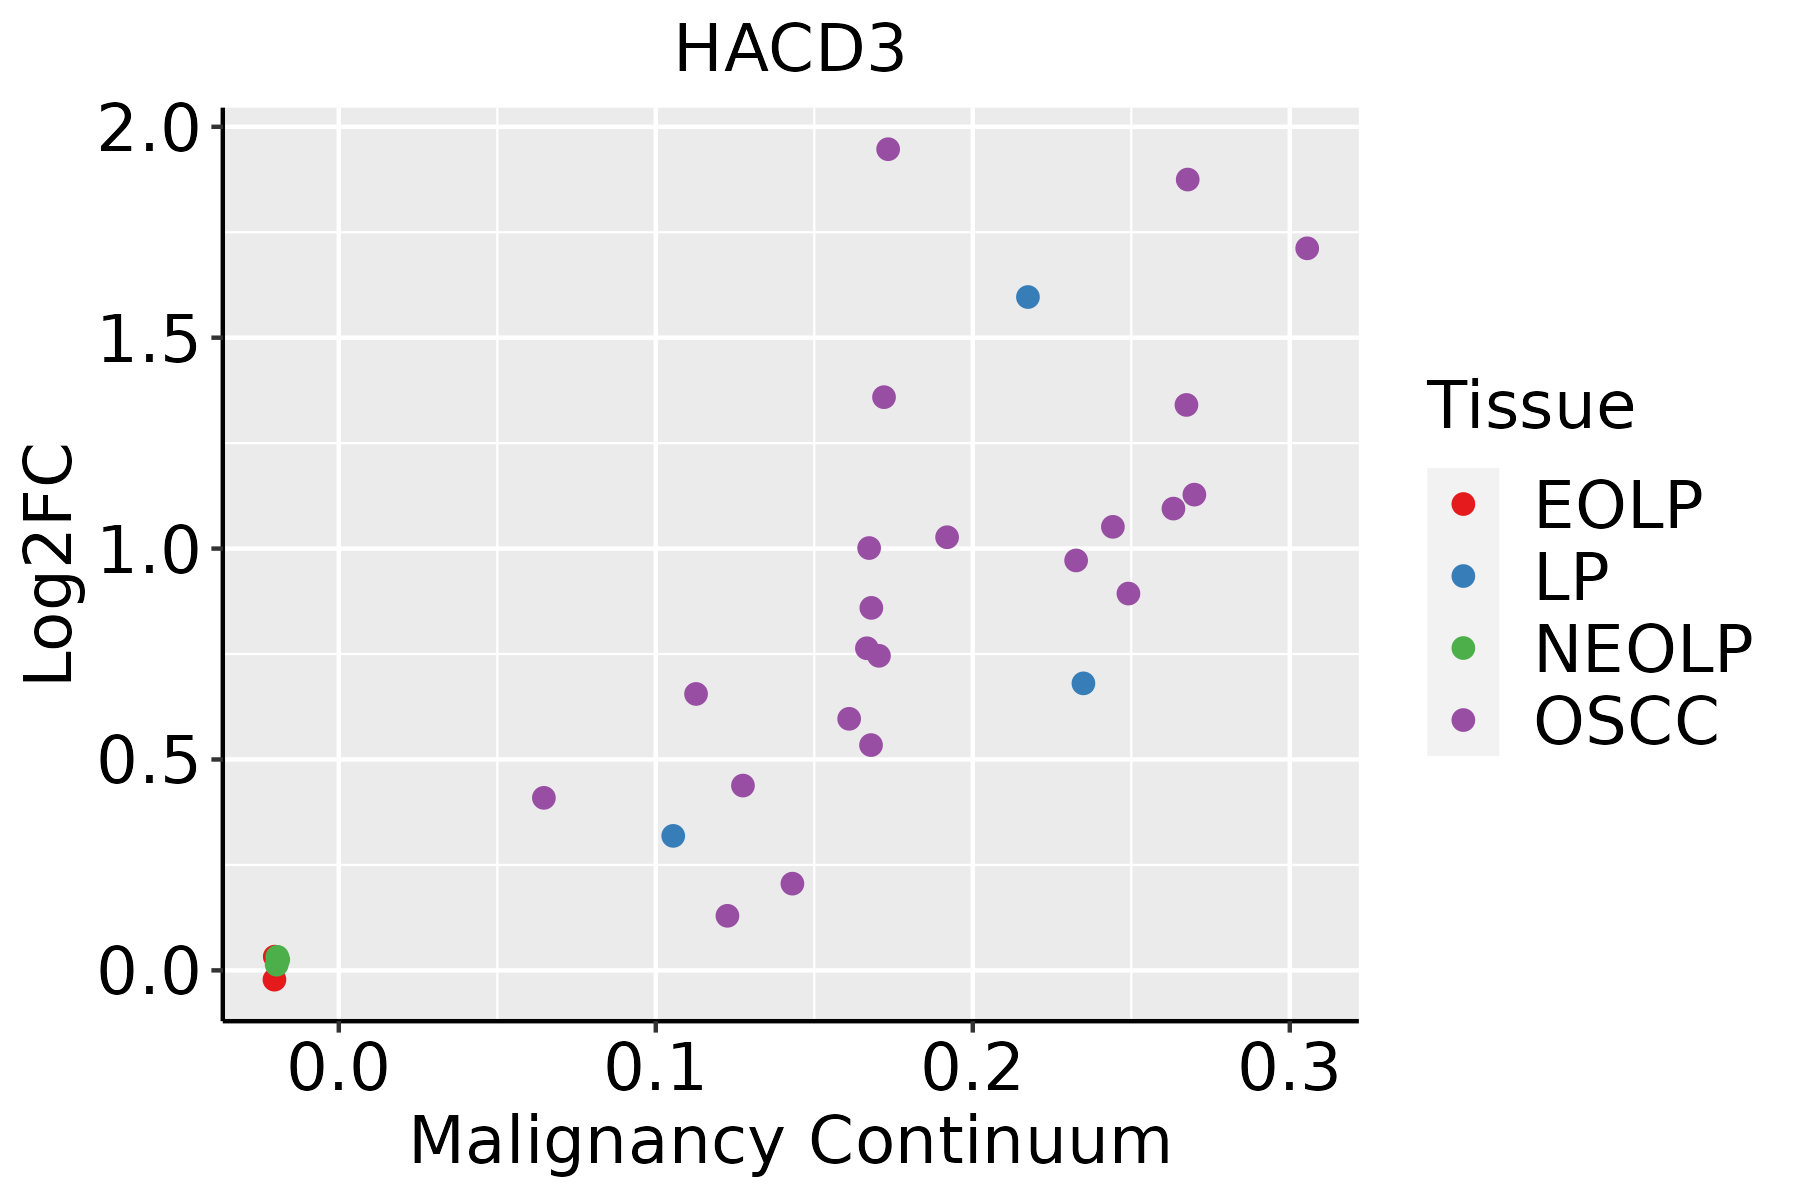 | EOLP: Erosive Oral lichen planus |
| LP: leukoplakia | ||
| NEOLP: Non-erosive oral lichen planus | ||
| OSCC: Oral squamous cell carcinoma | ||
| Prostate |  | BPH: Benign Prostatic Hyperplasia |
| Thyroid | 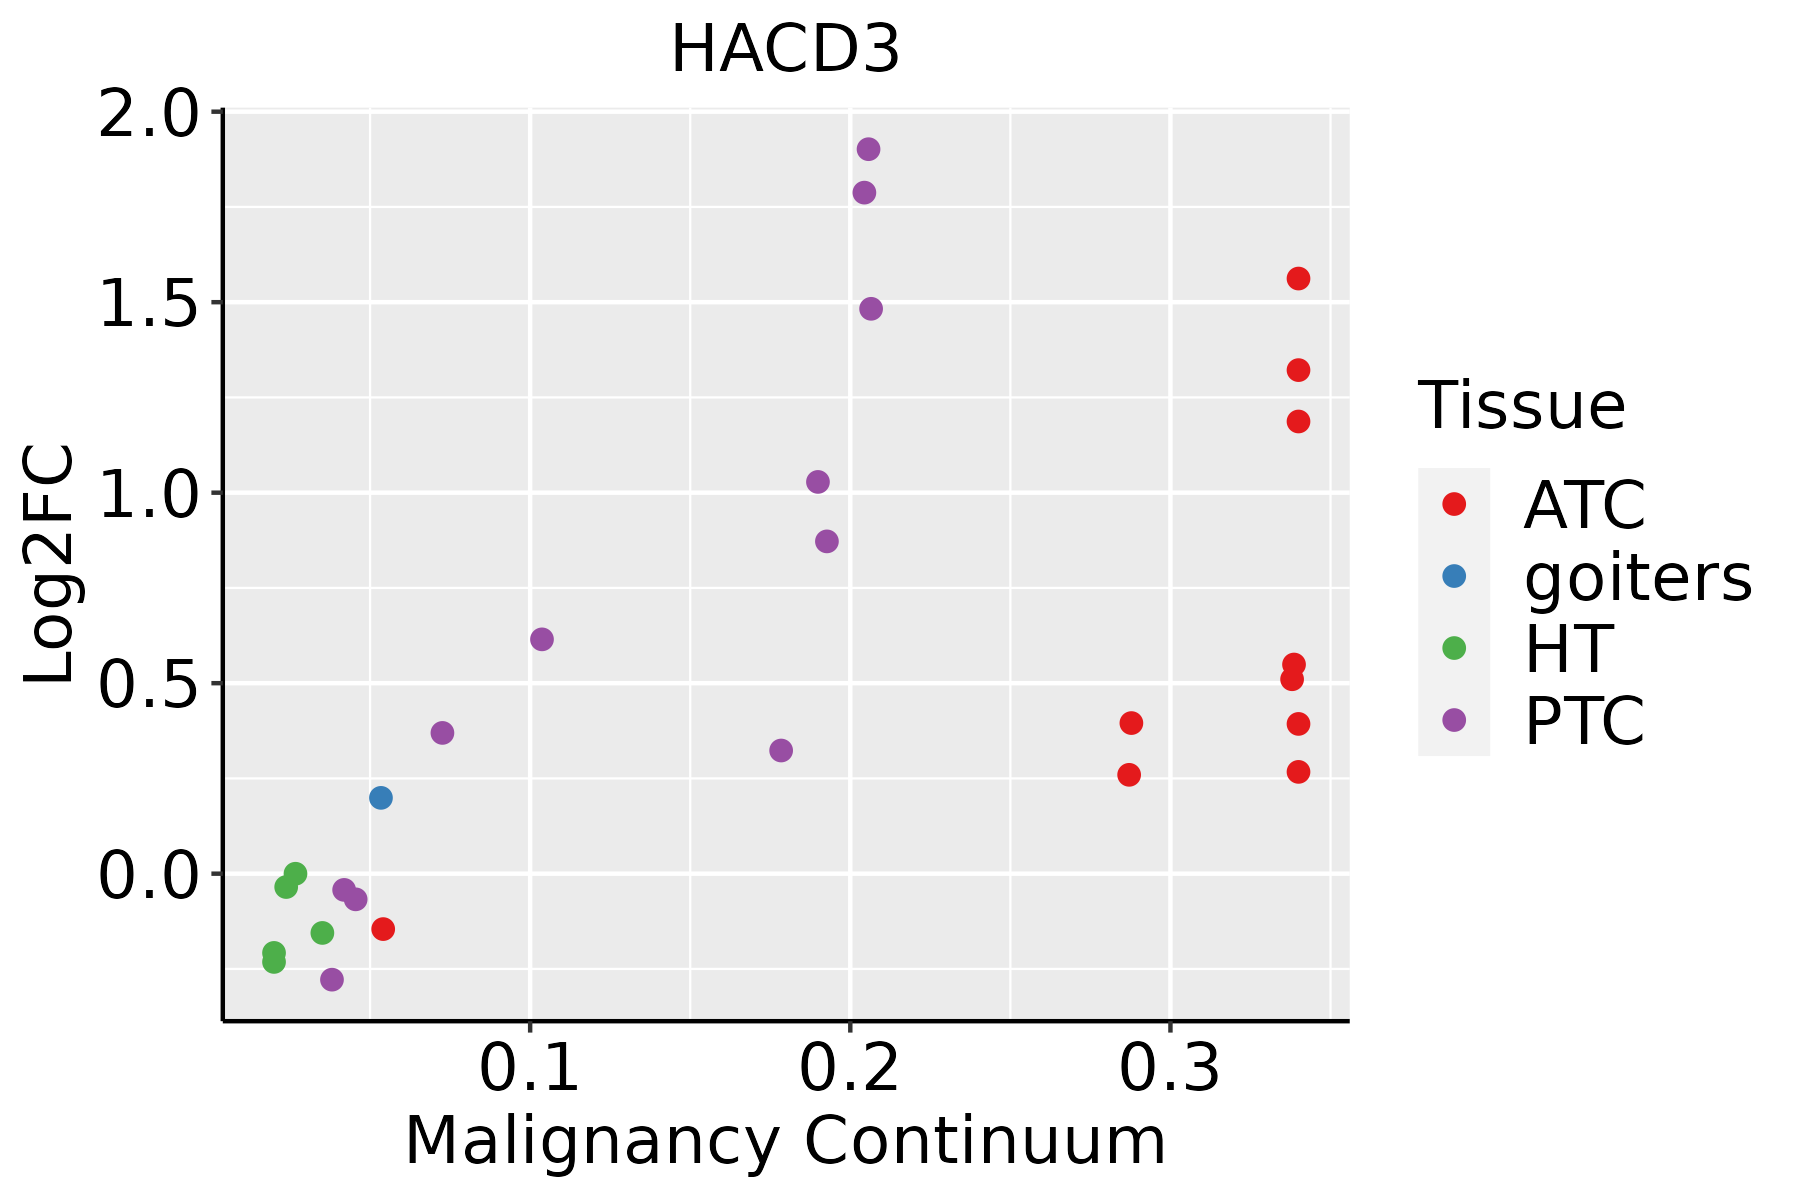 | ATC: Anaplastic thyroid cancer |
| HT: Hashimoto's thyroiditis | ||
| PTC: Papillary thyroid cancer |
| ∗log2FC in expression of this searched gene in stem-like cells from each diseased tissue sample relative to stem-like cells in normal samples in each tissue plotted against the malignancy continuum. Samples are colored based on if they are from different disease stage. |
Top |
Malignant transformation related pathway analysis |
| Find out the enriched GO biological processes and KEGG pathways involved in transition from healthy to precancer to cancer |
| Tissue | Disease Stage | Enriched GO biological Processes |
| Colorectum | AD |  |
| Colorectum | SER |  |
| Colorectum | MSS |  |
| Colorectum | MSI-H |  |
| Colorectum | FAP |  |
| ∗Top 15 enriched GO BP terms are showed in the bar plot of each disease state in each tissue. Each row represents a significant GO biological process which is colored according to the -log10(p.adjust). |
| Page: 1 2 3 4 5 6 7 8 9 |
| GO ID | Tissue | Disease Stage | Description | Gene Ratio | Bg Ratio | pvalue | p.adjust | Count |
| GO:00160329 | Breast | Precancer | viral process | 58/1080 | 415/18723 | 3.42e-10 | 3.16e-08 | 58 |
| GO:00190589 | Breast | Precancer | viral life cycle | 47/1080 | 317/18723 | 2.42e-09 | 1.99e-07 | 47 |
| GO:00507929 | Breast | Precancer | regulation of viral process | 27/1080 | 164/18723 | 7.59e-07 | 3.05e-05 | 27 |
| GO:00190799 | Breast | Precancer | viral genome replication | 22/1080 | 131/18723 | 5.63e-06 | 1.66e-04 | 22 |
| GO:19039009 | Breast | Precancer | regulation of viral life cycle | 23/1080 | 148/18723 | 1.31e-05 | 3.30e-04 | 23 |
| GO:00485249 | Breast | Precancer | positive regulation of viral process | 12/1080 | 65/18723 | 3.00e-04 | 4.34e-03 | 12 |
| GO:00450697 | Breast | Precancer | regulation of viral genome replication | 13/1080 | 85/18723 | 1.12e-03 | 1.23e-02 | 13 |
| GO:00463946 | Breast | Precancer | carboxylic acid biosynthetic process | 32/1080 | 314/18723 | 1.30e-03 | 1.38e-02 | 32 |
| GO:00723304 | Breast | Precancer | monocarboxylic acid biosynthetic process | 24/1080 | 214/18723 | 1.41e-03 | 1.48e-02 | 24 |
| GO:00160536 | Breast | Precancer | organic acid biosynthetic process | 32/1080 | 316/18723 | 1.44e-03 | 1.50e-02 | 32 |
| GO:00066335 | Breast | Precancer | fatty acid biosynthetic process | 19/1080 | 163/18723 | 2.74e-03 | 2.42e-02 | 19 |
| GO:00072496 | Breast | Precancer | I-kappaB kinase/NF-kappaB signaling | 27/1080 | 281/18723 | 6.58e-03 | 4.53e-02 | 27 |
| GO:001603214 | Breast | IDC | viral process | 75/1434 | 415/18723 | 1.98e-12 | 4.02e-10 | 75 |
| GO:001905814 | Breast | IDC | viral life cycle | 61/1434 | 317/18723 | 1.61e-11 | 2.77e-09 | 61 |
| GO:001907914 | Breast | IDC | viral genome replication | 32/1434 | 131/18723 | 2.82e-09 | 2.46e-07 | 32 |
| GO:005079214 | Breast | IDC | regulation of viral process | 36/1434 | 164/18723 | 6.55e-09 | 5.03e-07 | 36 |
| GO:190390014 | Breast | IDC | regulation of viral life cycle | 30/1434 | 148/18723 | 7.25e-07 | 3.35e-05 | 30 |
| GO:004506913 | Breast | IDC | regulation of viral genome replication | 20/1434 | 85/18723 | 4.77e-06 | 1.63e-04 | 20 |
| GO:004852413 | Breast | IDC | positive regulation of viral process | 17/1434 | 65/18723 | 5.31e-06 | 1.75e-04 | 17 |
| GO:00450706 | Breast | IDC | positive regulation of viral genome replication | 9/1434 | 30/18723 | 2.89e-04 | 4.39e-03 | 9 |
| Page: 1 2 3 4 5 6 7 8 9 10 11 |
| Pathway ID | Tissue | Disease Stage | Description | Gene Ratio | Bg Ratio | pvalue | p.adjust | qvalue | Count |
| hsa012129 | Esophagus | ESCC | Fatty acid metabolism | 41/4205 | 57/8465 | 5.13e-04 | 1.75e-03 | 8.98e-04 | 41 |
| hsa0121214 | Esophagus | ESCC | Fatty acid metabolism | 41/4205 | 57/8465 | 5.13e-04 | 1.75e-03 | 8.98e-04 | 41 |
| hsa012126 | Liver | NAFLD | Fatty acid metabolism | 17/1043 | 57/8465 | 3.43e-04 | 5.93e-03 | 4.78e-03 | 17 |
| hsa0121211 | Liver | NAFLD | Fatty acid metabolism | 17/1043 | 57/8465 | 3.43e-04 | 5.93e-03 | 4.78e-03 | 17 |
| hsa012122 | Liver | Cirrhotic | Fatty acid metabolism | 32/2530 | 57/8465 | 3.12e-05 | 2.47e-04 | 1.52e-04 | 32 |
| hsa01040 | Liver | Cirrhotic | Biosynthesis of unsaturated fatty acids | 14/2530 | 27/8465 | 1.36e-02 | 4.25e-02 | 2.62e-02 | 14 |
| hsa012123 | Liver | Cirrhotic | Fatty acid metabolism | 32/2530 | 57/8465 | 3.12e-05 | 2.47e-04 | 1.52e-04 | 32 |
| hsa010401 | Liver | Cirrhotic | Biosynthesis of unsaturated fatty acids | 14/2530 | 27/8465 | 1.36e-02 | 4.25e-02 | 2.62e-02 | 14 |
| hsa012124 | Liver | HCC | Fatty acid metabolism | 45/4020 | 57/8465 | 1.05e-06 | 1.10e-05 | 6.09e-06 | 45 |
| hsa000622 | Liver | HCC | Fatty acid elongation | 20/4020 | 27/8465 | 4.58e-03 | 1.36e-02 | 7.55e-03 | 20 |
| hsa010402 | Liver | HCC | Biosynthesis of unsaturated fatty acids | 19/4020 | 27/8465 | 1.37e-02 | 3.33e-02 | 1.85e-02 | 19 |
| hsa012125 | Liver | HCC | Fatty acid metabolism | 45/4020 | 57/8465 | 1.05e-06 | 1.10e-05 | 6.09e-06 | 45 |
| hsa0006211 | Liver | HCC | Fatty acid elongation | 20/4020 | 27/8465 | 4.58e-03 | 1.36e-02 | 7.55e-03 | 20 |
| hsa010403 | Liver | HCC | Biosynthesis of unsaturated fatty acids | 19/4020 | 27/8465 | 1.37e-02 | 3.33e-02 | 1.85e-02 | 19 |
| hsa012128 | Oral cavity | OSCC | Fatty acid metabolism | 35/3704 | 57/8465 | 5.37e-03 | 1.29e-02 | 6.55e-03 | 35 |
| hsa0121213 | Oral cavity | OSCC | Fatty acid metabolism | 35/3704 | 57/8465 | 5.37e-03 | 1.29e-02 | 6.55e-03 | 35 |
| hsa012127 | Prostate | BPH | Fatty acid metabolism | 19/1718 | 57/8465 | 1.44e-02 | 4.17e-02 | 2.58e-02 | 19 |
| hsa0121212 | Prostate | BPH | Fatty acid metabolism | 19/1718 | 57/8465 | 1.44e-02 | 4.17e-02 | 2.58e-02 | 19 |
| hsa0121221 | Prostate | Tumor | Fatty acid metabolism | 23/1791 | 57/8465 | 7.60e-04 | 3.59e-03 | 2.23e-03 | 23 |
| hsa010404 | Prostate | Tumor | Biosynthesis of unsaturated fatty acids | 12/1791 | 27/8465 | 5.53e-03 | 1.93e-02 | 1.19e-02 | 12 |
| Page: 1 2 |
Top |
Cell-cell communication analysis |
| Identification of potential cell-cell interactions between two cell types and their ligand-receptor pairs for different disease states |
| Ligand | Receptor | LRpair | Pathway | Tissue | Disease Stage |
| Page: 1 |
Top |
Single-cell gene regulatory network inference analysis |
| Find out the significant the regulons (TFs) and the target genes of each regulon across cell types for different disease states |
| TF | Cell Type | Tissue | Disease Stage | Target Gene | RSS | Regulon Activity |
| ∗The dot plots of a searched regulon are shown for all cell subpopulations in each disease state of each tissue based on the regulon specific score inferred using pySCENIC and by calculating the average expression. |
| Page: 1 |
Top |
Somatic mutation of malignant transformation related genes |
| Annotation of somatic variants for genes involved in malignant transformation |
| Hugo Symbol | Variant Class | Variant Classification | dbSNP RS | HGVSc | HGVSp | HGVSp Short | SWISSPROT | BIOTYPE | SIFT | PolyPhen | Tumor Sample Barcode | Tissue | Histology | Sex | Age | Stage | Therapy Types | Drugs | Outcome |
| HACD3 | SNV | Missense_Mutation | rs775563054 | c.233N>G | p.Val78Gly | p.V78G | Q9P035 | protein_coding | deleterious(0) | probably_damaging(0.969) | TCGA-A2-A1G4-01 | Breast | breast invasive carcinoma | Female | >=65 | III/IV | Chemotherapy | adriamycin | SD |
| HACD3 | SNV | Missense_Mutation | rs775563054 | c.233T>G | p.Val78Gly | p.V78G | Q9P035 | protein_coding | deleterious(0) | probably_damaging(0.969) | TCGA-BH-A1EX-01 | Breast | breast invasive carcinoma | Female | >=65 | I/II | Unknown | Unknown | PD |
| HACD3 | SNV | Missense_Mutation | rs775563054 | c.233N>G | p.Val78Gly | p.V78G | Q9P035 | protein_coding | deleterious(0) | probably_damaging(0.969) | TCGA-C8-A12X-01 | Breast | breast invasive carcinoma | Female | <65 | I/II | Unknown | Unknown | SD |
| HACD3 | SNV | Missense_Mutation | rs775563054 | c.233N>G | p.Val78Gly | p.V78G | Q9P035 | protein_coding | deleterious(0) | probably_damaging(0.969) | TCGA-D8-A1Y3-01 | Breast | breast invasive carcinoma | Female | <65 | III/IV | Chemotherapy | doxorubicine+cyclophosphamide | SD |
| HACD3 | SNV | Missense_Mutation | rs775563054 | c.233N>G | p.Val78Gly | p.V78G | Q9P035 | protein_coding | deleterious(0) | probably_damaging(0.969) | TCGA-EW-A1IW-01 | Breast | breast invasive carcinoma | Female | >=65 | I/II | Hormone Therapy | aromasin | SD |
| HACD3 | SNV | Missense_Mutation | novel | c.231N>T | p.Gln77His | p.Q77H | Q9P035 | protein_coding | deleterious(0) | probably_damaging(0.999) | TCGA-JL-A3YW-01 | Breast | breast invasive carcinoma | Female | <65 | I/II | Unknown | Unknown | SD |
| HACD3 | deletion | Frame_Shift_Del | novel | c.736delN | p.Phe246LeufsTer19 | p.F246Lfs*19 | Q9P035 | protein_coding | TCGA-D8-A27V-01 | Breast | breast invasive carcinoma | Female | <65 | I/II | Hormone Therapy | tamoxiphen | SD | ||
| HACD3 | deletion | Frame_Shift_Del | novel | c.767delN | p.Phe257SerfsTer8 | p.F257Sfs*8 | Q9P035 | protein_coding | TCGA-EW-A2FV-01 | Breast | breast invasive carcinoma | Female | <65 | III/IV | Chemotherapy | docetaxel | SD | ||
| HACD3 | SNV | Missense_Mutation | c.1074G>T | p.Lys358Asn | p.K358N | Q9P035 | protein_coding | deleterious(0) | probably_damaging(0.998) | TCGA-VS-A9V3-01 | Cervix | cervical & endocervical cancer | Female | <65 | I/II | Chemotherapy | cisplatin | PD | |
| HACD3 | deletion | Frame_Shift_Del | novel | c.1073delA | p.Lys358ArgfsTer17 | p.K358Rfs*17 | Q9P035 | protein_coding | TCGA-EA-A410-01 | Cervix | cervical & endocervical cancer | Female | <65 | I/II | Unknown | Unknown | SD |
| Page: 1 2 3 4 |
Top |
Related drugs of malignant transformation related genes |
| Identification of chemicals and drugs interact with genes involved in malignant transfromation |
| (DGIdb 4.0) |
| Entrez ID | Symbol | Category | Interaction Types | Drug Claim Name | Drug Name | PMIDs |
| Page: 1 |

Copyright 2023-Present -The University of Texas Health Science Center at Houston |