
|
|||||
|
 | |
| |
| |
| |
| |
| |
|
Gene: GPHN |
Gene summary for GPHN |
| Gene information | Species | Human | Gene symbol | GPHN | Gene ID | 10243 |
| Gene name | gephyrin | |
| Gene Alias | GEPH | |
| Cytomap | 14q23.3-q24.1 | |
| Gene Type | protein-coding | GO ID | GO:0001941 | UniProtAcc | Q9NQX3 |
Top |
Malignant transformation analysis |
| Identification of the aberrant gene expression in precancerous and cancerous lesions by comparing the gene expression of stem-like cells in diseased tissues with normal stem cells |
| Entrez ID | Symbol | Replicates | Species | Organ | Tissue | Adj P-value | Log2FC | Malignancy |
| 10243 | GPHN | cirrhotic1 | Human | Liver | Cirrhotic | 9.10e-10 | -3.87e-01 | 0.0202 |
| 10243 | GPHN | cirrhotic2 | Human | Liver | Cirrhotic | 2.08e-13 | -3.79e-01 | 0.0201 |
| 10243 | GPHN | cirrhotic3 | Human | Liver | Cirrhotic | 4.51e-05 | -4.15e-01 | 0.0215 |
| 10243 | GPHN | Pt13.a | Human | Liver | HCC | 1.90e-11 | -4.42e-01 | 0.021 |
| 10243 | GPHN | Pt13.b | Human | Liver | HCC | 3.87e-04 | -4.15e-01 | 0.0251 |
| 10243 | GPHN | Pt14.d | Human | Liver | HCC | 7.65e-09 | -3.88e-01 | 0.0143 |
| 10243 | GPHN | S014 | Human | Liver | HCC | 1.52e-05 | 1.37e-01 | 0.2254 |
| 10243 | GPHN | S015 | Human | Liver | HCC | 3.09e-02 | 1.92e-01 | 0.2375 |
| 10243 | GPHN | S016 | Human | Liver | HCC | 1.26e-06 | 2.35e-01 | 0.2243 |
| 10243 | GPHN | S029 | Human | Liver | HCC | 6.01e-08 | -1.66e-01 | 0.2581 |
| 10243 | GPHN | TD9 | Human | Lung | IAC | 2.26e-05 | 8.03e-01 | 0.088 |
| 10243 | GPHN | RNA-P10T2-P10T2-1 | Human | Lung | AAH | 6.34e-04 | 8.13e-01 | -0.1271 |
| 10243 | GPHN | RNA-P10T2-P10T2-2 | Human | Lung | AAH | 3.86e-02 | 5.64e-01 | -0.1406 |
| 10243 | GPHN | RNA-P17T-P17T-2 | Human | Lung | IAC | 3.33e-10 | 1.03e+00 | 0.3371 |
| 10243 | GPHN | RNA-P17T-P17T-4 | Human | Lung | IAC | 1.77e-11 | 9.49e-01 | 0.343 |
| 10243 | GPHN | RNA-P17T-P17T-6 | Human | Lung | IAC | 3.81e-11 | 9.78e-01 | 0.3385 |
| 10243 | GPHN | RNA-P17T-P17T-8 | Human | Lung | IAC | 1.44e-07 | 8.59e-01 | 0.3329 |
| 10243 | GPHN | RNA-P25T1-P25T1-1 | Human | Lung | AIS | 2.54e-33 | 1.28e+00 | -0.2116 |
| 10243 | GPHN | RNA-P25T1-P25T1-2 | Human | Lung | AIS | 3.21e-17 | 1.39e+00 | -0.1941 |
| 10243 | GPHN | RNA-P25T1-P25T1-3 | Human | Lung | AIS | 6.70e-16 | 1.19e+00 | -0.2107 |
| Page: 1 2 3 4 5 6 7 8 9 10 11 |
| Tissue | Expression Dynamics | Abbreviation |
| Cervix | 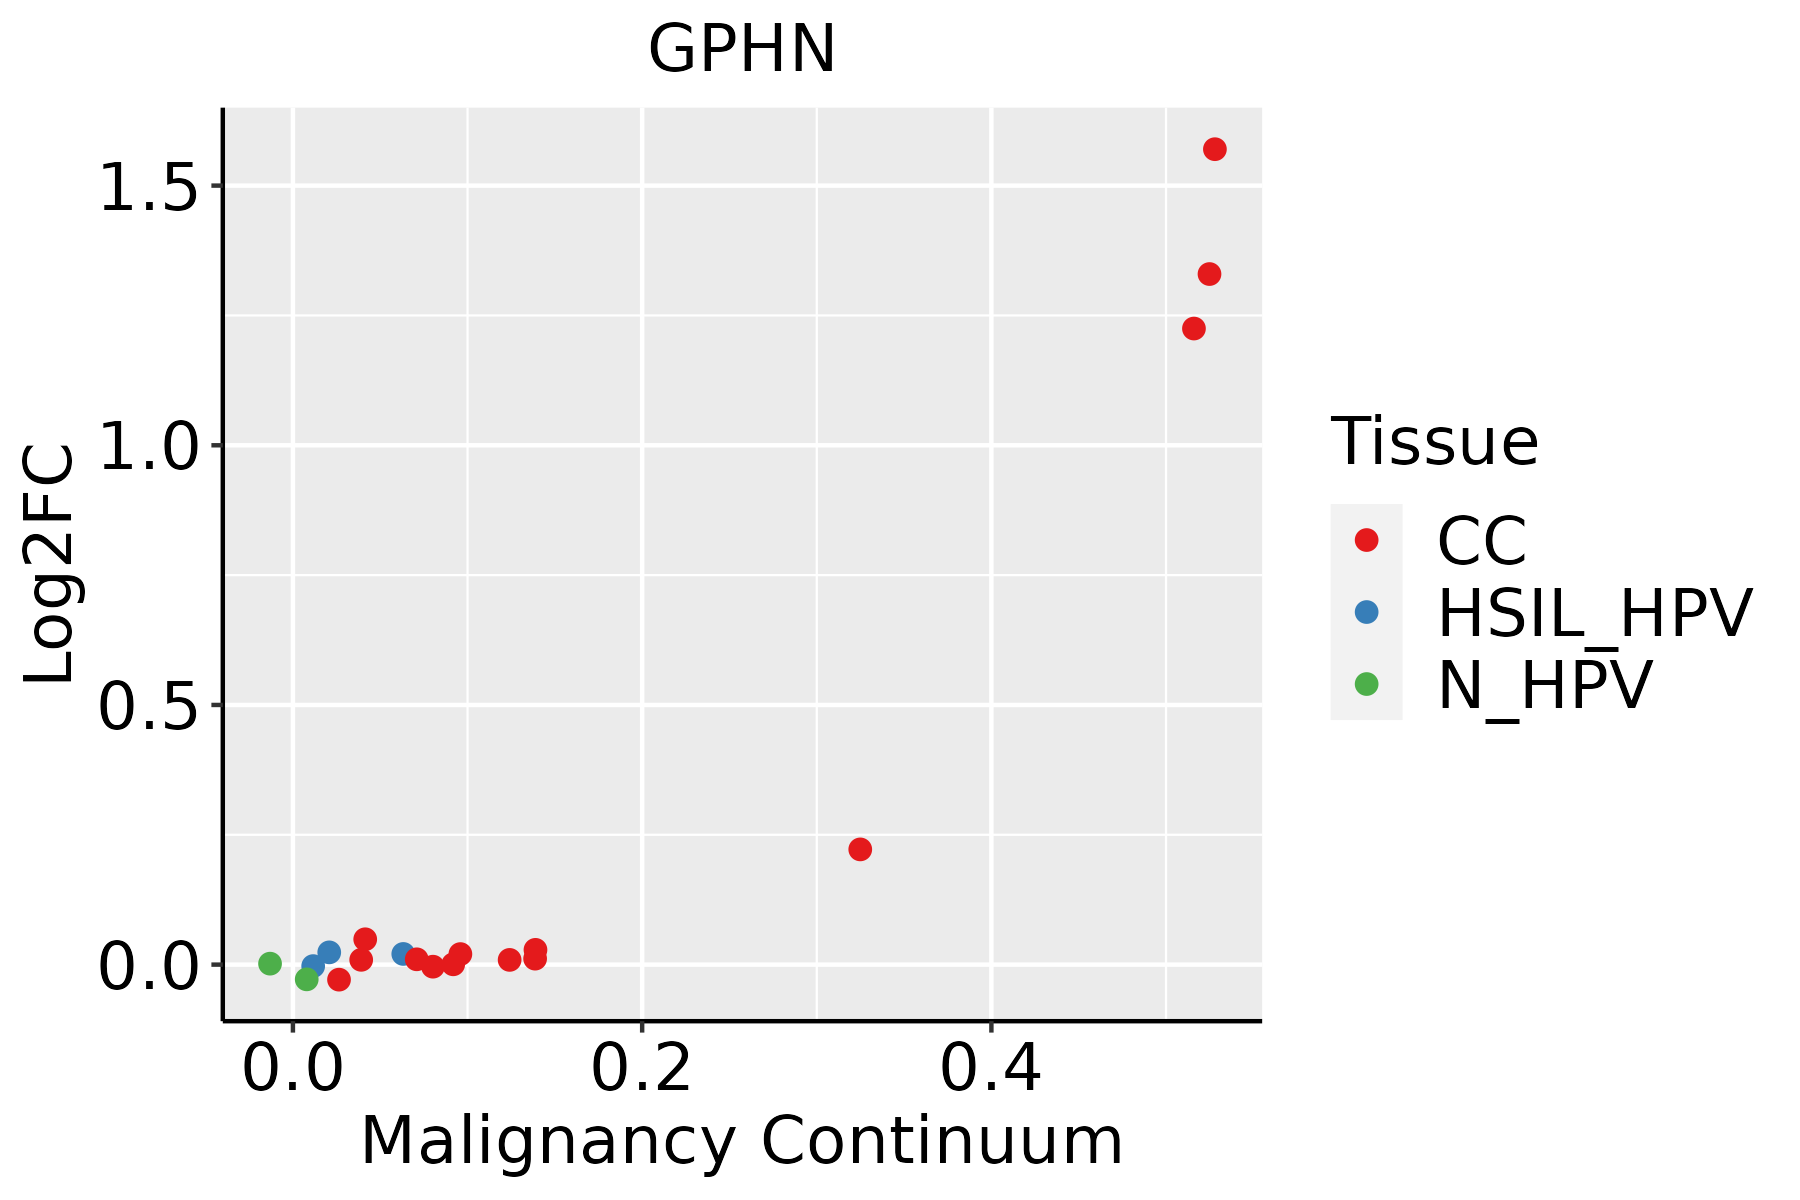 | CC: Cervix cancer |
| HSIL_HPV: HPV-infected high-grade squamous intraepithelial lesions | ||
| N_HPV: HPV-infected normal cervix | ||
| Colorectum (GSE201348) |  | FAP: Familial adenomatous polyposis |
| CRC: Colorectal cancer | ||
| Colorectum (HTA11) |  | AD: Adenomas |
| SER: Sessile serrated lesions | ||
| MSI-H: Microsatellite-high colorectal cancer | ||
| MSS: Microsatellite stable colorectal cancer | ||
| Endometrium |  | AEH: Atypical endometrial hyperplasia |
| EEC: Endometrioid Cancer | ||
| Esophagus |  | ESCC: Esophageal squamous cell carcinoma |
| HGIN: High-grade intraepithelial neoplasias | ||
| LGIN: Low-grade intraepithelial neoplasias | ||
| GC |  | CAG: Chronic atrophic gastritis |
| CAG with IM: Chronic atrophic gastritis with intestinal metaplasia | ||
| CSG: Chronic superficial gastritis | ||
| GC: Gastric cancer | ||
| SIM: Severe intestinal metaplasia | ||
| WIM: Wild intestinal metaplasia | ||
| Liver | 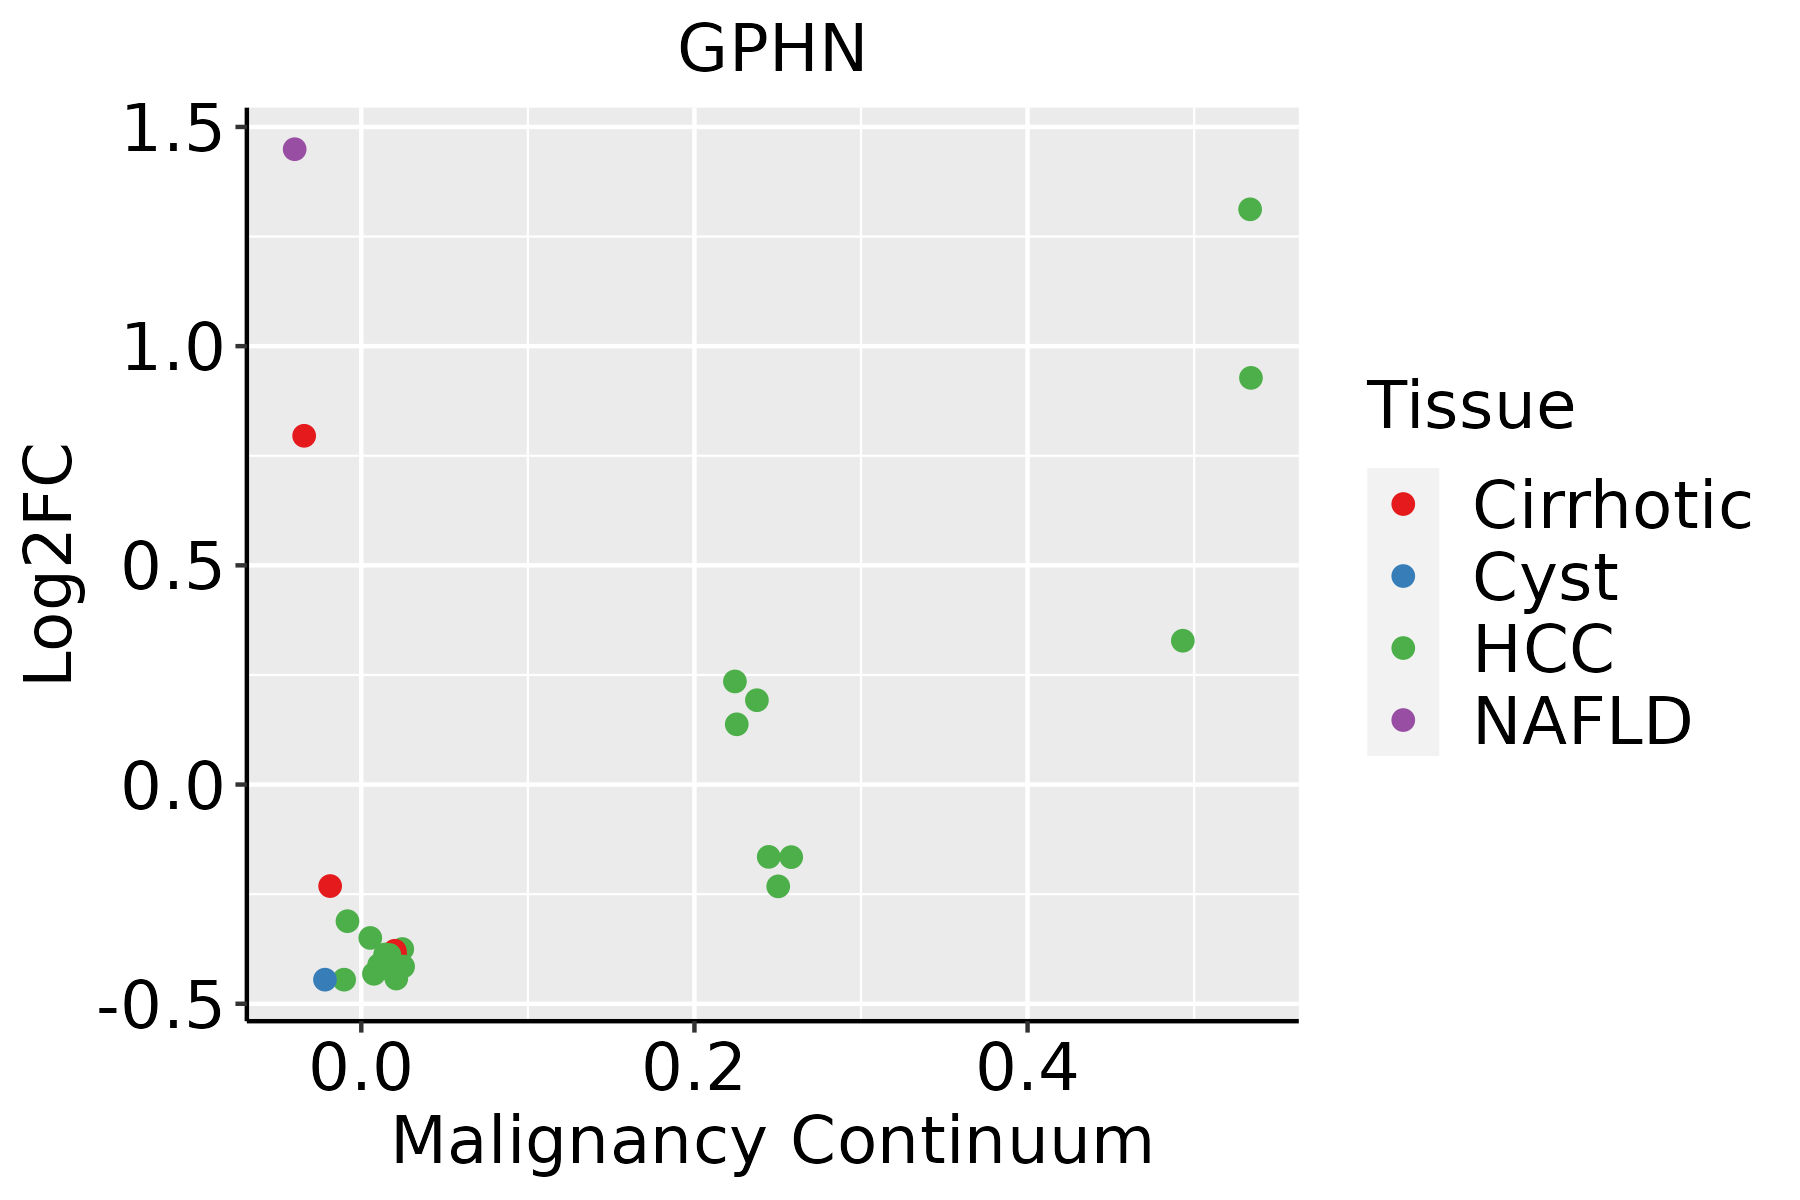 | HCC: Hepatocellular carcinoma |
| NAFLD: Non-alcoholic fatty liver disease | ||
| Lung | 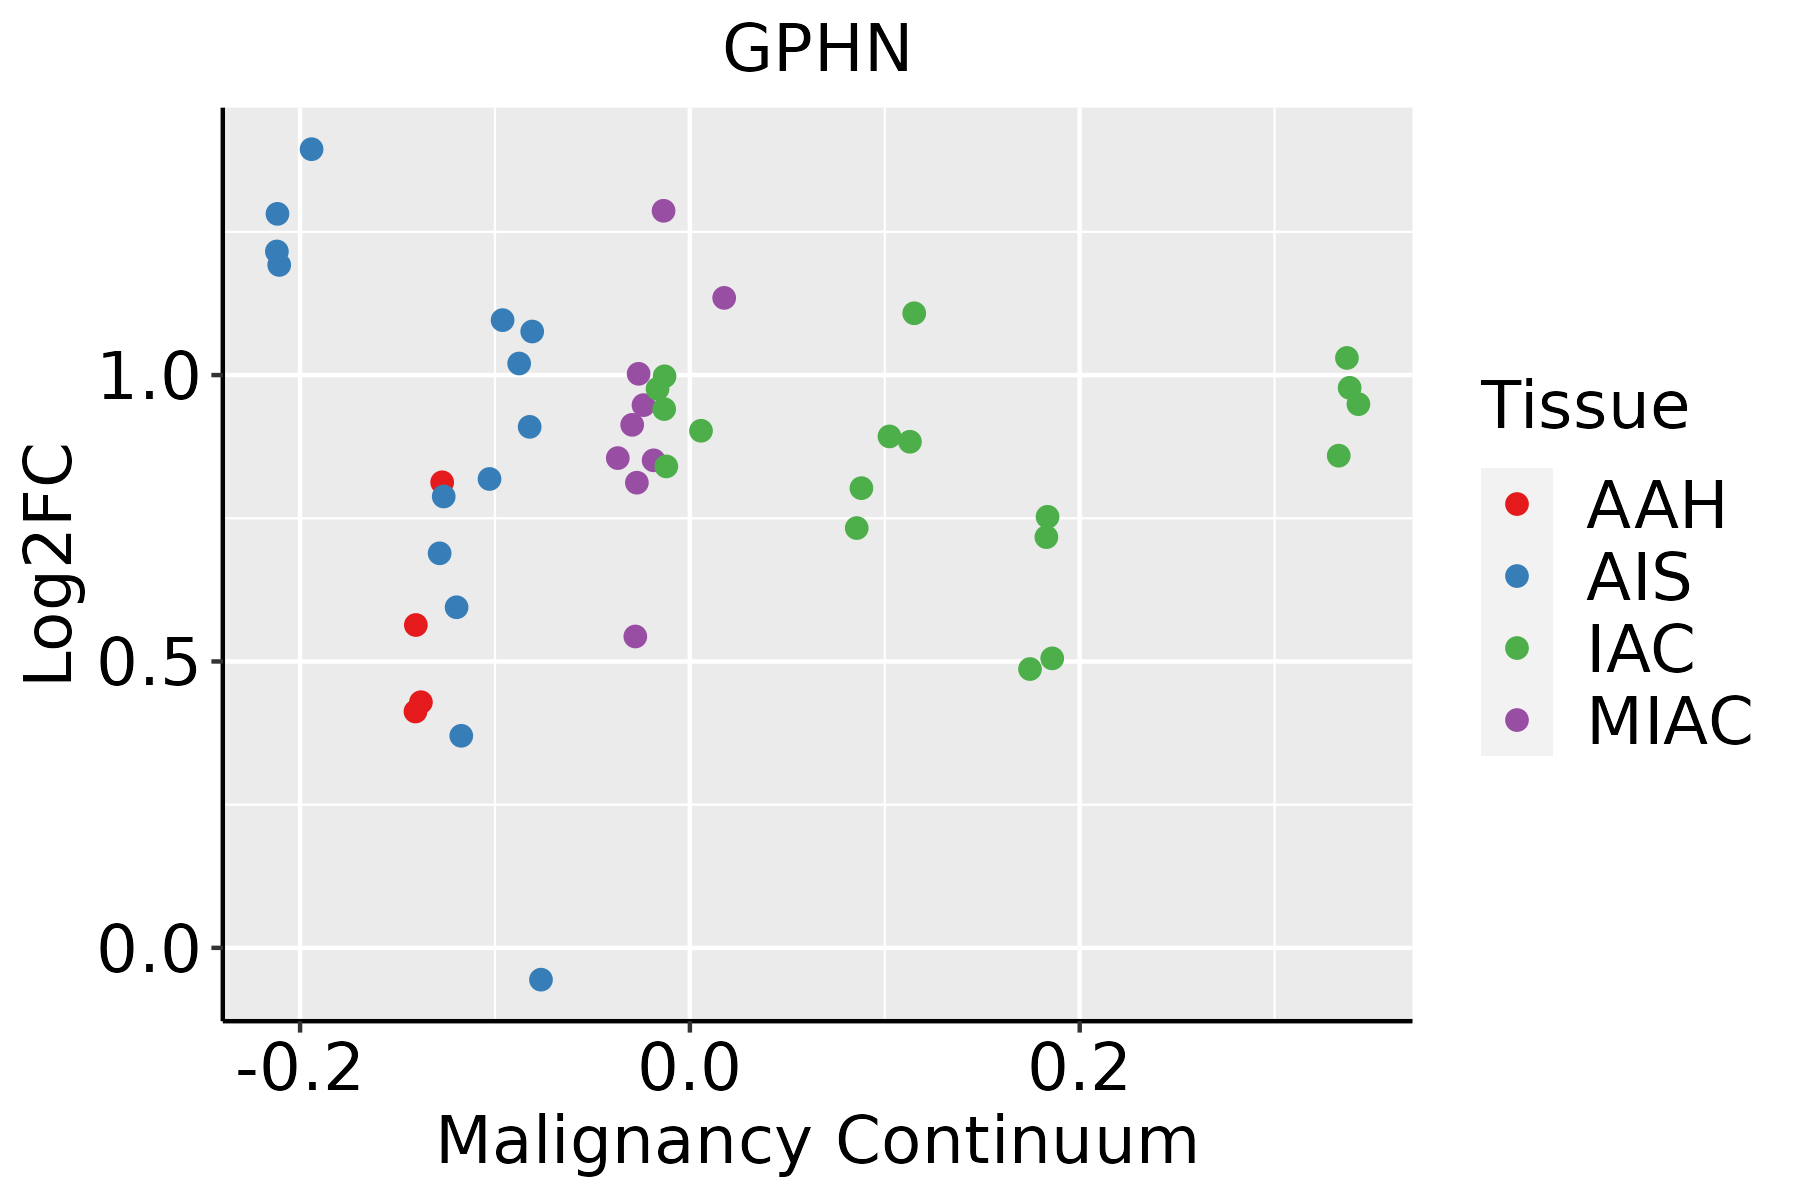 | AAH: Atypical adenomatous hyperplasia |
| AIS: Adenocarcinoma in situ | ||
| IAC: Invasive lung adenocarcinoma | ||
| MIA: Minimally invasive adenocarcinoma | ||
| Oral Cavity |  | EOLP: Erosive Oral lichen planus |
| LP: leukoplakia | ||
| NEOLP: Non-erosive oral lichen planus | ||
| OSCC: Oral squamous cell carcinoma | ||
| Prostate |  | BPH: Benign Prostatic Hyperplasia |
| Skin |  | AK: Actinic keratosis |
| cSCC: Cutaneous squamous cell carcinoma | ||
| SCCIS:squamous cell carcinoma in situ |
| ∗log2FC in expression of this searched gene in stem-like cells from each diseased tissue sample relative to stem-like cells in normal samples in each tissue plotted against the malignancy continuum. Samples are colored based on if they are from different disease stage. |
Top |
Malignant transformation related pathway analysis |
| Find out the enriched GO biological processes and KEGG pathways involved in transition from healthy to precancer to cancer |
| Tissue | Disease Stage | Enriched GO biological Processes |
| Colorectum | AD |  |
| Colorectum | SER |  |
| Colorectum | MSS |  |
| Colorectum | MSI-H |  |
| Colorectum | FAP |  |
| ∗Top 15 enriched GO BP terms are showed in the bar plot of each disease state in each tissue. Each row represents a significant GO biological process which is colored according to the -log10(p.adjust). |
| Page: 1 2 3 4 5 6 7 8 9 |
| GO ID | Tissue | Disease Stage | Description | Gene Ratio | Bg Ratio | pvalue | p.adjust | Count |
| GO:001003810 | Cervix | CC | response to metal ion | 67/2311 | 373/18723 | 9.67e-04 | 8.10e-03 | 67 |
| GO:0010038 | Colorectum | AD | response to metal ion | 106/3918 | 373/18723 | 3.22e-04 | 3.83e-03 | 106 |
| GO:0099173 | Colorectum | AD | postsynapse organization | 51/3918 | 168/18723 | 2.47e-03 | 1.90e-02 | 51 |
| GO:0050808 | Colorectum | AD | synapse organization | 112/3918 | 426/18723 | 4.25e-03 | 2.92e-02 | 112 |
| GO:0099072 | Colorectum | AD | regulation of postsynaptic membrane neurotransmitter receptor levels | 22/3918 | 62/18723 | 5.72e-03 | 3.64e-02 | 22 |
| GO:00991731 | Colorectum | SER | postsynapse organization | 46/2897 | 168/18723 | 5.20e-05 | 1.25e-03 | 46 |
| GO:00100381 | Colorectum | SER | response to metal ion | 84/2897 | 373/18723 | 1.87e-04 | 3.44e-03 | 84 |
| GO:00508081 | Colorectum | SER | synapse organization | 85/2897 | 426/18723 | 7.17e-03 | 4.99e-02 | 85 |
| GO:00991732 | Colorectum | MSS | postsynapse organization | 48/3467 | 168/18723 | 9.32e-04 | 9.44e-03 | 48 |
| GO:00990721 | Colorectum | MSS | regulation of postsynaptic membrane neurotransmitter receptor levels | 21/3467 | 62/18723 | 2.87e-03 | 2.23e-02 | 21 |
| GO:00100382 | Colorectum | MSS | response to metal ion | 90/3467 | 373/18723 | 3.76e-03 | 2.76e-02 | 90 |
| GO:00508082 | Colorectum | MSS | synapse organization | 101/3467 | 426/18723 | 3.96e-03 | 2.89e-02 | 101 |
| GO:00100383 | Colorectum | MSI-H | response to metal ion | 41/1319 | 373/18723 | 3.09e-03 | 3.87e-02 | 41 |
| GO:00508083 | Colorectum | FAP | synapse organization | 91/2622 | 426/18723 | 1.90e-05 | 4.74e-04 | 91 |
| GO:00991733 | Colorectum | FAP | postsynapse organization | 42/2622 | 168/18723 | 1.01e-04 | 1.70e-03 | 42 |
| GO:00990722 | Colorectum | FAP | regulation of postsynaptic membrane neurotransmitter receptor levels | 18/2622 | 62/18723 | 1.60e-03 | 1.42e-02 | 18 |
| GO:00100384 | Colorectum | FAP | response to metal ion | 70/2622 | 373/18723 | 5.95e-03 | 3.75e-02 | 70 |
| GO:00991734 | Colorectum | CRC | postsynapse organization | 36/2078 | 168/18723 | 7.61e-05 | 1.59e-03 | 36 |
| GO:00508084 | Colorectum | CRC | synapse organization | 71/2078 | 426/18723 | 3.02e-04 | 4.76e-03 | 71 |
| GO:00990723 | Colorectum | CRC | regulation of postsynaptic membrane neurotransmitter receptor levels | 16/2078 | 62/18723 | 9.40e-04 | 1.15e-02 | 16 |
| Page: 1 2 3 4 |
| Pathway ID | Tissue | Disease Stage | Description | Gene Ratio | Bg Ratio | pvalue | p.adjust | qvalue | Count |
| hsa012405 | Esophagus | ESCC | Biosynthesis of cofactors | 97/4205 | 153/8465 | 3.88e-04 | 1.35e-03 | 6.94e-04 | 97 |
| hsa0124012 | Esophagus | ESCC | Biosynthesis of cofactors | 97/4205 | 153/8465 | 3.88e-04 | 1.35e-03 | 6.94e-04 | 97 |
| hsa012402 | Liver | HCC | Biosynthesis of cofactors | 103/4020 | 153/8465 | 4.67e-07 | 5.05e-06 | 2.81e-06 | 103 |
| hsa012403 | Liver | HCC | Biosynthesis of cofactors | 103/4020 | 153/8465 | 4.67e-07 | 5.05e-06 | 2.81e-06 | 103 |
| hsa012404 | Oral cavity | OSCC | Biosynthesis of cofactors | 88/3704 | 153/8465 | 3.84e-04 | 1.20e-03 | 6.12e-04 | 88 |
| hsa0124011 | Oral cavity | OSCC | Biosynthesis of cofactors | 88/3704 | 153/8465 | 3.84e-04 | 1.20e-03 | 6.12e-04 | 88 |
| Page: 1 |
Top |
Cell-cell communication analysis |
| Identification of potential cell-cell interactions between two cell types and their ligand-receptor pairs for different disease states |
| Ligand | Receptor | LRpair | Pathway | Tissue | Disease Stage |
| Page: 1 |
Top |
Single-cell gene regulatory network inference analysis |
| Find out the significant the regulons (TFs) and the target genes of each regulon across cell types for different disease states |
| TF | Cell Type | Tissue | Disease Stage | Target Gene | RSS | Regulon Activity |
| ∗The dot plots of a searched regulon are shown for all cell subpopulations in each disease state of each tissue based on the regulon specific score inferred using pySCENIC and by calculating the average expression. |
| Page: 1 |
Top |
Somatic mutation of malignant transformation related genes |
| Annotation of somatic variants for genes involved in malignant transformation |
| Hugo Symbol | Variant Class | Variant Classification | dbSNP RS | HGVSc | HGVSp | HGVSp Short | SWISSPROT | BIOTYPE | SIFT | PolyPhen | Tumor Sample Barcode | Tissue | Histology | Sex | Age | Stage | Therapy Types | Drugs | Outcome |
| GPHN | SNV | Missense_Mutation | c.2209C>T | p.Arg737Cys | p.R737C | Q9NQX3 | protein_coding | deleterious(0.01) | probably_damaging(0.963) | TCGA-A8-A09Z-01 | Breast | breast invasive carcinoma | Female | >=65 | I/II | Unknown | Unknown | SD | |
| GPHN | SNV | Missense_Mutation | c.88C>A | p.Leu30Ile | p.L30I | Q9NQX3 | protein_coding | tolerated(0.07) | probably_damaging(0.948) | TCGA-E9-A1RH-01 | Breast | breast invasive carcinoma | Female | <65 | I/II | Chemotherapy | 5-fluorouracil | SD | |
| GPHN | SNV | Missense_Mutation | novel | c.34N>A | p.Asp12Asn | p.D12N | Q9NQX3 | protein_coding | deleterious_low_confidence(0.01) | probably_damaging(0.988) | TCGA-2W-A8YY-01 | Cervix | cervical & endocervical cancer | Female | <65 | I/II | Chemotherapy | cisplatin | CR |
| GPHN | SNV | Missense_Mutation | c.226N>A | p.Glu76Lys | p.E76K | Q9NQX3 | protein_coding | tolerated(0.31) | benign(0.069) | TCGA-JW-AAVH-01 | Cervix | cervical & endocervical cancer | Female | <65 | I/II | Unknown | Unknown | SD | |
| GPHN | SNV | Missense_Mutation | c.1962N>G | p.Ile654Met | p.I654M | Q9NQX3 | protein_coding | deleterious(0.01) | possibly_damaging(0.812) | TCGA-AA-3877-01 | Colorectum | colon adenocarcinoma | Female | >=65 | I/II | Unknown | Unknown | SD | |
| GPHN | SNV | Missense_Mutation | c.1874C>T | p.Ala625Val | p.A625V | Q9NQX3 | protein_coding | deleterious(0) | probably_damaging(0.985) | TCGA-AA-3977-01 | Colorectum | colon adenocarcinoma | Male | >=65 | I/II | Unknown | Unknown | SD | |
| GPHN | SNV | Missense_Mutation | c.1988N>T | p.Ser663Leu | p.S663L | Q9NQX3 | protein_coding | deleterious(0) | probably_damaging(1) | TCGA-AA-A00N-01 | Colorectum | colon adenocarcinoma | Male | >=65 | I/II | Unknown | Unknown | PD | |
| GPHN | SNV | Missense_Mutation | c.817N>G | p.Thr273Ala | p.T273A | Q9NQX3 | protein_coding | tolerated(0.64) | benign(0) | TCGA-AA-A01I-01 | Colorectum | colon adenocarcinoma | Male | >=65 | I/II | Unknown | Unknown | SD | |
| GPHN | SNV | Missense_Mutation | c.317N>A | p.Arg106Gln | p.R106Q | Q9NQX3 | protein_coding | deleterious(0.01) | possibly_damaging(0.457) | TCGA-AA-A01R-01 | Colorectum | colon adenocarcinoma | Male | <65 | III/IV | Chemotherapy | 5-fluorouracil | PD | |
| GPHN | SNV | Missense_Mutation | c.1976N>T | p.Gly659Val | p.G659V | Q9NQX3 | protein_coding | deleterious(0) | probably_damaging(0.995) | TCGA-CM-4743-01 | Colorectum | colon adenocarcinoma | Male | >=65 | I/II | Chemotherapy | capecitabine | SD |
| Page: 1 2 3 4 5 6 7 8 9 10 |
Top |
Related drugs of malignant transformation related genes |
| Identification of chemicals and drugs interact with genes involved in malignant transfromation |
| (DGIdb 4.0) |
| Entrez ID | Symbol | Category | Interaction Types | Drug Claim Name | Drug Name | PMIDs |
| Page: 1 |

Copyright 2023-Present -The University of Texas Health Science Center at Houston |