
|
|||||
|
 | |
| |
| |
| |
| |
| |
|
Gene: EIF3J |
Gene summary for EIF3J |
| Gene information | Species | Human | Gene symbol | EIF3J | Gene ID | 8669 |
| Gene name | eukaryotic translation initiation factor 3 subunit J | |
| Gene Alias | EIF3S1 | |
| Cytomap | 15q21.1 | |
| Gene Type | protein-coding | GO ID | GO:0001732 | UniProtAcc | O75822 |
Top |
Malignant transformation analysis |
| Identification of the aberrant gene expression in precancerous and cancerous lesions by comparing the gene expression of stem-like cells in diseased tissues with normal stem cells |
| Entrez ID | Symbol | Replicates | Species | Organ | Tissue | Adj P-value | Log2FC | Malignancy |
| 8669 | EIF3J | GSM5353243_PA_PR5261_T1_S23_L002 | Human | Prostate | Tumor | 8.86e-10 | -4.18e-01 | 0.1545 |
| 8669 | EIF3J | GSM5353244_PA_PR5261_T2_S24_L002 | Human | Prostate | Tumor | 8.51e-10 | -5.18e-01 | 0.1569 |
| 8669 | EIF3J | P1_S1_AK | Human | Skin | AK | 1.20e-15 | 4.48e-01 | -0.3399 |
| 8669 | EIF3J | P2_S3_AK | Human | Skin | AK | 4.51e-06 | 2.61e-01 | -0.3287 |
| 8669 | EIF3J | P4_S8_cSCC | Human | Skin | cSCC | 1.11e-08 | 3.66e-01 | -0.3095 |
| 8669 | EIF3J | P5_S10_cSCC | Human | Skin | cSCC | 1.13e-19 | 4.01e-01 | -0.299 |
| 8669 | EIF3J | P1_cSCC | Human | Skin | cSCC | 2.57e-45 | 1.62e+00 | 0.0292 |
| 8669 | EIF3J | P2_cSCC | Human | Skin | cSCC | 1.55e-29 | 9.13e-01 | -0.024 |
| 8669 | EIF3J | P4_cSCC | Human | Skin | cSCC | 5.78e-35 | 9.10e-01 | -0.00290000000000005 |
| 8669 | EIF3J | P10_cSCC | Human | Skin | cSCC | 7.84e-50 | 1.61e+00 | 0.1017 |
| 8669 | EIF3J | cSCC_p8 | Human | Skin | cSCC | 2.66e-07 | 6.14e-02 | -0.1971 |
| 8669 | EIF3J | cSCC_p9 | Human | Skin | cSCC | 9.45e-03 | -5.49e-02 | -0.1991 |
| 8669 | EIF3J | Pat01-B | Human | Stomach | GC | 6.41e-10 | 1.77e-01 | 0.5754 |
| 8669 | EIF3J | Pat02-B | Human | Stomach | GC | 5.08e-47 | 4.61e-01 | 0.0368 |
| 8669 | EIF3J | Pat03-B | Human | Stomach | GC | 2.36e-28 | 3.97e-01 | 0.3693 |
| 8669 | EIF3J | Pat04-B | Human | Stomach | GC | 7.34e-24 | 3.34e-01 | -0.1483 |
| 8669 | EIF3J | Pat05-B | Human | Stomach | GC | 3.83e-10 | 2.32e-01 | -0.0353 |
| 8669 | EIF3J | Pat06-B | Human | Stomach | GC | 4.79e-48 | 3.39e-01 | -0.1961 |
| 8669 | EIF3J | Pat07-B | Human | Stomach | GC | 2.25e-04 | 3.24e-01 | 0.0935 |
| 8669 | EIF3J | Pat09-B | Human | Stomach | GC | 6.18e-05 | 1.44e-01 | -0.0359 |
| Page: 1 2 3 4 5 6 7 8 9 |
| Tissue | Expression Dynamics | Abbreviation |
| Esophagus | 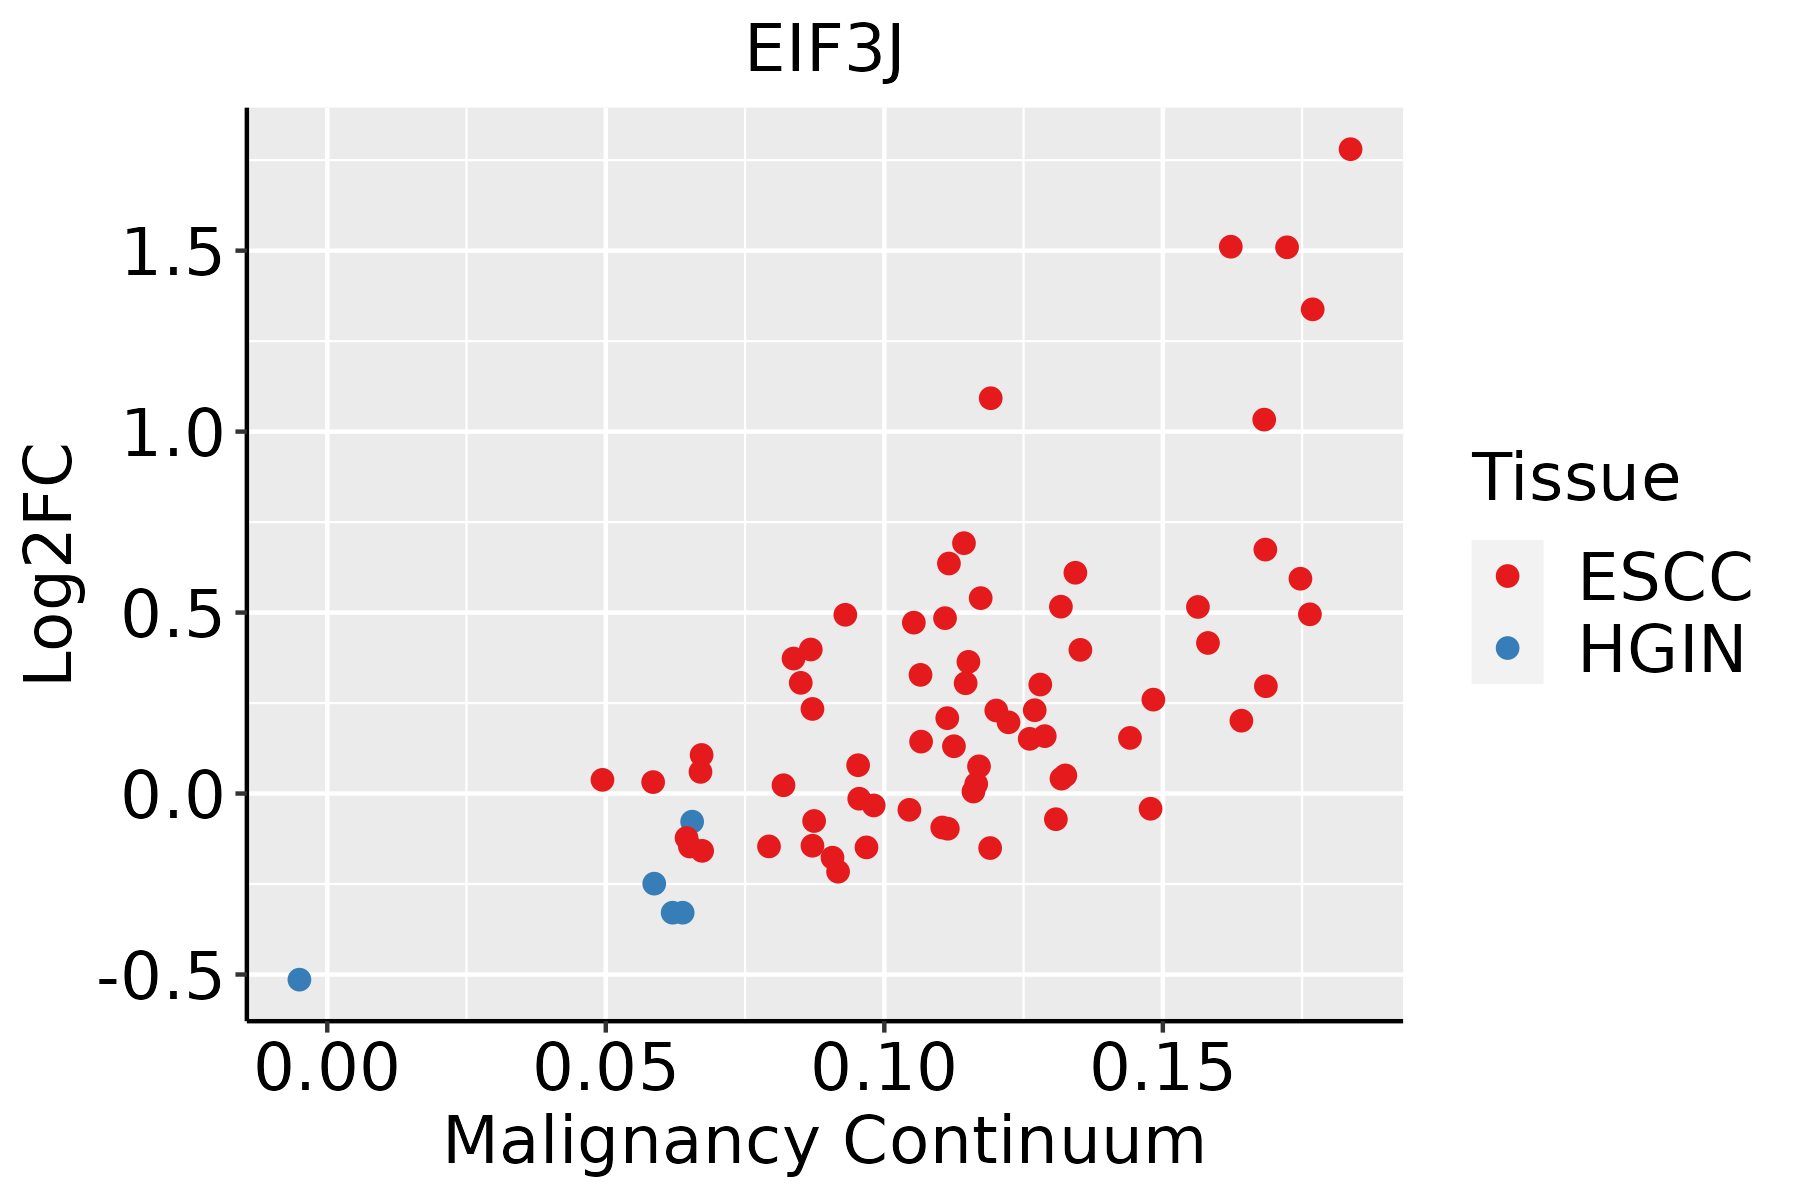 | ESCC: Esophageal squamous cell carcinoma |
| HGIN: High-grade intraepithelial neoplasias | ||
| LGIN: Low-grade intraepithelial neoplasias | ||
| GC | 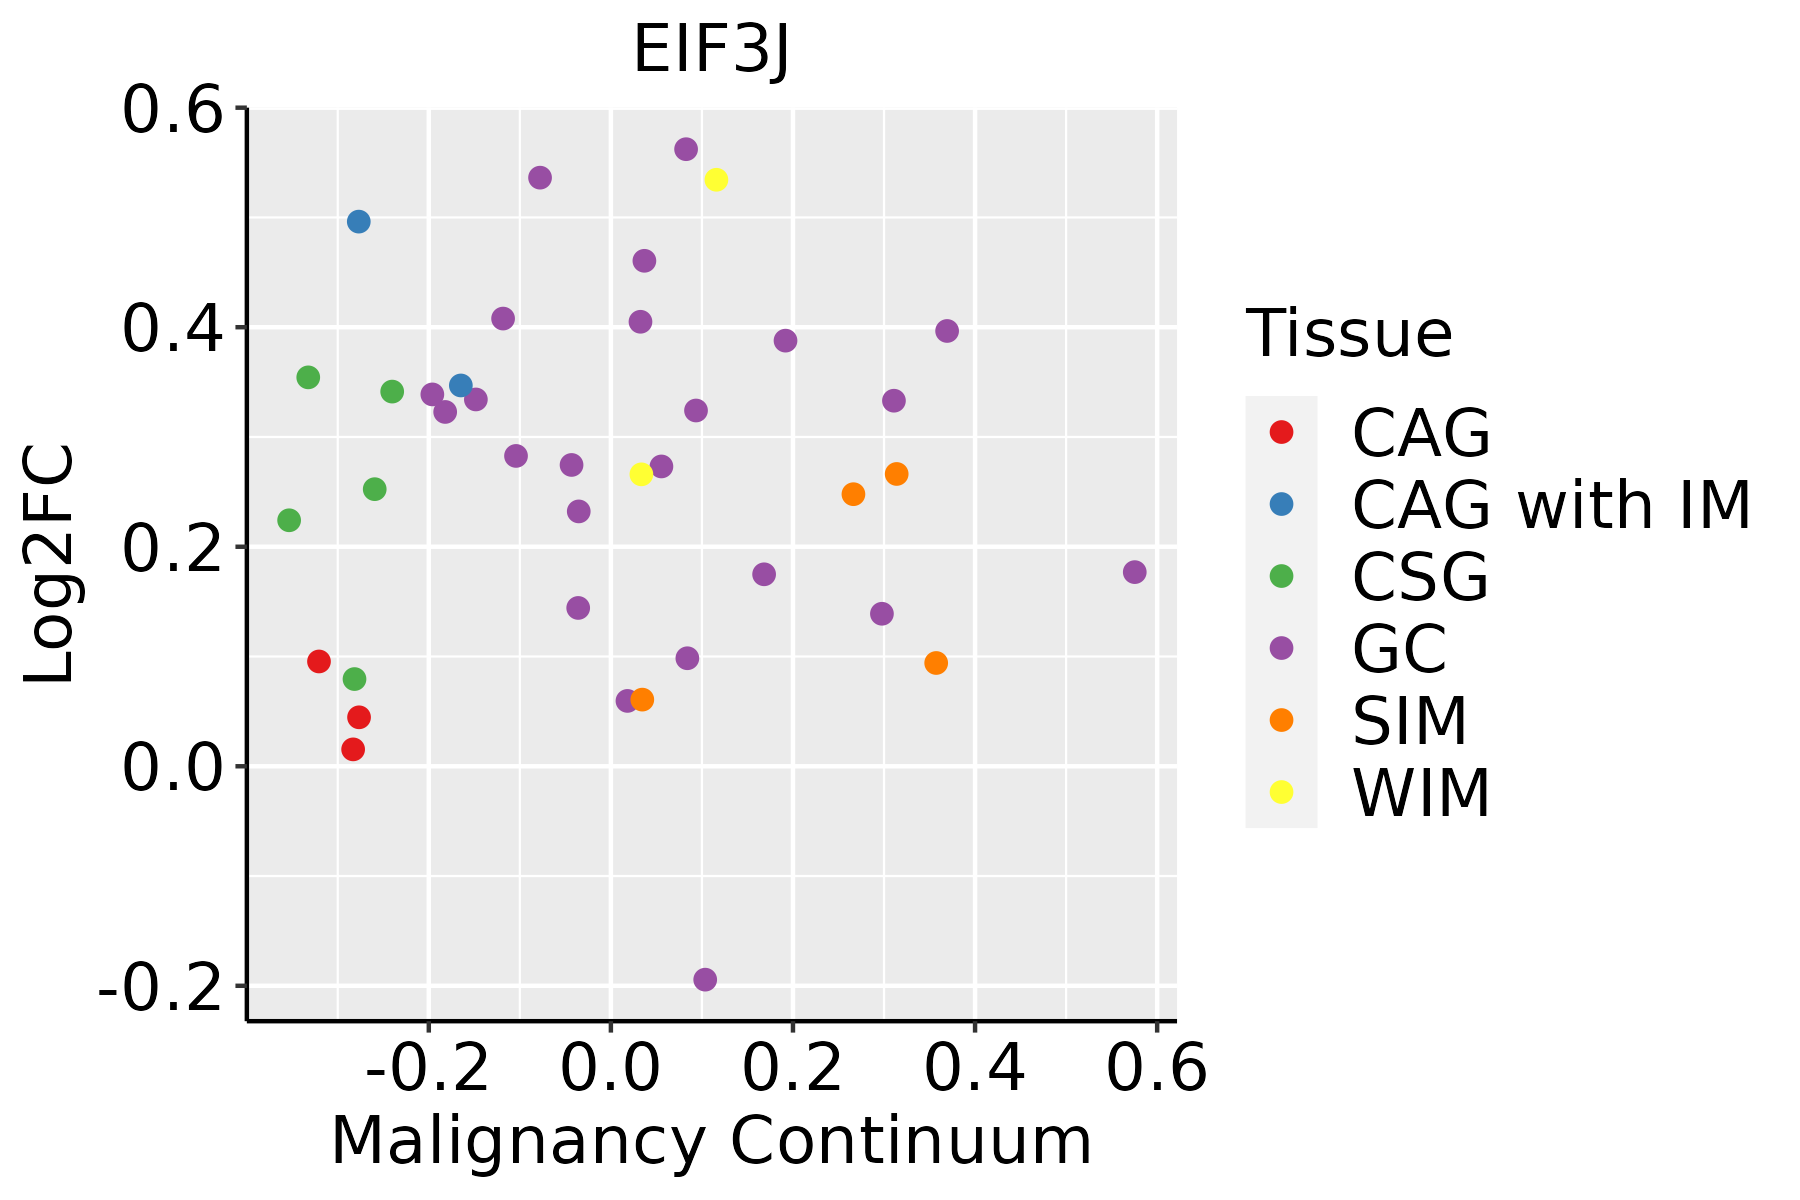 | CAG: Chronic atrophic gastritis |
| CAG with IM: Chronic atrophic gastritis with intestinal metaplasia | ||
| CSG: Chronic superficial gastritis | ||
| GC: Gastric cancer | ||
| SIM: Severe intestinal metaplasia | ||
| WIM: Wild intestinal metaplasia | ||
| Liver | 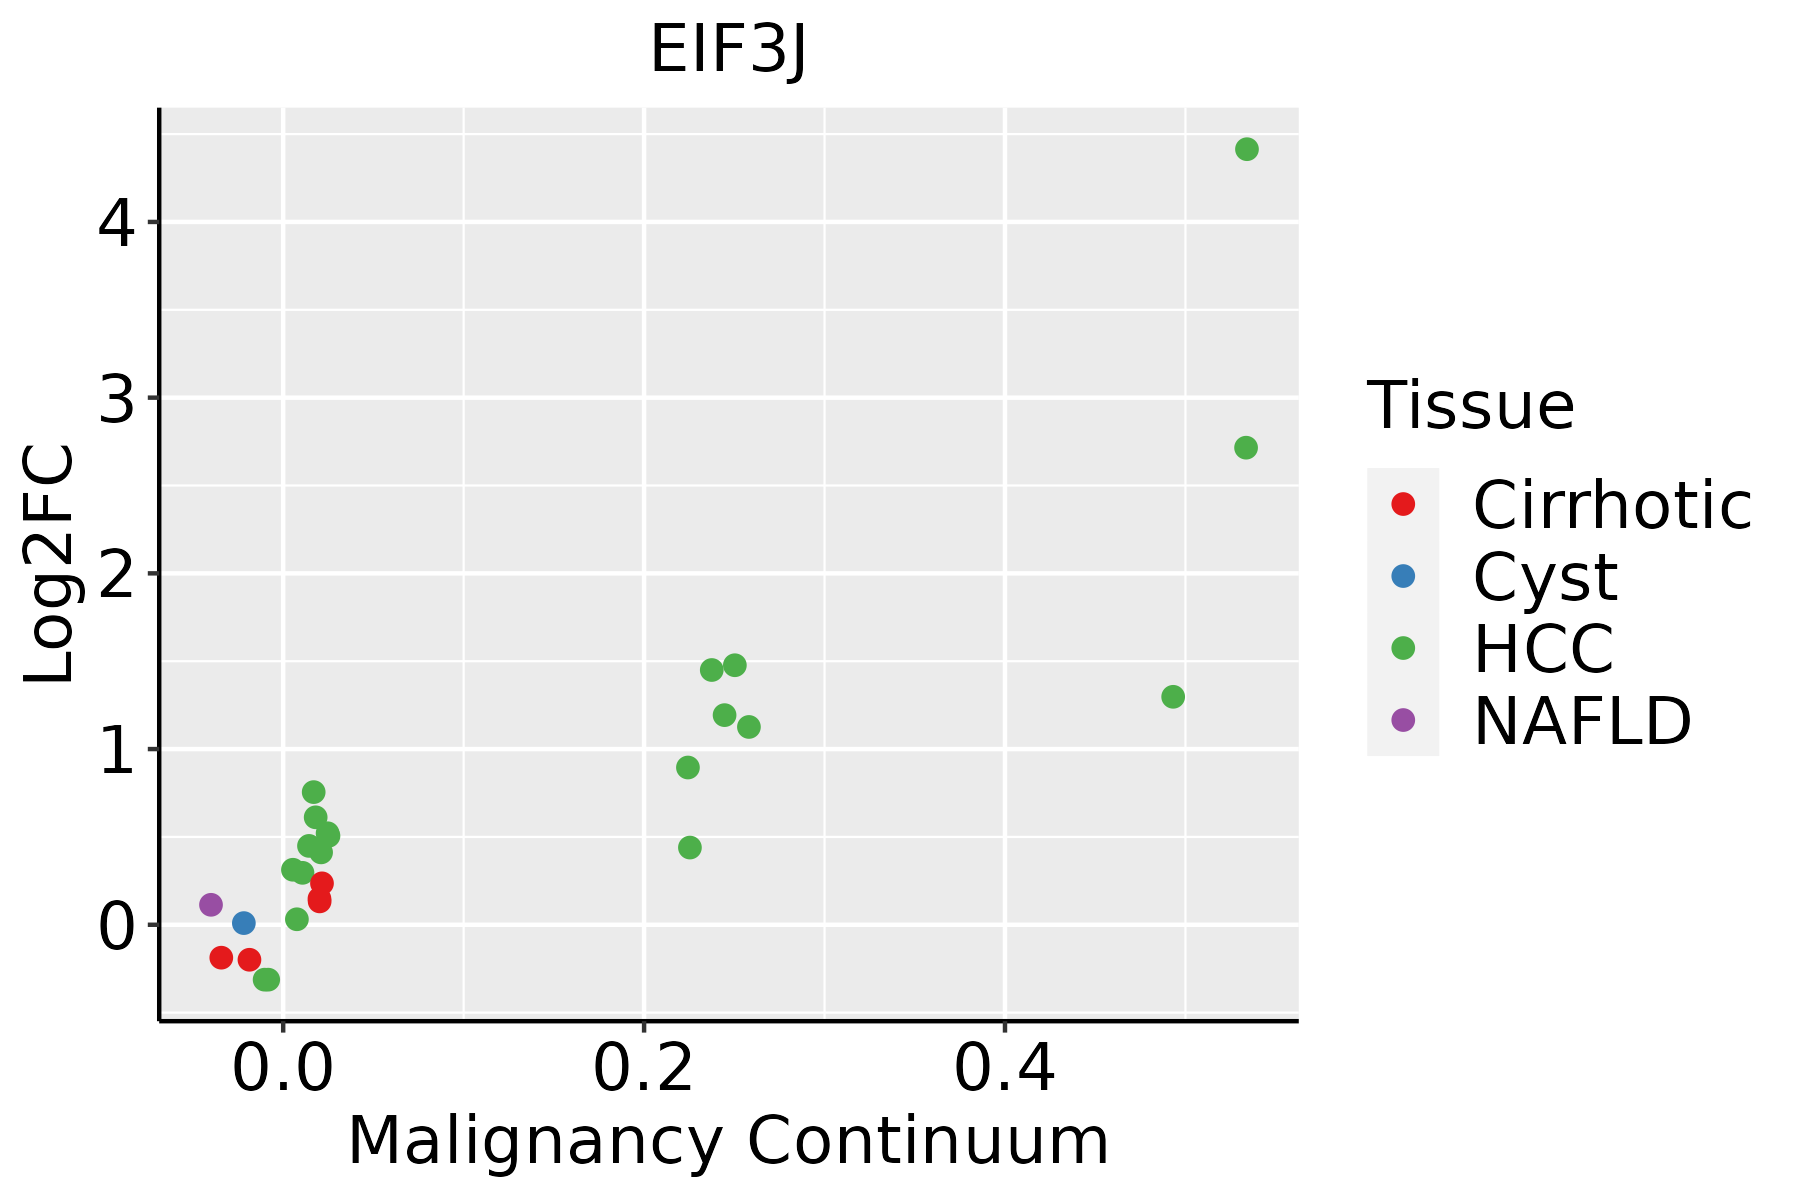 | HCC: Hepatocellular carcinoma |
| NAFLD: Non-alcoholic fatty liver disease | ||
| Oral Cavity |  | EOLP: Erosive Oral lichen planus |
| LP: leukoplakia | ||
| NEOLP: Non-erosive oral lichen planus | ||
| OSCC: Oral squamous cell carcinoma | ||
| Prostate | 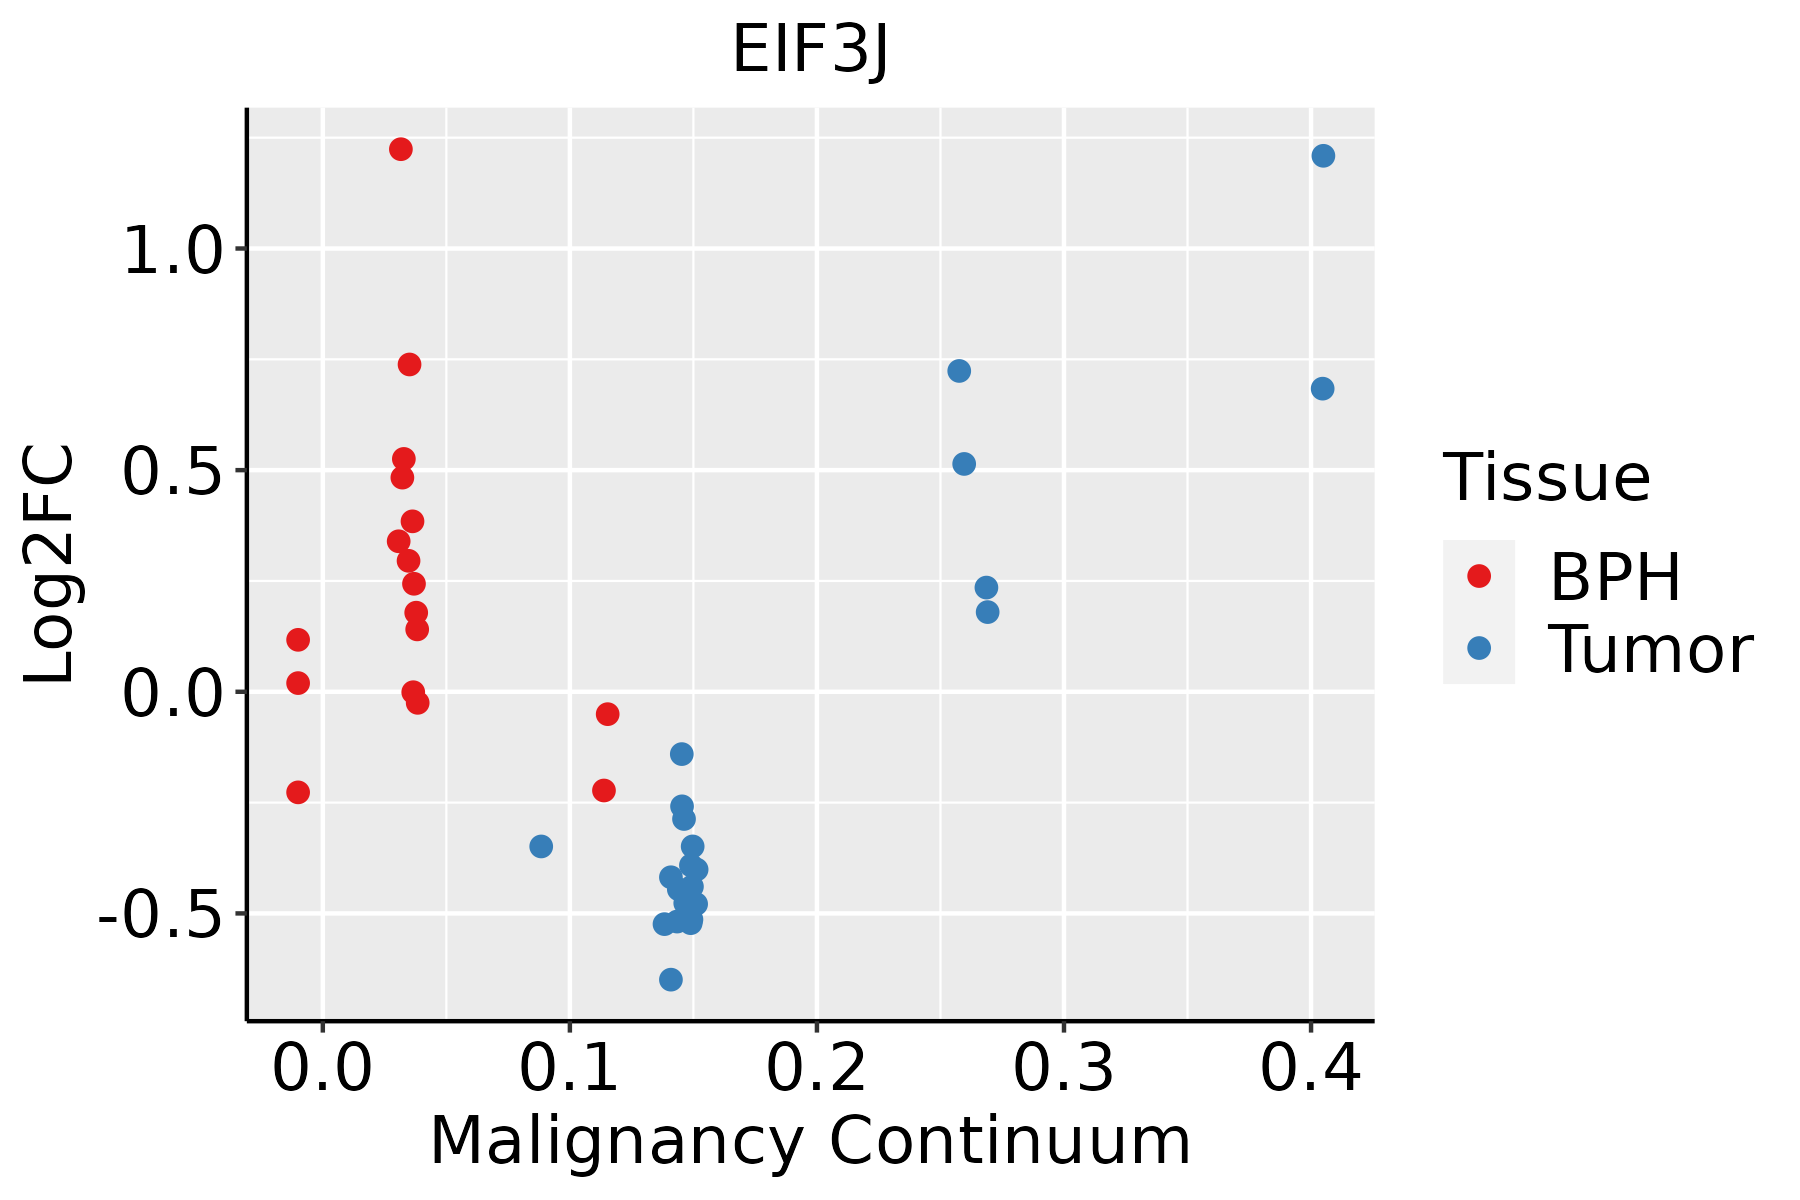 | BPH: Benign Prostatic Hyperplasia |
| Skin |  | AK: Actinic keratosis |
| cSCC: Cutaneous squamous cell carcinoma | ||
| SCCIS:squamous cell carcinoma in situ | ||
| Thyroid | 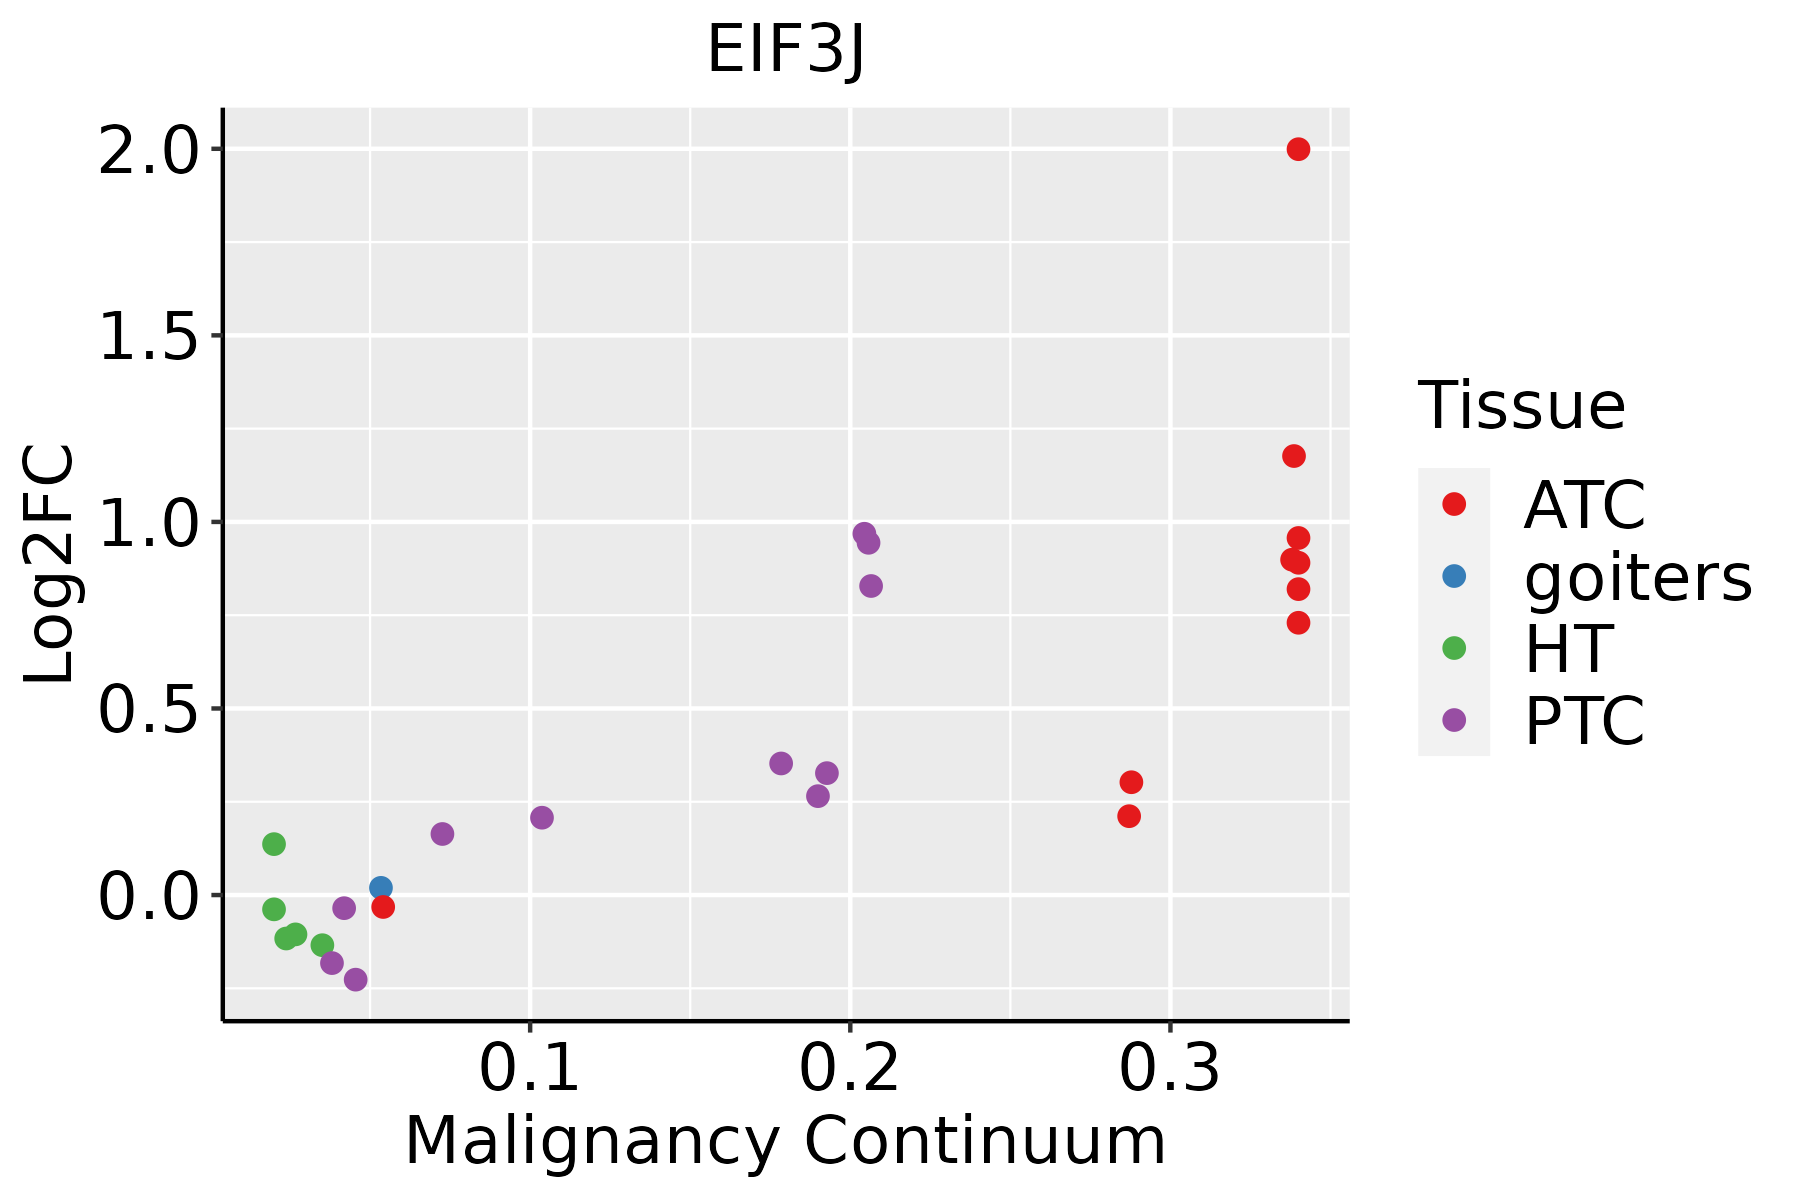 | ATC: Anaplastic thyroid cancer |
| HT: Hashimoto's thyroiditis | ||
| PTC: Papillary thyroid cancer |
| ∗log2FC in expression of this searched gene in stem-like cells from each diseased tissue sample relative to stem-like cells in normal samples in each tissue plotted against the malignancy continuum. Samples are colored based on if they are from different disease stage. |
Top |
Malignant transformation related pathway analysis |
| Find out the enriched GO biological processes and KEGG pathways involved in transition from healthy to precancer to cancer |
| Tissue | Disease Stage | Enriched GO biological Processes |
| Colorectum | AD |  |
| Colorectum | SER |  |
| Colorectum | MSS |  |
| Colorectum | MSI-H |  |
| Colorectum | FAP |  |
| ∗Top 15 enriched GO BP terms are showed in the bar plot of each disease state in each tissue. Each row represents a significant GO biological process which is colored according to the -log10(p.adjust). |
| Page: 1 2 3 4 5 6 7 8 9 |
| GO ID | Tissue | Disease Stage | Description | Gene Ratio | Bg Ratio | pvalue | p.adjust | Count |
| GO:000218127 | Esophagus | HGIN | cytoplasmic translation | 108/2587 | 148/18723 | 1.70e-60 | 1.02e-56 | 108 |
| GO:002261327 | Esophagus | HGIN | ribonucleoprotein complex biogenesis | 158/2587 | 463/18723 | 2.61e-29 | 5.23e-26 | 158 |
| GO:007182627 | Esophagus | HGIN | ribonucleoprotein complex subunit organization | 84/2587 | 227/18723 | 1.34e-18 | 5.37e-16 | 84 |
| GO:002261827 | Esophagus | HGIN | ribonucleoprotein complex assembly | 82/2587 | 220/18723 | 2.07e-18 | 7.36e-16 | 82 |
| GO:000641320 | Esophagus | HGIN | translational initiation | 55/2587 | 118/18723 | 7.33e-18 | 2.31e-15 | 55 |
| GO:000218320 | Esophagus | HGIN | cytoplasmic translational initiation | 19/2587 | 34/18723 | 1.01e-08 | 6.44e-07 | 19 |
| GO:000173220 | Esophagus | HGIN | formation of cytoplasmic translation initiation complex | 10/2587 | 16/18723 | 8.99e-06 | 2.64e-04 | 10 |
| GO:0022613111 | Esophagus | ESCC | ribonucleoprotein complex biogenesis | 365/8552 | 463/18723 | 1.74e-49 | 1.11e-45 | 365 |
| GO:0002181111 | Esophagus | ESCC | cytoplasmic translation | 135/8552 | 148/18723 | 4.17e-32 | 2.65e-29 | 135 |
| GO:0006413110 | Esophagus | ESCC | translational initiation | 100/8552 | 118/18723 | 1.16e-18 | 1.25e-16 | 100 |
| GO:0071826111 | Esophagus | ESCC | ribonucleoprotein complex subunit organization | 166/8552 | 227/18723 | 2.94e-17 | 2.42e-15 | 166 |
| GO:0022618111 | Esophagus | ESCC | ribonucleoprotein complex assembly | 159/8552 | 220/18723 | 8.19e-16 | 5.71e-14 | 159 |
| GO:0002183110 | Esophagus | ESCC | cytoplasmic translational initiation | 32/8552 | 34/18723 | 2.18e-09 | 4.94e-08 | 32 |
| GO:0001732110 | Esophagus | ESCC | formation of cytoplasmic translation initiation complex | 15/8552 | 16/18723 | 7.15e-05 | 5.38e-04 | 15 |
| GO:000218112 | Liver | Cirrhotic | cytoplasmic translation | 120/4634 | 148/18723 | 2.95e-47 | 1.85e-43 | 120 |
| GO:002261312 | Liver | Cirrhotic | ribonucleoprotein complex biogenesis | 231/4634 | 463/18723 | 3.28e-32 | 6.86e-29 | 231 |
| GO:000641312 | Liver | Cirrhotic | translational initiation | 76/4634 | 118/18723 | 8.36e-20 | 2.18e-17 | 76 |
| GO:007182612 | Liver | Cirrhotic | ribonucleoprotein complex subunit organization | 115/4634 | 227/18723 | 2.67e-17 | 3.63e-15 | 115 |
| GO:002261812 | Liver | Cirrhotic | ribonucleoprotein complex assembly | 112/4634 | 220/18723 | 4.35e-17 | 5.81e-15 | 112 |
| GO:000218312 | Liver | Cirrhotic | cytoplasmic translational initiation | 26/4634 | 34/18723 | 3.38e-10 | 1.63e-08 | 26 |
| Page: 1 2 3 4 5 6 7 |
| Pathway ID | Tissue | Disease Stage | Description | Gene Ratio | Bg Ratio | pvalue | p.adjust | qvalue | Count |
| Page: 1 |
Top |
Cell-cell communication analysis |
| Identification of potential cell-cell interactions between two cell types and their ligand-receptor pairs for different disease states |
| Ligand | Receptor | LRpair | Pathway | Tissue | Disease Stage |
| Page: 1 |
Top |
Single-cell gene regulatory network inference analysis |
| Find out the significant the regulons (TFs) and the target genes of each regulon across cell types for different disease states |
| TF | Cell Type | Tissue | Disease Stage | Target Gene | RSS | Regulon Activity |
| ∗The dot plots of a searched regulon are shown for all cell subpopulations in each disease state of each tissue based on the regulon specific score inferred using pySCENIC and by calculating the average expression. |
| Page: 1 |
Top |
Somatic mutation of malignant transformation related genes |
| Annotation of somatic variants for genes involved in malignant transformation |
| Hugo Symbol | Variant Class | Variant Classification | dbSNP RS | HGVSc | HGVSp | HGVSp Short | SWISSPROT | BIOTYPE | SIFT | PolyPhen | Tumor Sample Barcode | Tissue | Histology | Sex | Age | Stage | Therapy Types | Drugs | Outcome |
| EIF3J | SNV | Missense_Mutation | novel | c.422C>T | p.Ala141Val | p.A141V | O75822 | protein_coding | tolerated(0.08) | benign(0.072) | TCGA-LL-A9Q3-01 | Breast | breast invasive carcinoma | Female | >=65 | III/IV | Immunotherapy | herceptin | CR |
| EIF3J | SNV | Missense_Mutation | novel | c.596N>A | p.Ile199Asn | p.I199N | O75822 | protein_coding | deleterious(0) | probably_damaging(0.961) | TCGA-AA-3877-01 | Colorectum | colon adenocarcinoma | Female | >=65 | I/II | Unknown | Unknown | SD |
| EIF3J | SNV | Missense_Mutation | c.208A>C | p.Lys70Gln | p.K70Q | O75822 | protein_coding | tolerated(0.26) | probably_damaging(0.987) | TCGA-AG-3892-01 | Colorectum | rectum adenocarcinoma | Female | <65 | I/II | Unknown | Unknown | SD | |
| EIF3J | SNV | Missense_Mutation | c.436N>T | p.Asp146Tyr | p.D146Y | O75822 | protein_coding | deleterious(0) | probably_damaging(0.983) | TCGA-AG-A002-01 | Colorectum | rectum adenocarcinoma | Male | <65 | I/II | Unknown | Unknown | SD | |
| EIF3J | SNV | Missense_Mutation | novel | c.650N>T | p.Ser217Ile | p.S217I | O75822 | protein_coding | tolerated(0.11) | possibly_damaging(0.879) | TCGA-A5-A1OF-01 | Endometrium | uterine corpus endometrioid carcinoma | Female | <65 | I/II | Unknown | Unknown | SD |
| EIF3J | SNV | Missense_Mutation | novel | c.645G>T | p.Lys215Asn | p.K215N | O75822 | protein_coding | deleterious(0) | probably_damaging(0.987) | TCGA-AJ-A3BG-01 | Endometrium | uterine corpus endometrioid carcinoma | Female | >=65 | I/II | Chemotherapy | carboplatin | PD |
| EIF3J | SNV | Missense_Mutation | c.586N>G | p.Leu196Val | p.L196V | O75822 | protein_coding | tolerated(0.16) | possibly_damaging(0.642) | TCGA-AP-A056-01 | Endometrium | uterine corpus endometrioid carcinoma | Female | <65 | I/II | Unknown | Unknown | SD | |
| EIF3J | SNV | Missense_Mutation | novel | c.463N>T | p.Asp155Tyr | p.D155Y | O75822 | protein_coding | deleterious(0) | probably_damaging(0.979) | TCGA-AP-A1DV-01 | Endometrium | uterine corpus endometrioid carcinoma | Female | <65 | I/II | Unknown | Unknown | SD |
| EIF3J | SNV | Missense_Mutation | novel | c.513A>C | p.Glu171Asp | p.E171D | O75822 | protein_coding | deleterious(0) | probably_damaging(0.914) | TCGA-AP-A1E0-01 | Endometrium | uterine corpus endometrioid carcinoma | Female | <65 | III/IV | Chemotherapy | paclitaxel | SD |
| EIF3J | SNV | Missense_Mutation | novel | c.341N>C | p.Leu114Ser | p.L114S | O75822 | protein_coding | deleterious(0) | probably_damaging(0.933) | TCGA-AX-A05Z-01 | Endometrium | uterine corpus endometrioid carcinoma | Female | <65 | III/IV | Chemotherapy | adriamycin | SD |
| Page: 1 2 3 |
Top |
Related drugs of malignant transformation related genes |
| Identification of chemicals and drugs interact with genes involved in malignant transfromation |
| (DGIdb 4.0) |
| Entrez ID | Symbol | Category | Interaction Types | Drug Claim Name | Drug Name | PMIDs |
| Page: 1 |

Copyright 2023-Present -The University of Texas Health Science Center at Houston |