| Tissue | Expression Dynamics | Abbreviation |
| Colorectum (GSE201348) |  | FAP: Familial adenomatous polyposis |
| CRC: Colorectal cancer |
| Colorectum (HTA11) | 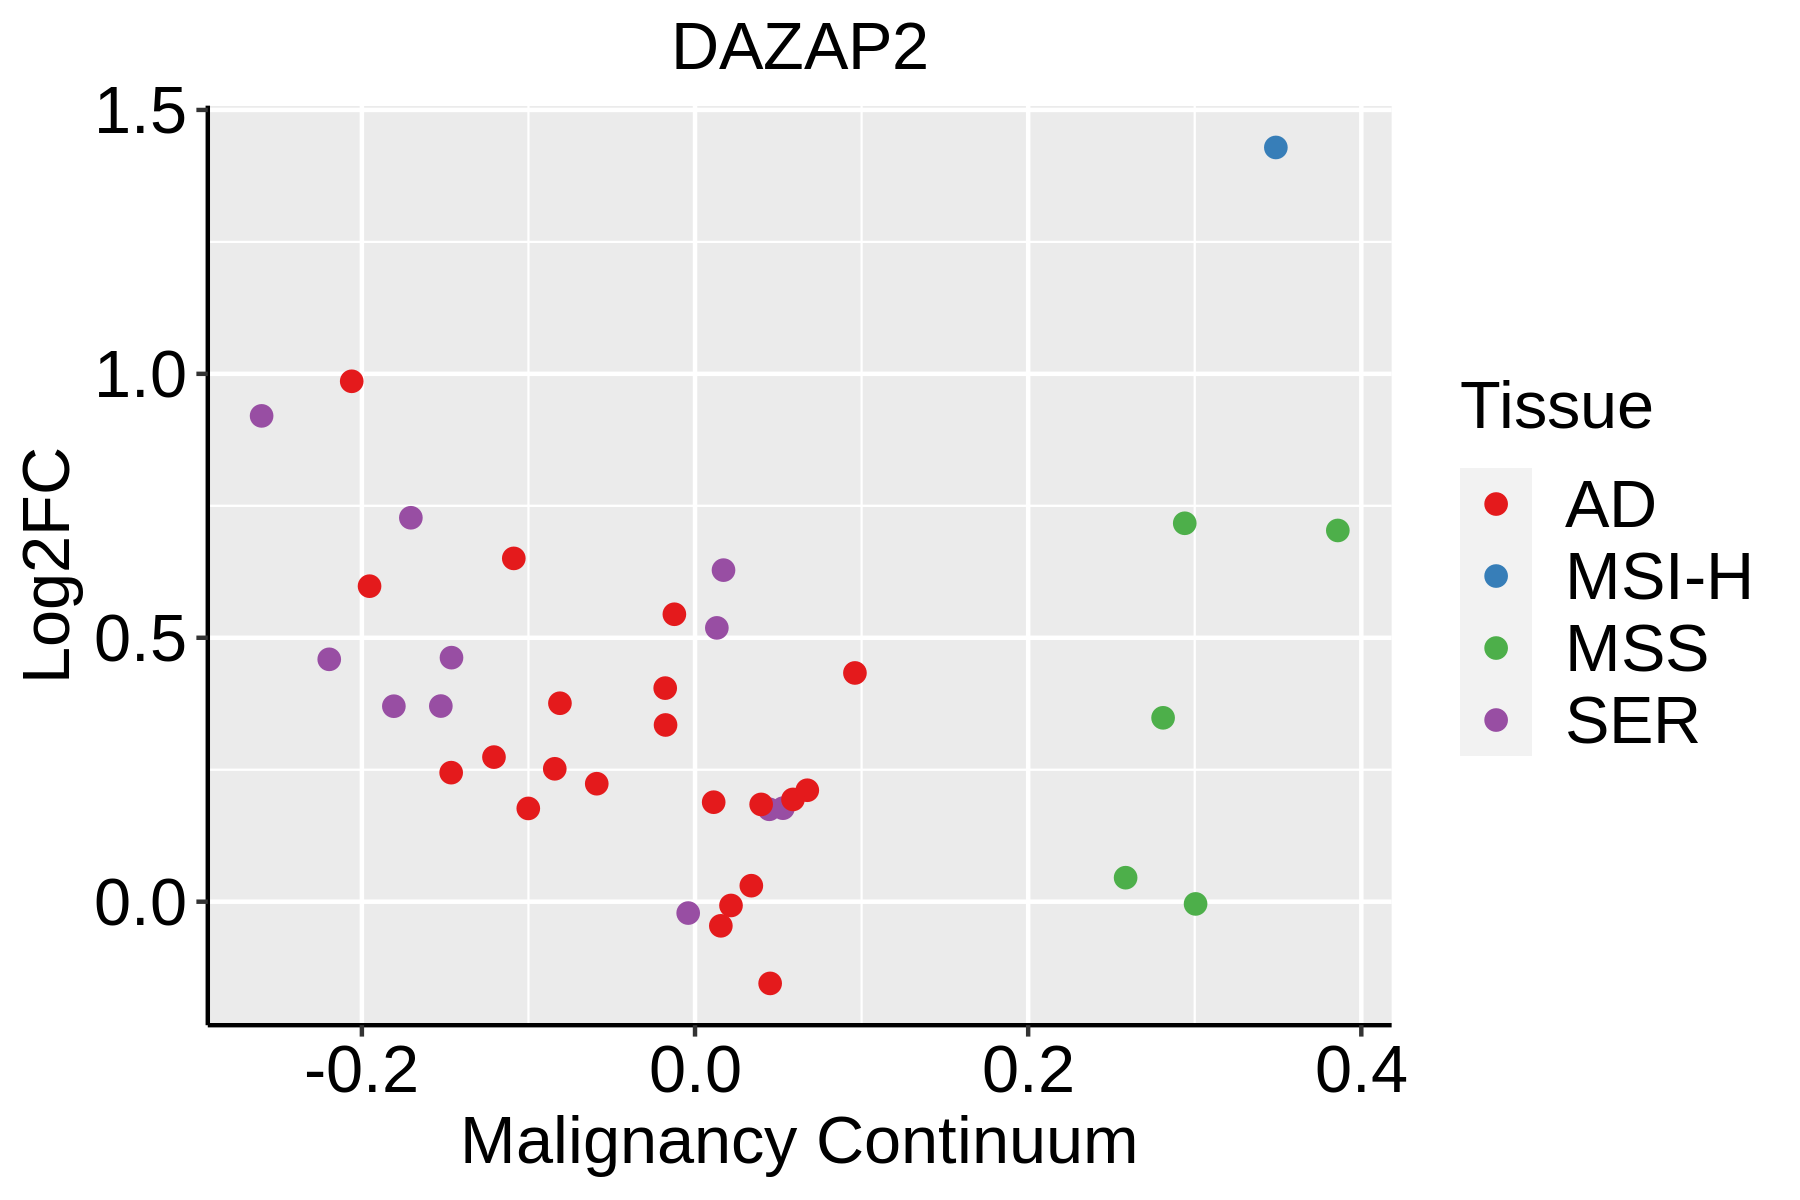 | AD: Adenomas |
| SER: Sessile serrated lesions |
| MSI-H: Microsatellite-high colorectal cancer |
| MSS: Microsatellite stable colorectal cancer |
| Endometrium |  | AEH: Atypical endometrial hyperplasia |
| EEC: Endometrioid Cancer |
| Esophagus |  | ESCC: Esophageal squamous cell carcinoma |
| HGIN: High-grade intraepithelial neoplasias |
| LGIN: Low-grade intraepithelial neoplasias |
| Liver |  | HCC: Hepatocellular carcinoma |
| NAFLD: Non-alcoholic fatty liver disease |
| Oral Cavity | 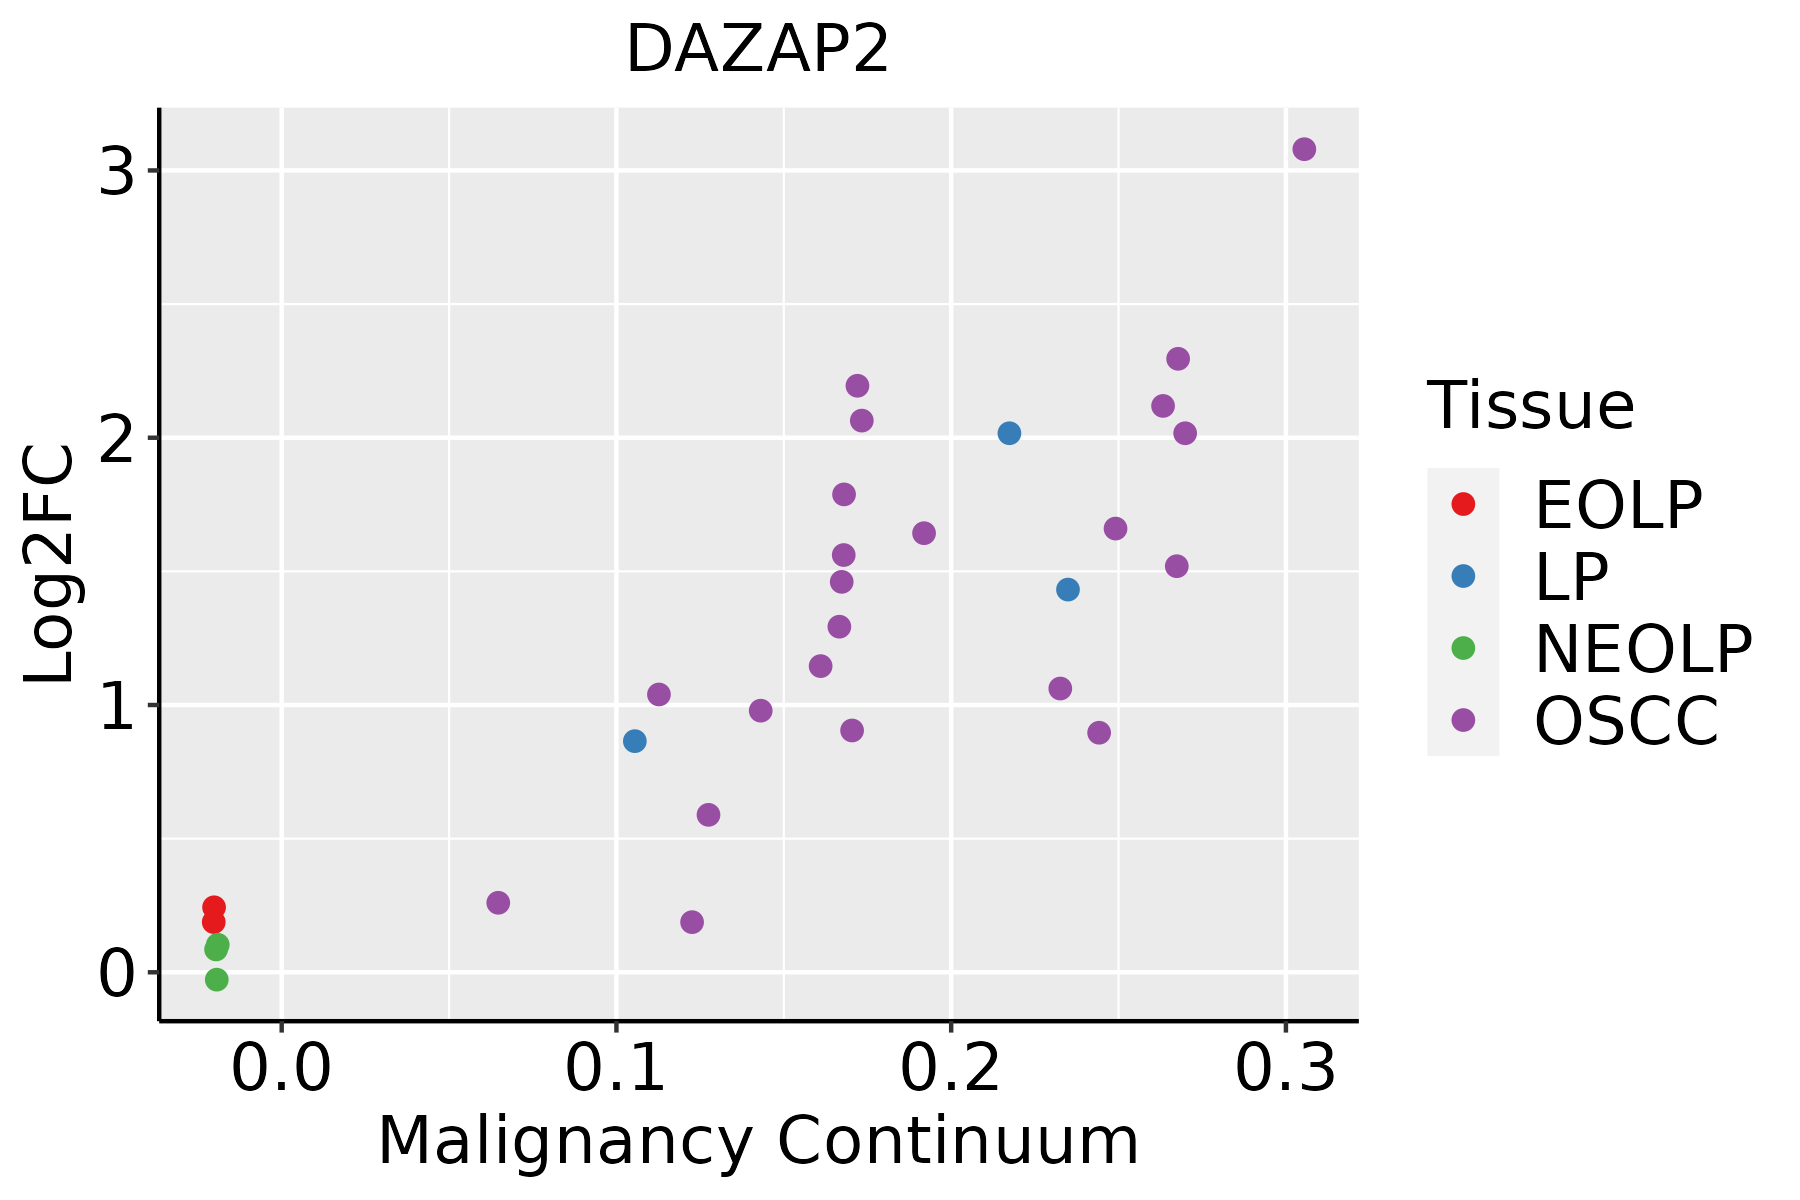 | EOLP: Erosive Oral lichen planus |
| LP: leukoplakia |
| NEOLP: Non-erosive oral lichen planus |
| OSCC: Oral squamous cell carcinoma |
| Prostate | 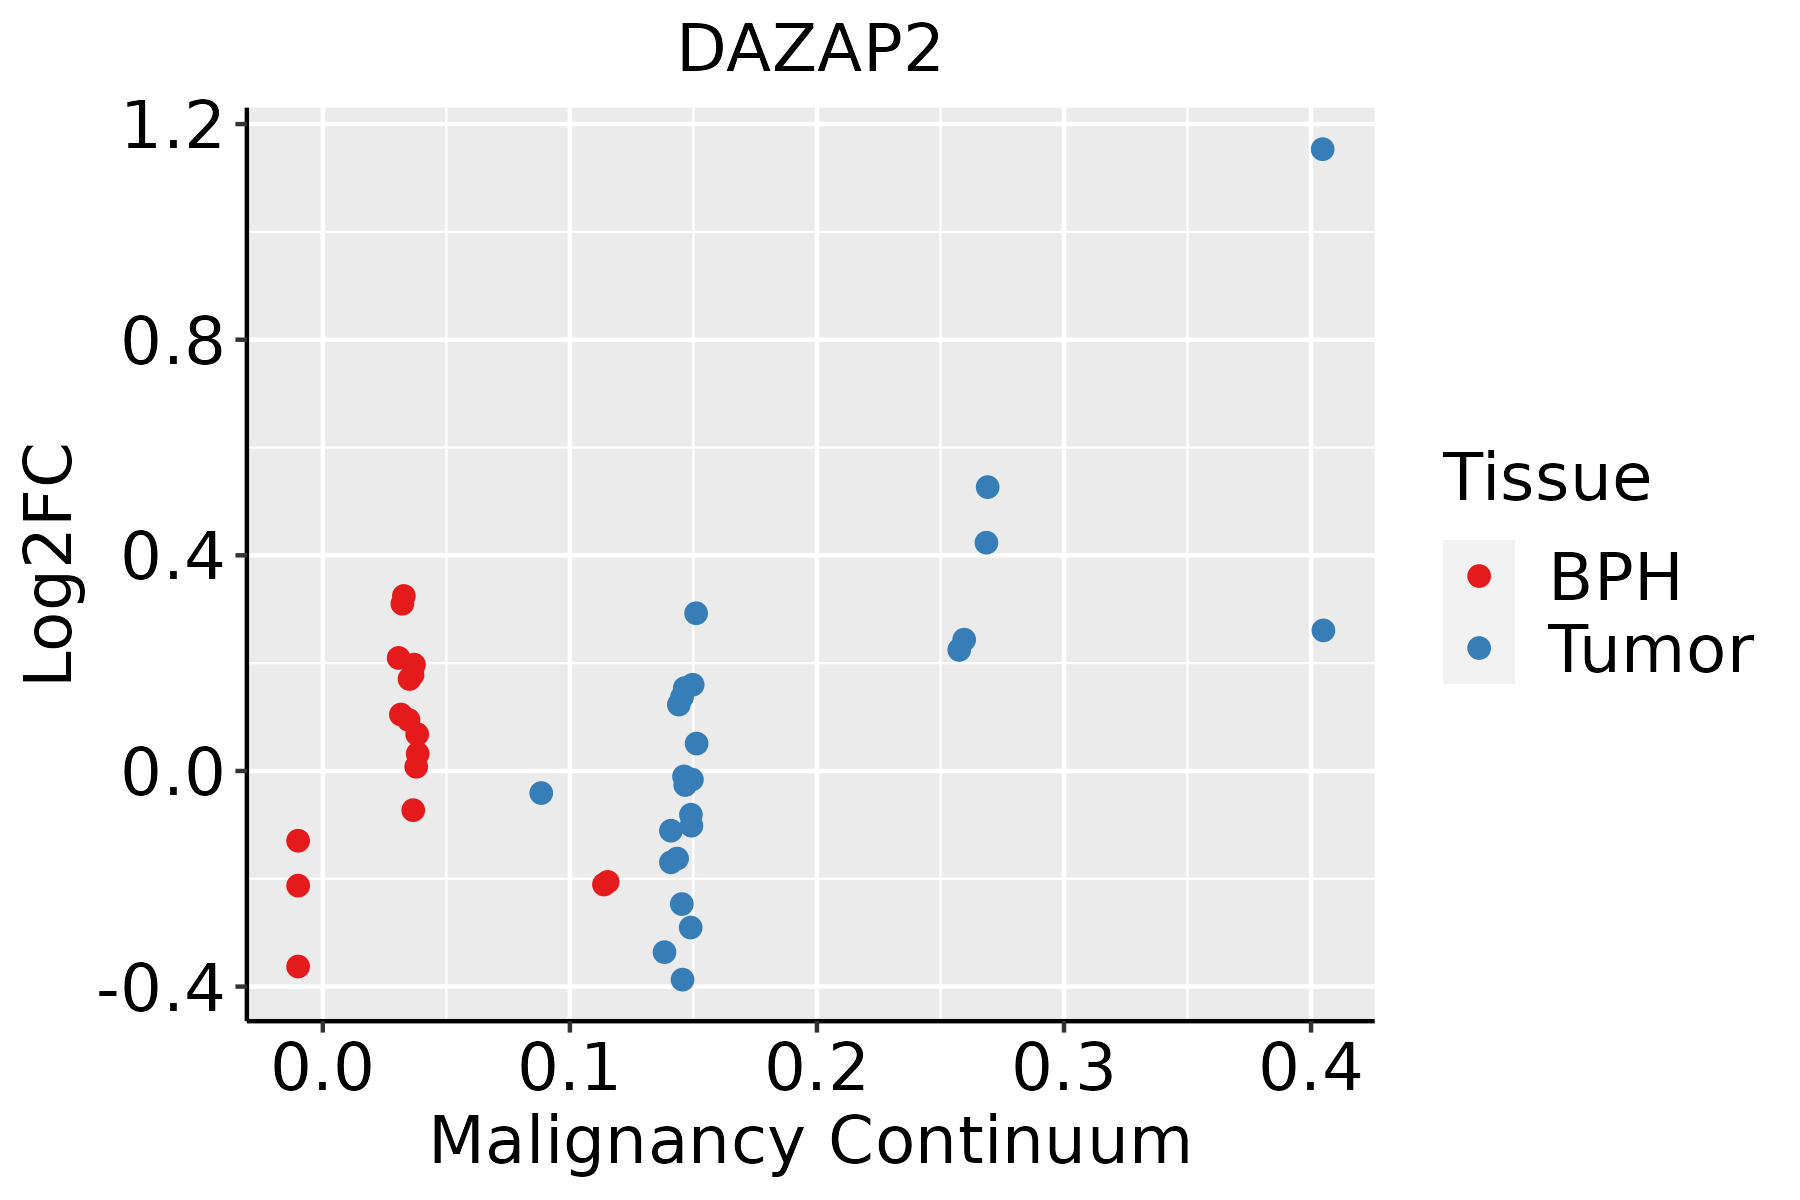 | BPH: Benign Prostatic Hyperplasia |
| Skin | 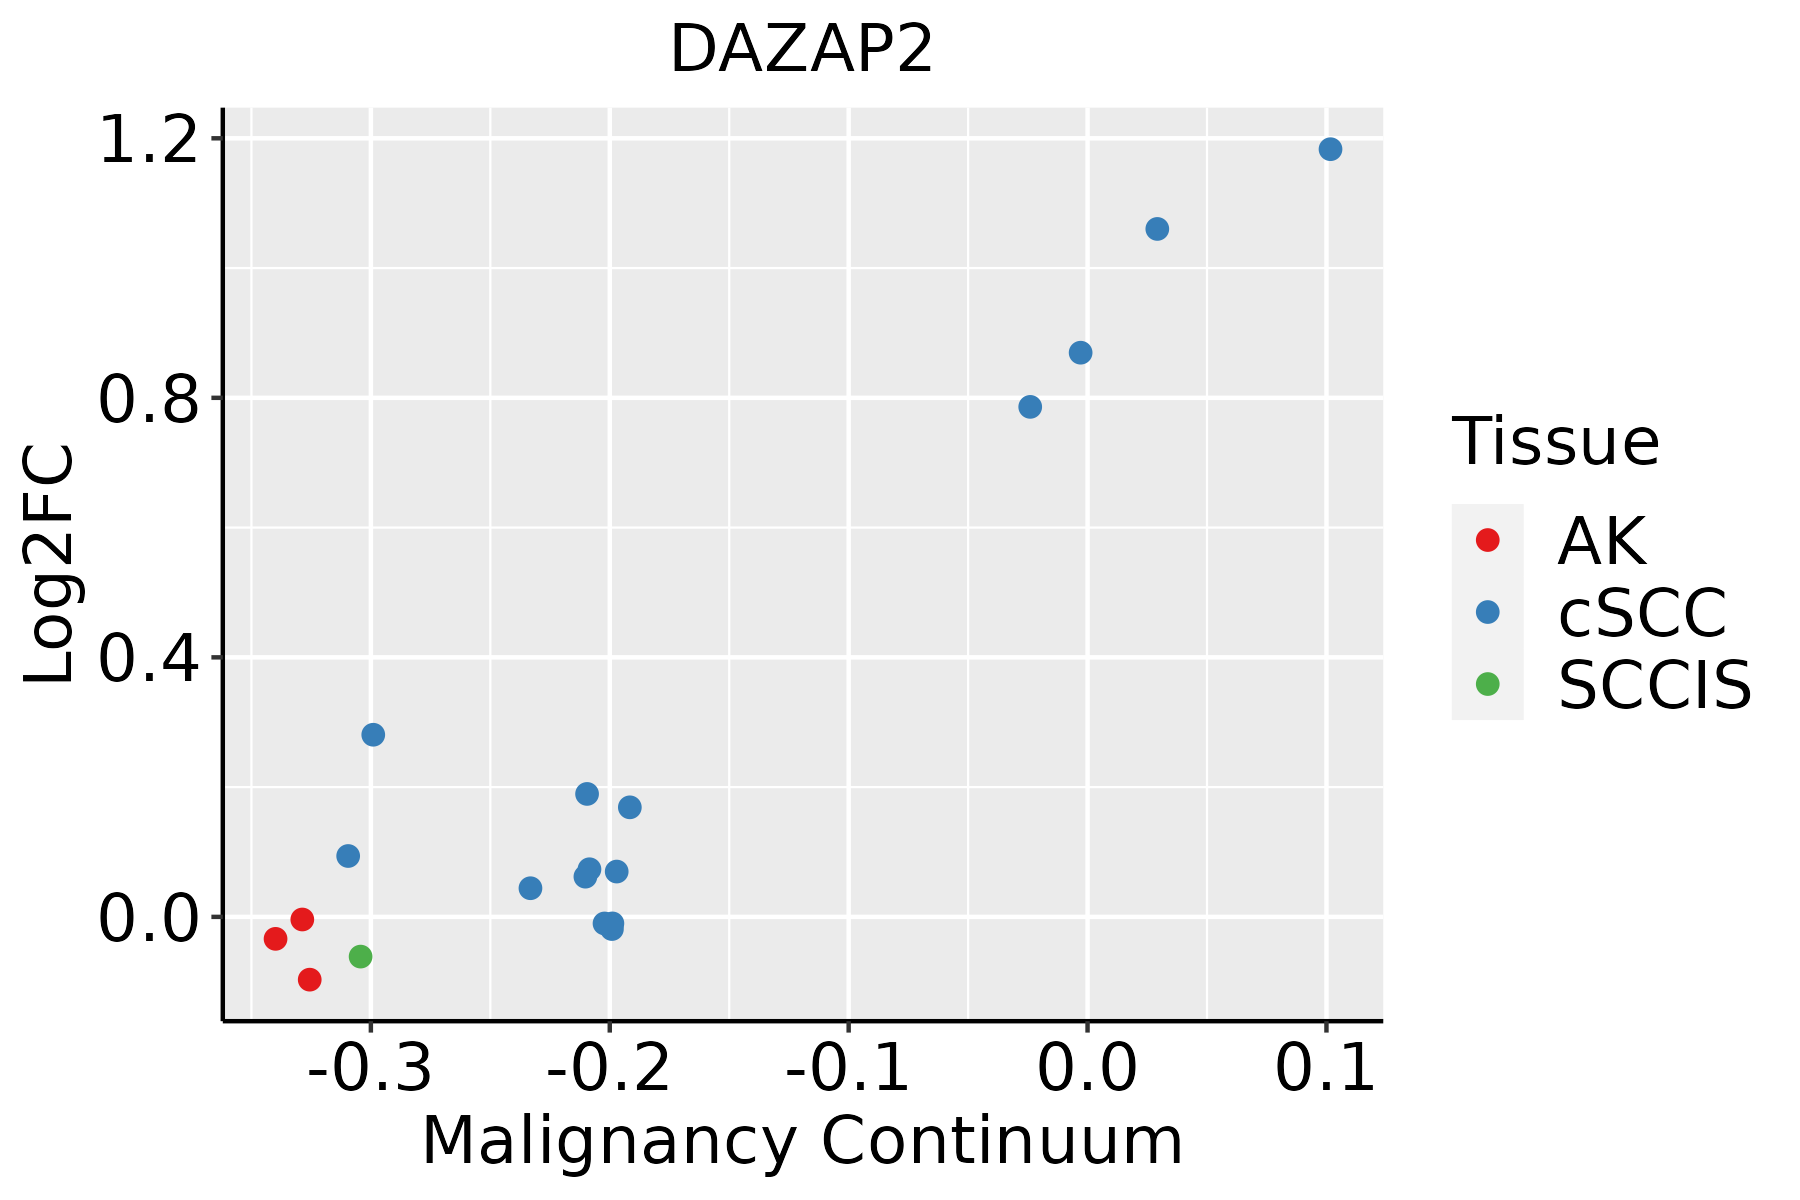 | AK: Actinic keratosis |
| cSCC: Cutaneous squamous cell carcinoma |
| SCCIS:squamous cell carcinoma in situ |
| Thyroid |  | ATC: Anaplastic thyroid cancer |
| HT: Hashimoto's thyroiditis |
| PTC: Papillary thyroid cancer |
| GO ID | Tissue | Disease Stage | Description | Gene Ratio | Bg Ratio | pvalue | p.adjust | Count |
| GO:0033674 | Colorectum | AD | positive regulation of kinase activity | 131/3918 | 467/18723 | 1.28e-04 | 1.85e-03 | 131 |
| GO:0045860 | Colorectum | AD | positive regulation of protein kinase activity | 107/3918 | 386/18723 | 8.01e-04 | 7.92e-03 | 107 |
| GO:0071900 | Colorectum | AD | regulation of protein serine/threonine kinase activity | 98/3918 | 359/18723 | 2.18e-03 | 1.73e-02 | 98 |
| GO:0071902 | Colorectum | AD | positive regulation of protein serine/threonine kinase activity | 58/3918 | 200/18723 | 4.09e-03 | 2.84e-02 | 58 |
| GO:00336741 | Colorectum | SER | positive regulation of kinase activity | 95/2897 | 467/18723 | 2.62e-03 | 2.41e-02 | 95 |
| GO:00458601 | Colorectum | SER | positive regulation of protein kinase activity | 79/2897 | 386/18723 | 4.85e-03 | 3.79e-02 | 79 |
| GO:00719001 | Colorectum | SER | regulation of protein serine/threonine kinase activity | 74/2897 | 359/18723 | 5.22e-03 | 3.96e-02 | 74 |
| GO:00336742 | Colorectum | MSS | positive regulation of kinase activity | 122/3467 | 467/18723 | 2.50e-05 | 5.21e-04 | 122 |
| GO:00458602 | Colorectum | MSS | positive regulation of protein kinase activity | 102/3467 | 386/18723 | 6.93e-05 | 1.20e-03 | 102 |
| GO:00719002 | Colorectum | MSS | regulation of protein serine/threonine kinase activity | 93/3467 | 359/18723 | 2.98e-04 | 3.91e-03 | 93 |
| GO:00719021 | Colorectum | MSS | positive regulation of protein serine/threonine kinase activity | 55/3467 | 200/18723 | 1.12e-03 | 1.11e-02 | 55 |
| GO:00336743 | Colorectum | MSI-H | positive regulation of kinase activity | 53/1319 | 467/18723 | 3.99e-04 | 8.98e-03 | 53 |
| GO:00458603 | Colorectum | MSI-H | positive regulation of protein kinase activity | 45/1319 | 386/18723 | 6.03e-04 | 1.19e-02 | 45 |
| GO:00719003 | Colorectum | FAP | regulation of protein serine/threonine kinase activity | 78/2622 | 359/18723 | 3.99e-05 | 8.48e-04 | 78 |
| GO:00458604 | Colorectum | FAP | positive regulation of protein kinase activity | 77/2622 | 386/18723 | 7.31e-04 | 7.81e-03 | 77 |
| GO:00719022 | Colorectum | FAP | positive regulation of protein serine/threonine kinase activity | 45/2622 | 200/18723 | 7.36e-04 | 7.83e-03 | 45 |
| GO:00336744 | Colorectum | FAP | positive regulation of kinase activity | 89/2622 | 467/18723 | 1.33e-03 | 1.22e-02 | 89 |
| GO:003367414 | Endometrium | AEH | positive regulation of kinase activity | 78/2100 | 467/18723 | 2.03e-04 | 2.54e-03 | 78 |
| GO:00458609 | Endometrium | AEH | positive regulation of protein kinase activity | 66/2100 | 386/18723 | 3.14e-04 | 3.53e-03 | 66 |
| GO:00719008 | Endometrium | AEH | regulation of protein serine/threonine kinase activity | 61/2100 | 359/18723 | 6.11e-04 | 5.98e-03 | 61 |
| Hugo Symbol | Variant Class | Variant Classification | dbSNP RS | HGVSc | HGVSp | HGVSp Short | SWISSPROT | BIOTYPE | SIFT | PolyPhen | Tumor Sample Barcode | Tissue | Histology | Sex | Age | Stage | Therapy Types | Drugs | Outcome |
| DAZAP2 | SNV | Missense_Mutation | novel | c.614N>G | p.Val205Gly | p.V205G | Q15038 | protein_coding | deleterious_low_confidence(0) | benign(0.031) | TCGA-A8-A08H-01 | Breast | breast invasive carcinoma | Female | >=65 | I/II | Unknown | Unknown | SD |
| DAZAP2 | insertion | In_Frame_Ins | novel | c.613_614insGCCAGAACCCCA | p.Val205delinsGlyGlnAsnProIle | p.V205delinsGQNPI | Q15038 | protein_coding | | | TCGA-A8-A08H-01 | Breast | breast invasive carcinoma | Female | >=65 | I/II | Unknown | Unknown | SD |
| DAZAP2 | insertion | Nonsense_Mutation | novel | c.602_603insGTAATCCCAGCTACTTGGGAGGCTAAGACAGGAGAATC | p.Met202Ter | p.M202* | Q15038 | protein_coding | | | TCGA-A8-A0A4-01 | Breast | breast invasive carcinoma | Female | >=65 | I/II | Hormone Therapy | tamoxiphen | CR |
| DAZAP2 | SNV | Missense_Mutation | novel | c.483N>G | p.Phe161Leu | p.F161L | Q15038 | protein_coding | deleterious_low_confidence(0) | possibly_damaging(0.627) | TCGA-EA-A97N-01 | Cervix | cervical & endocervical cancer | Female | <65 | I/II | Unknown | Unknown | SD |
| DAZAP2 | SNV | Missense_Mutation | novel | c.299C>T | p.Pro100Leu | p.P100L | Q15038 | protein_coding | deleterious_low_confidence(0) | probably_damaging(0.998) | TCGA-VS-A957-01 | Cervix | cervical & endocervical cancer | Female | <65 | I/II | Chemotherapy | cisplatin | CR |
| DAZAP2 | SNV | Missense_Mutation | novel | c.233N>C | p.Val78Ala | p.V78A | Q15038 | protein_coding | deleterious_low_confidence(0.01) | benign(0.031) | TCGA-AX-A0J1-01 | Endometrium | uterine corpus endometrioid carcinoma | Female | >=65 | I/II | Unknown | Unknown | SD |
| DAZAP2 | SNV | Missense_Mutation | novel | c.299C>T | p.Pro100Leu | p.P100L | Q15038 | protein_coding | deleterious_low_confidence(0) | probably_damaging(0.998) | TCGA-B5-A1MX-01 | Endometrium | uterine corpus endometrioid carcinoma | Female | <65 | I/II | Hormone Therapy | megace | SD |
| DAZAP2 | SNV | Missense_Mutation | novel | c.307A>G | p.Thr103Ala | p.T103A | Q15038 | protein_coding | deleterious_low_confidence(0.03) | benign(0) | TCGA-B5-A1MX-01 | Endometrium | uterine corpus endometrioid carcinoma | Female | <65 | I/II | Hormone Therapy | megace | SD |
| DAZAP2 | SNV | Missense_Mutation | novel | c.190N>A | p.Ala64Thr | p.A64T | Q15038 | protein_coding | tolerated_low_confidence(0.06) | possibly_damaging(0.792) | TCGA-B5-A3FC-01 | Endometrium | uterine corpus endometrioid carcinoma | Female | <65 | I/II | Unknown | Unknown | SD |
| DAZAP2 | SNV | Missense_Mutation | novel | c.223G>A | p.Ala75Thr | p.A75T | Q15038 | protein_coding | tolerated_low_confidence(0.07) | possibly_damaging(0.87) | TCGA-D1-A175-01 | Endometrium | uterine corpus endometrioid carcinoma | Female | <65 | I/II | Chemotherapy | paclitaxel | SD |


