
|
|||||
|
 | |
| |
| |
| |
| |
| |
|
Gene: CNN3 |
Gene summary for CNN3 |
| Gene information | Species | Human | Gene symbol | CNN3 | Gene ID | 1266 |
| Gene name | calponin 3 | |
| Gene Alias | CNN3 | |
| Cytomap | 1p21.3 | |
| Gene Type | protein-coding | GO ID | GO:0006996 | UniProtAcc | Q15417 |
Top |
Malignant transformation analysis |
| Identification of the aberrant gene expression in precancerous and cancerous lesions by comparing the gene expression of stem-like cells in diseased tissues with normal stem cells |
| Entrez ID | Symbol | Replicates | Species | Organ | Tissue | Adj P-value | Log2FC | Malignancy |
| 1266 | CNN3 | HCC1_Meng | Human | Liver | HCC | 4.60e-94 | -3.95e-01 | 0.0246 |
| 1266 | CNN3 | HCC2_Meng | Human | Liver | HCC | 5.99e-35 | -6.05e-01 | 0.0107 |
| 1266 | CNN3 | cirrhotic1 | Human | Liver | Cirrhotic | 8.27e-22 | -1.24e-01 | 0.0202 |
| 1266 | CNN3 | cirrhotic2 | Human | Liver | Cirrhotic | 3.52e-17 | 2.25e-01 | 0.0201 |
| 1266 | CNN3 | cirrhotic3 | Human | Liver | Cirrhotic | 1.32e-20 | 9.55e-03 | 0.0215 |
| 1266 | CNN3 | HCC1 | Human | Liver | HCC | 5.42e-03 | 3.59e+00 | 0.5336 |
| 1266 | CNN3 | HCC2 | Human | Liver | HCC | 3.39e-09 | 2.97e+00 | 0.5341 |
| 1266 | CNN3 | HCC5 | Human | Liver | HCC | 4.17e-07 | 7.75e-01 | 0.4932 |
| 1266 | CNN3 | Pt13.a | Human | Liver | HCC | 1.78e-05 | -3.45e-01 | 0.021 |
| 1266 | CNN3 | Pt13.b | Human | Liver | HCC | 1.10e-25 | 1.90e-01 | 0.0251 |
| 1266 | CNN3 | Pt13.c | Human | Liver | HCC | 1.75e-09 | -5.69e-01 | 0.0076 |
| 1266 | CNN3 | Pt14.a | Human | Liver | HCC | 1.06e-02 | -2.59e-01 | 0.0169 |
| 1266 | CNN3 | Pt14.b | Human | Liver | HCC | 1.45e-10 | 1.74e-01 | 0.018 |
| 1266 | CNN3 | Pt14.d | Human | Liver | HCC | 5.47e-08 | -3.23e-01 | 0.0143 |
| 1266 | CNN3 | S014 | Human | Liver | HCC | 8.46e-10 | 1.04e+00 | 0.2254 |
| 1266 | CNN3 | S015 | Human | Liver | HCC | 2.61e-06 | 8.96e-01 | 0.2375 |
| 1266 | CNN3 | S016 | Human | Liver | HCC | 3.81e-05 | 8.44e-01 | 0.2243 |
| 1266 | CNN3 | S027 | Human | Liver | HCC | 4.47e-03 | 1.16e+00 | 0.2446 |
| 1266 | CNN3 | S028 | Human | Liver | HCC | 1.34e-12 | 1.34e+00 | 0.2503 |
| 1266 | CNN3 | S029 | Human | Liver | HCC | 1.85e-12 | 1.37e+00 | 0.2581 |
| Page: 1 2 3 4 5 6 7 8 9 10 11 |
| Tissue | Expression Dynamics | Abbreviation |
| Breast | 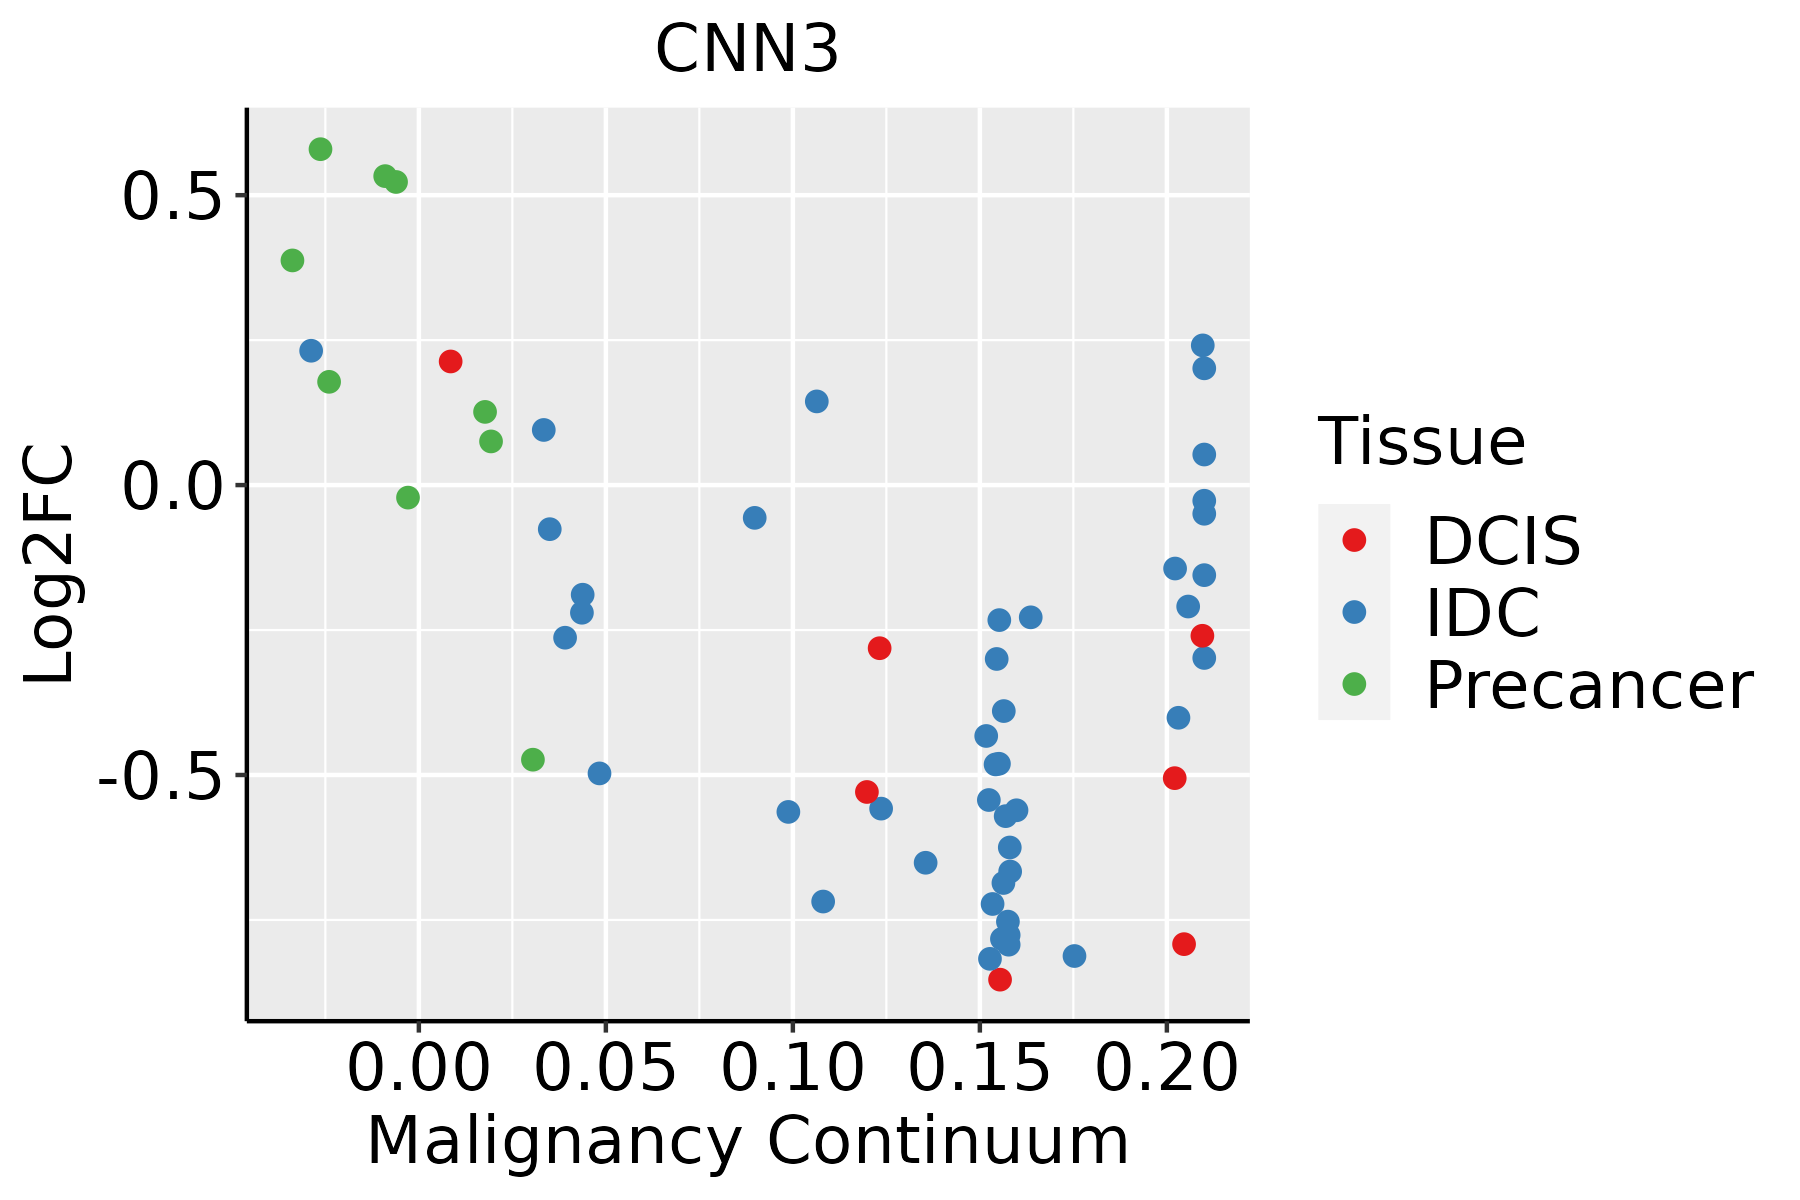 | IDC: Invasive ductal carcinoma |
| DCIS: Ductal carcinoma in situ | ||
| Precancer(BRCA1-mut): Precancerous lesion from BRCA1 mutation carriers | ||
| Colorectum (GSE201348) | 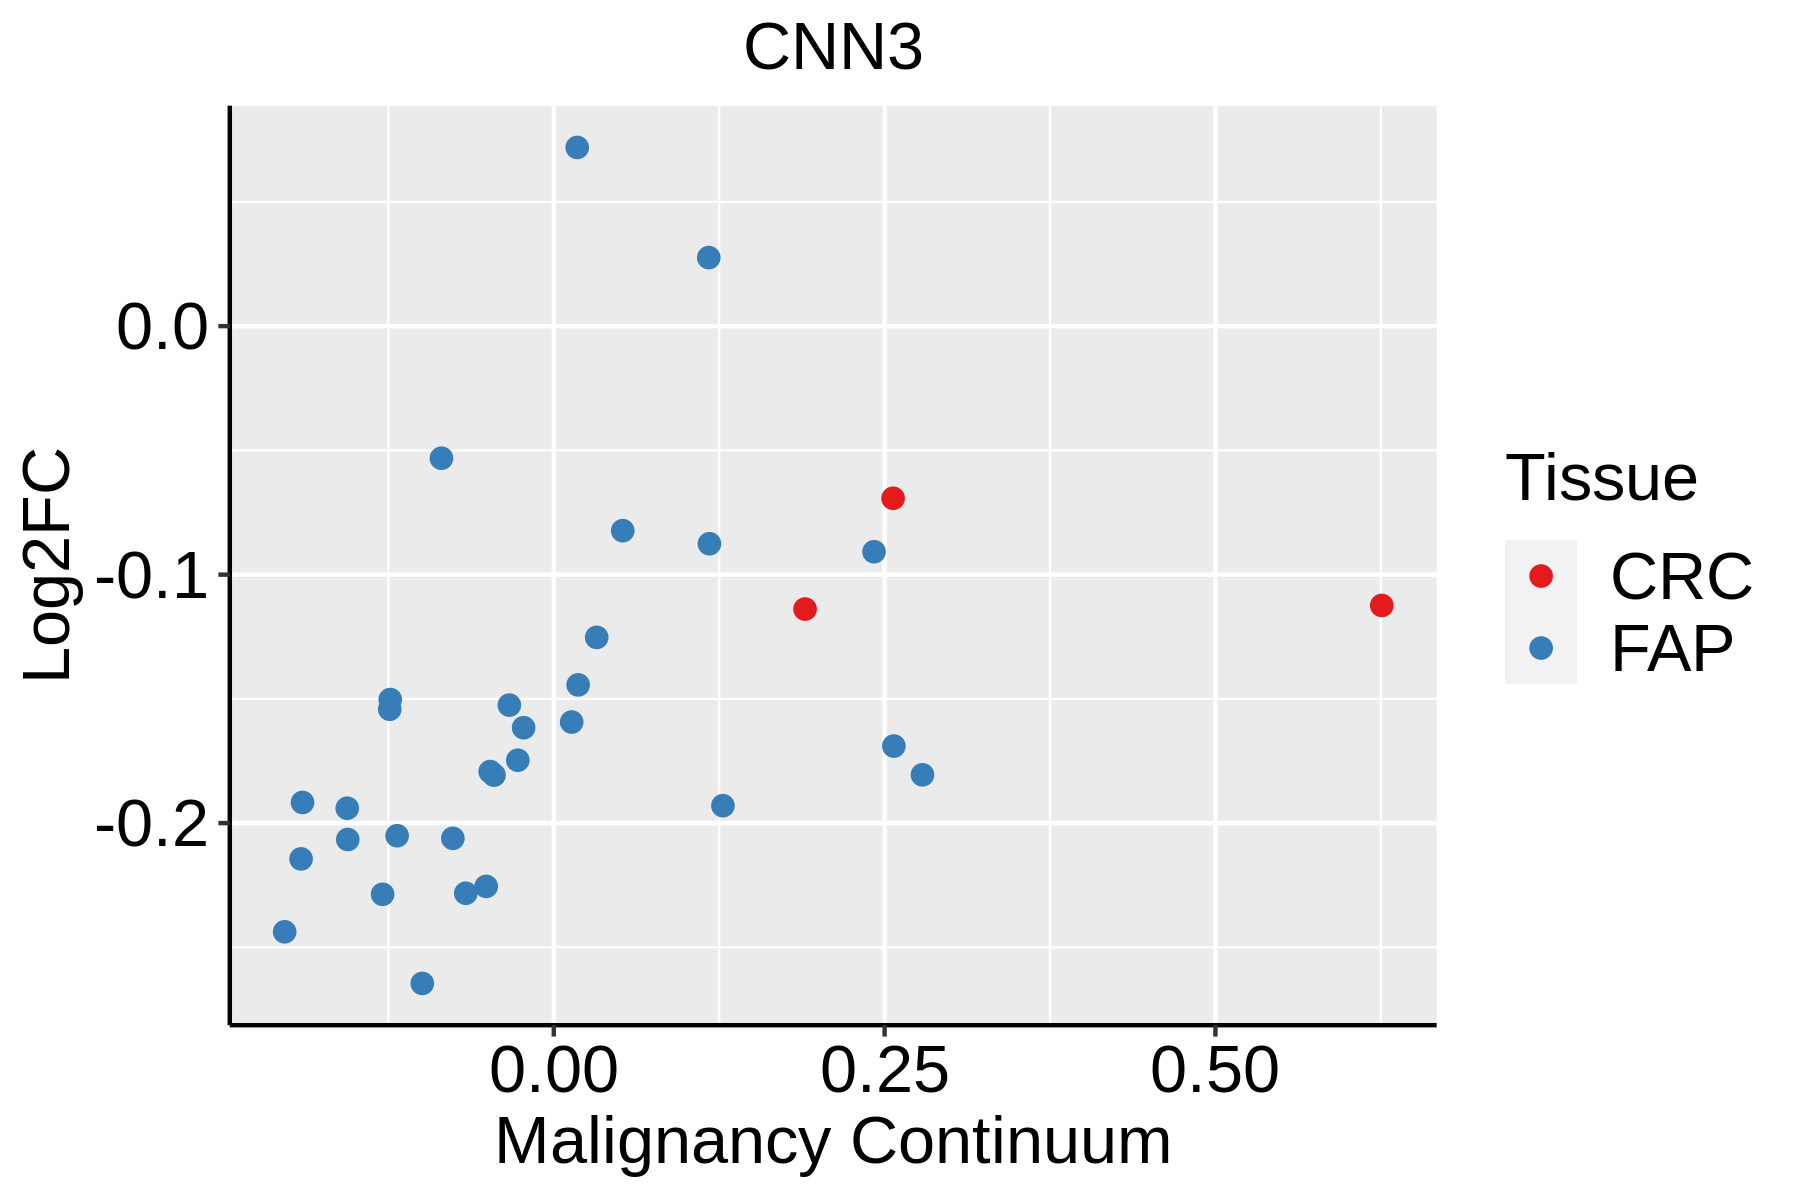 | FAP: Familial adenomatous polyposis |
| CRC: Colorectal cancer | ||
| Colorectum (HTA11) |  | AD: Adenomas |
| SER: Sessile serrated lesions | ||
| MSI-H: Microsatellite-high colorectal cancer | ||
| MSS: Microsatellite stable colorectal cancer | ||
| Endometrium | 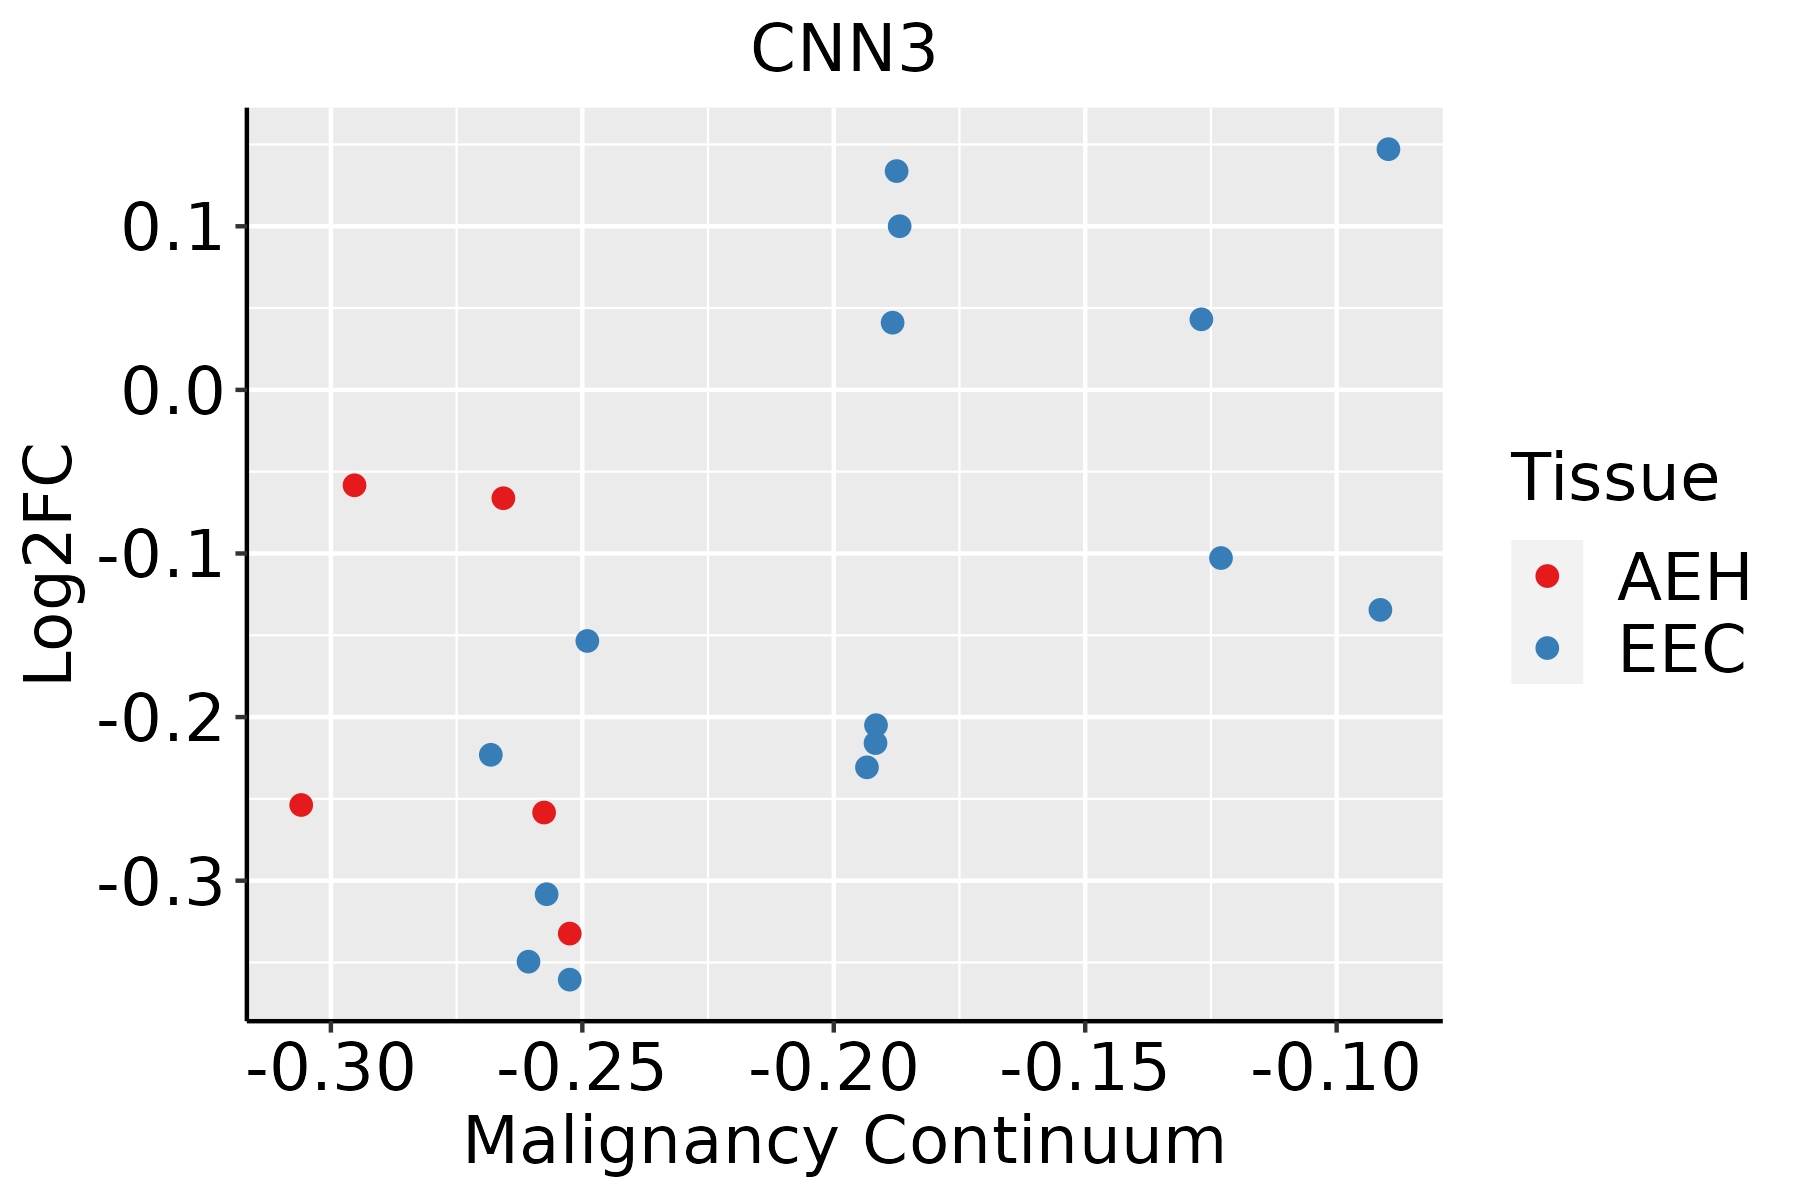 | AEH: Atypical endometrial hyperplasia |
| EEC: Endometrioid Cancer | ||
| Esophagus |  | ESCC: Esophageal squamous cell carcinoma |
| HGIN: High-grade intraepithelial neoplasias | ||
| LGIN: Low-grade intraepithelial neoplasias | ||
| Liver | 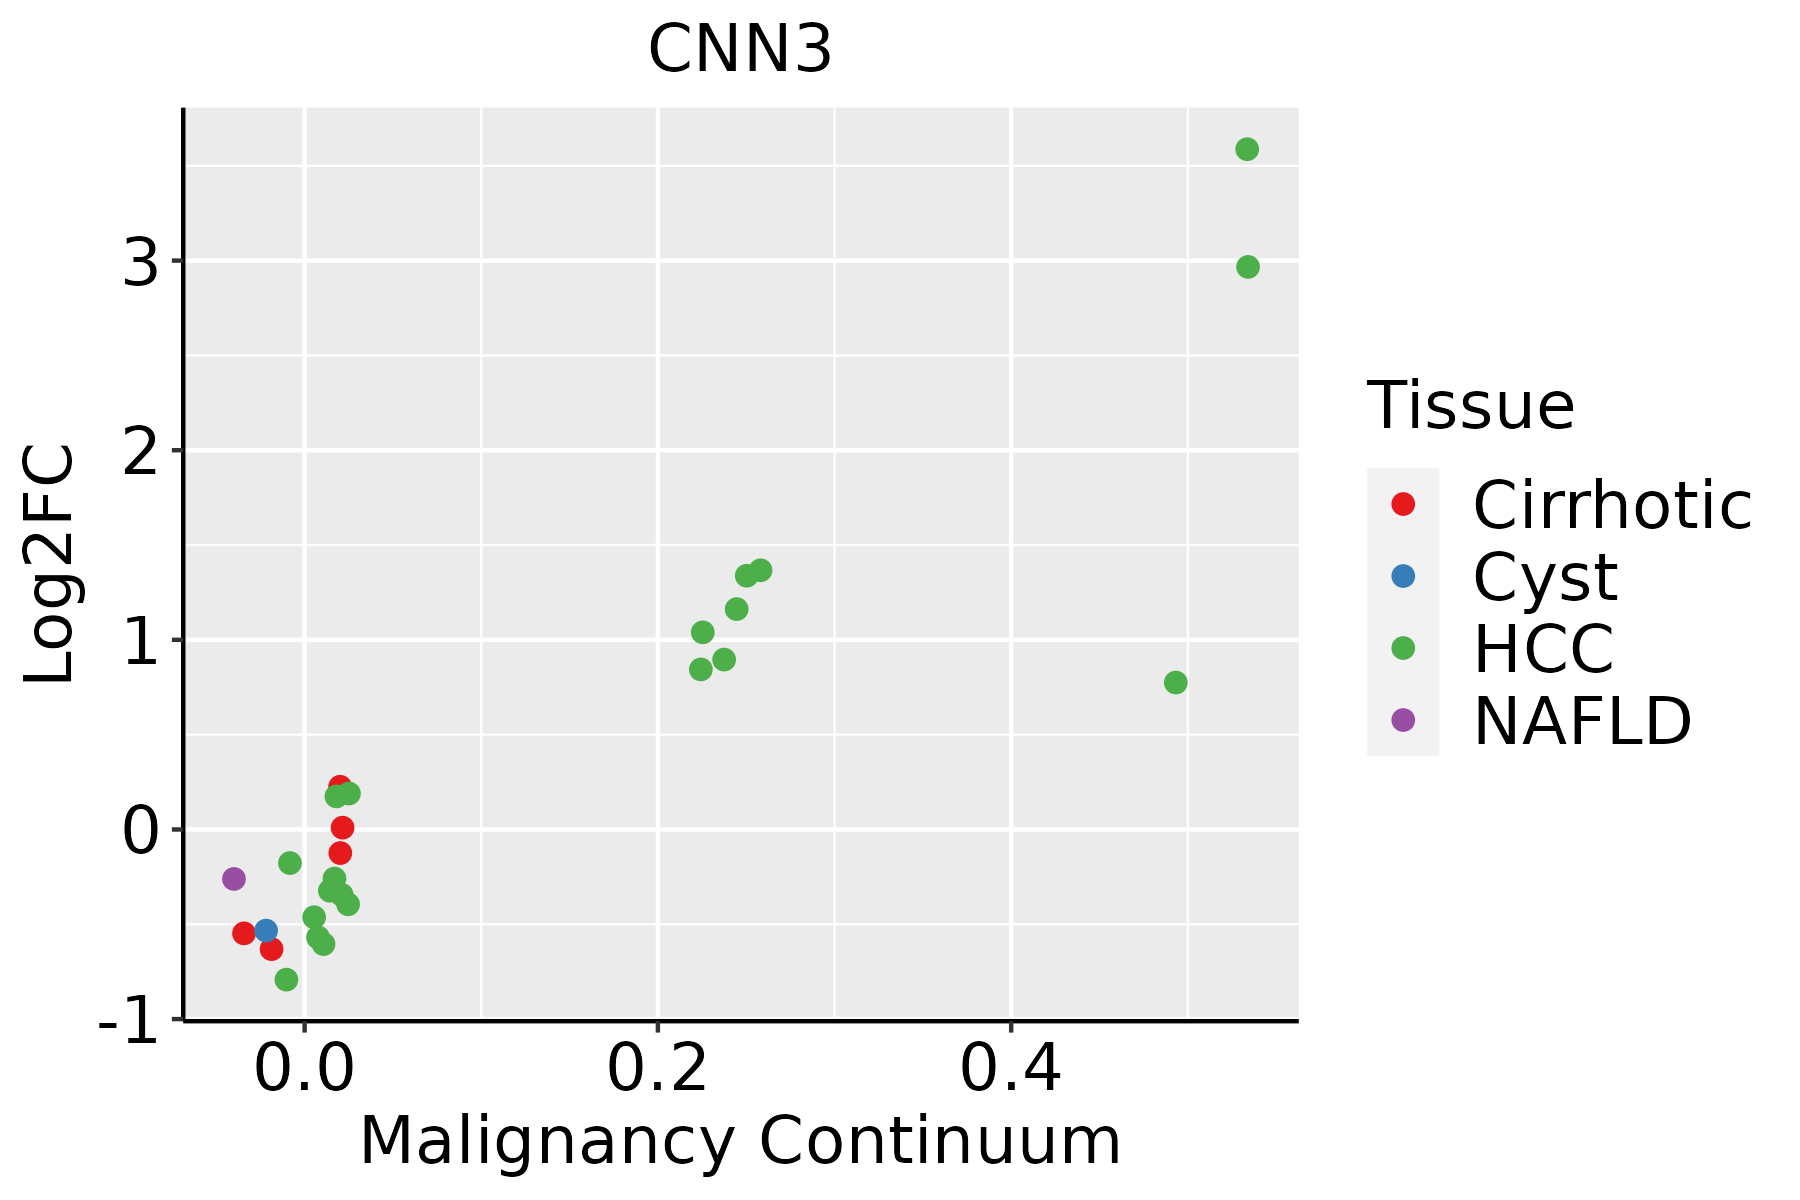 | HCC: Hepatocellular carcinoma |
| NAFLD: Non-alcoholic fatty liver disease | ||
| Oral Cavity | 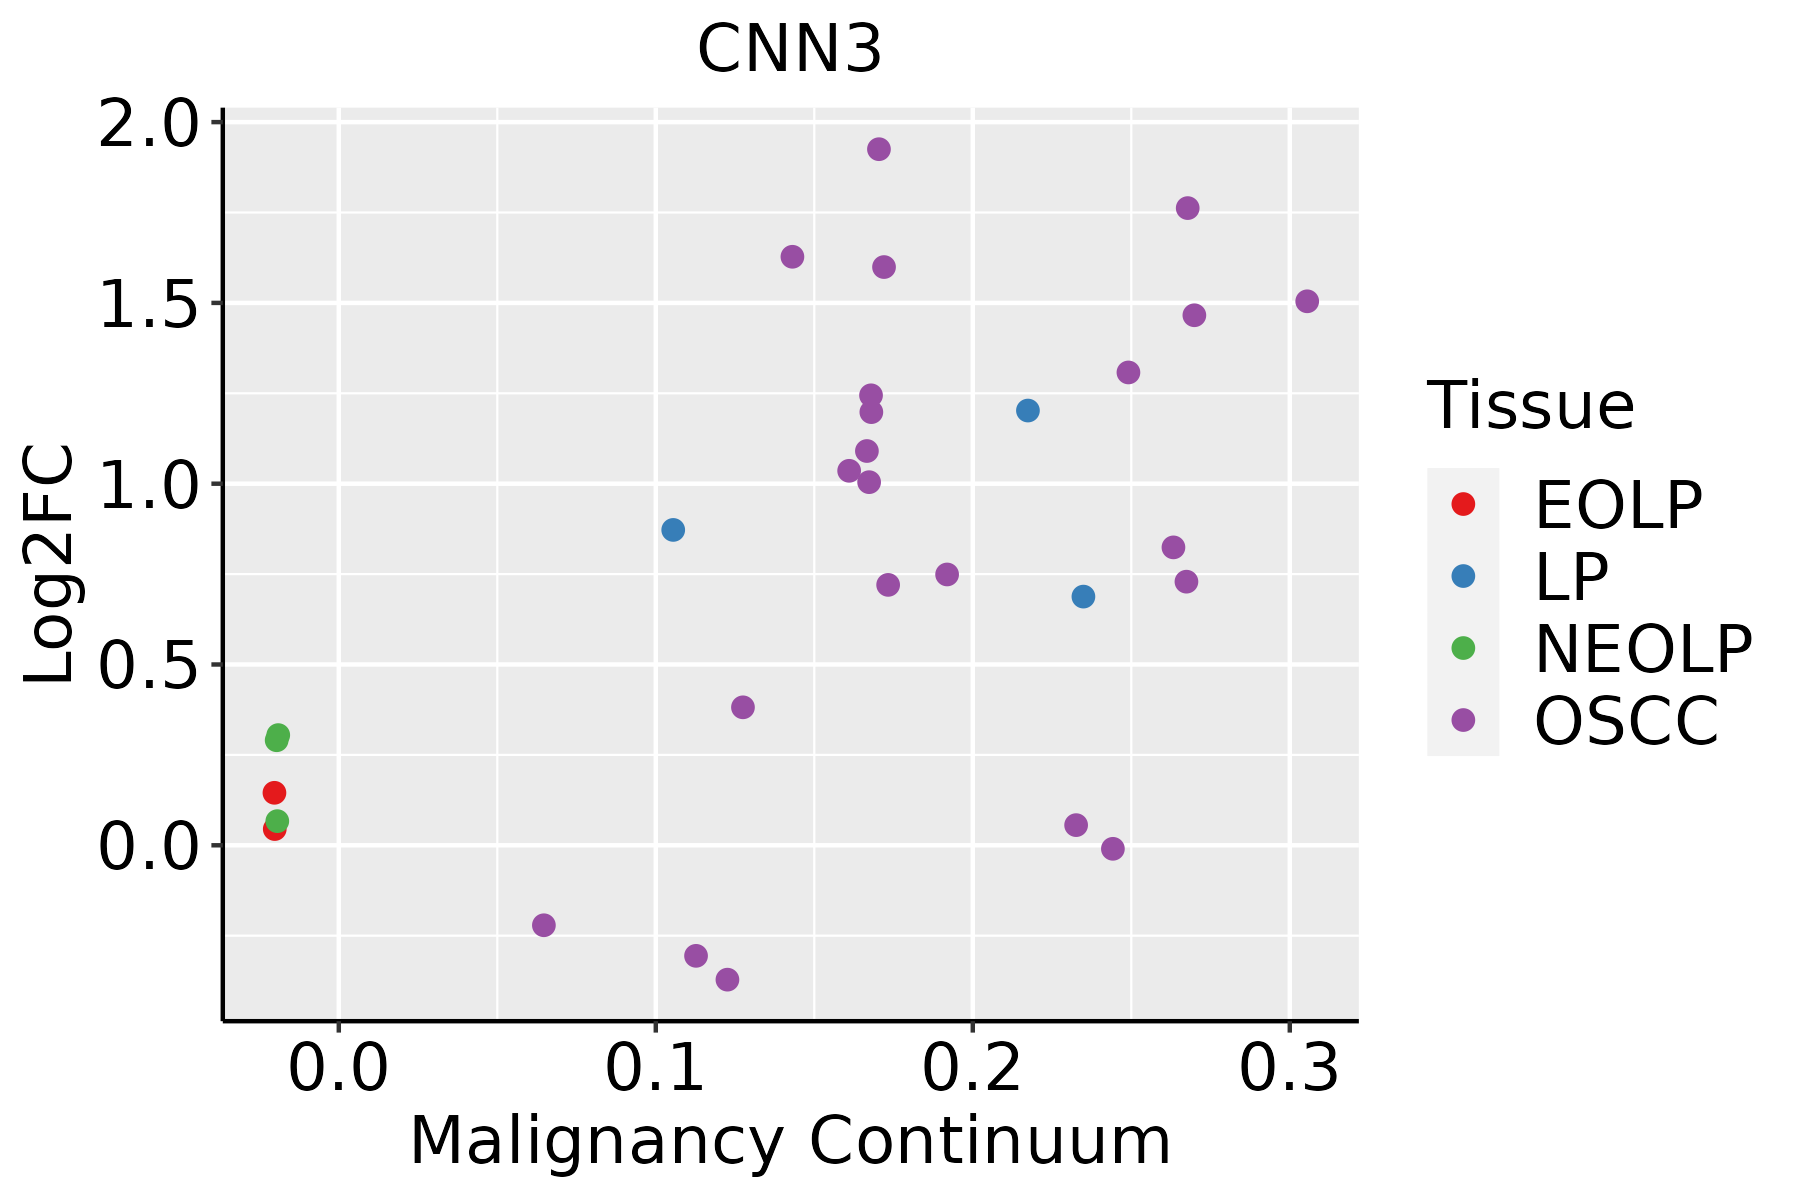 | EOLP: Erosive Oral lichen planus |
| LP: leukoplakia | ||
| NEOLP: Non-erosive oral lichen planus | ||
| OSCC: Oral squamous cell carcinoma | ||
| Prostate |  | BPH: Benign Prostatic Hyperplasia |
| Skin | 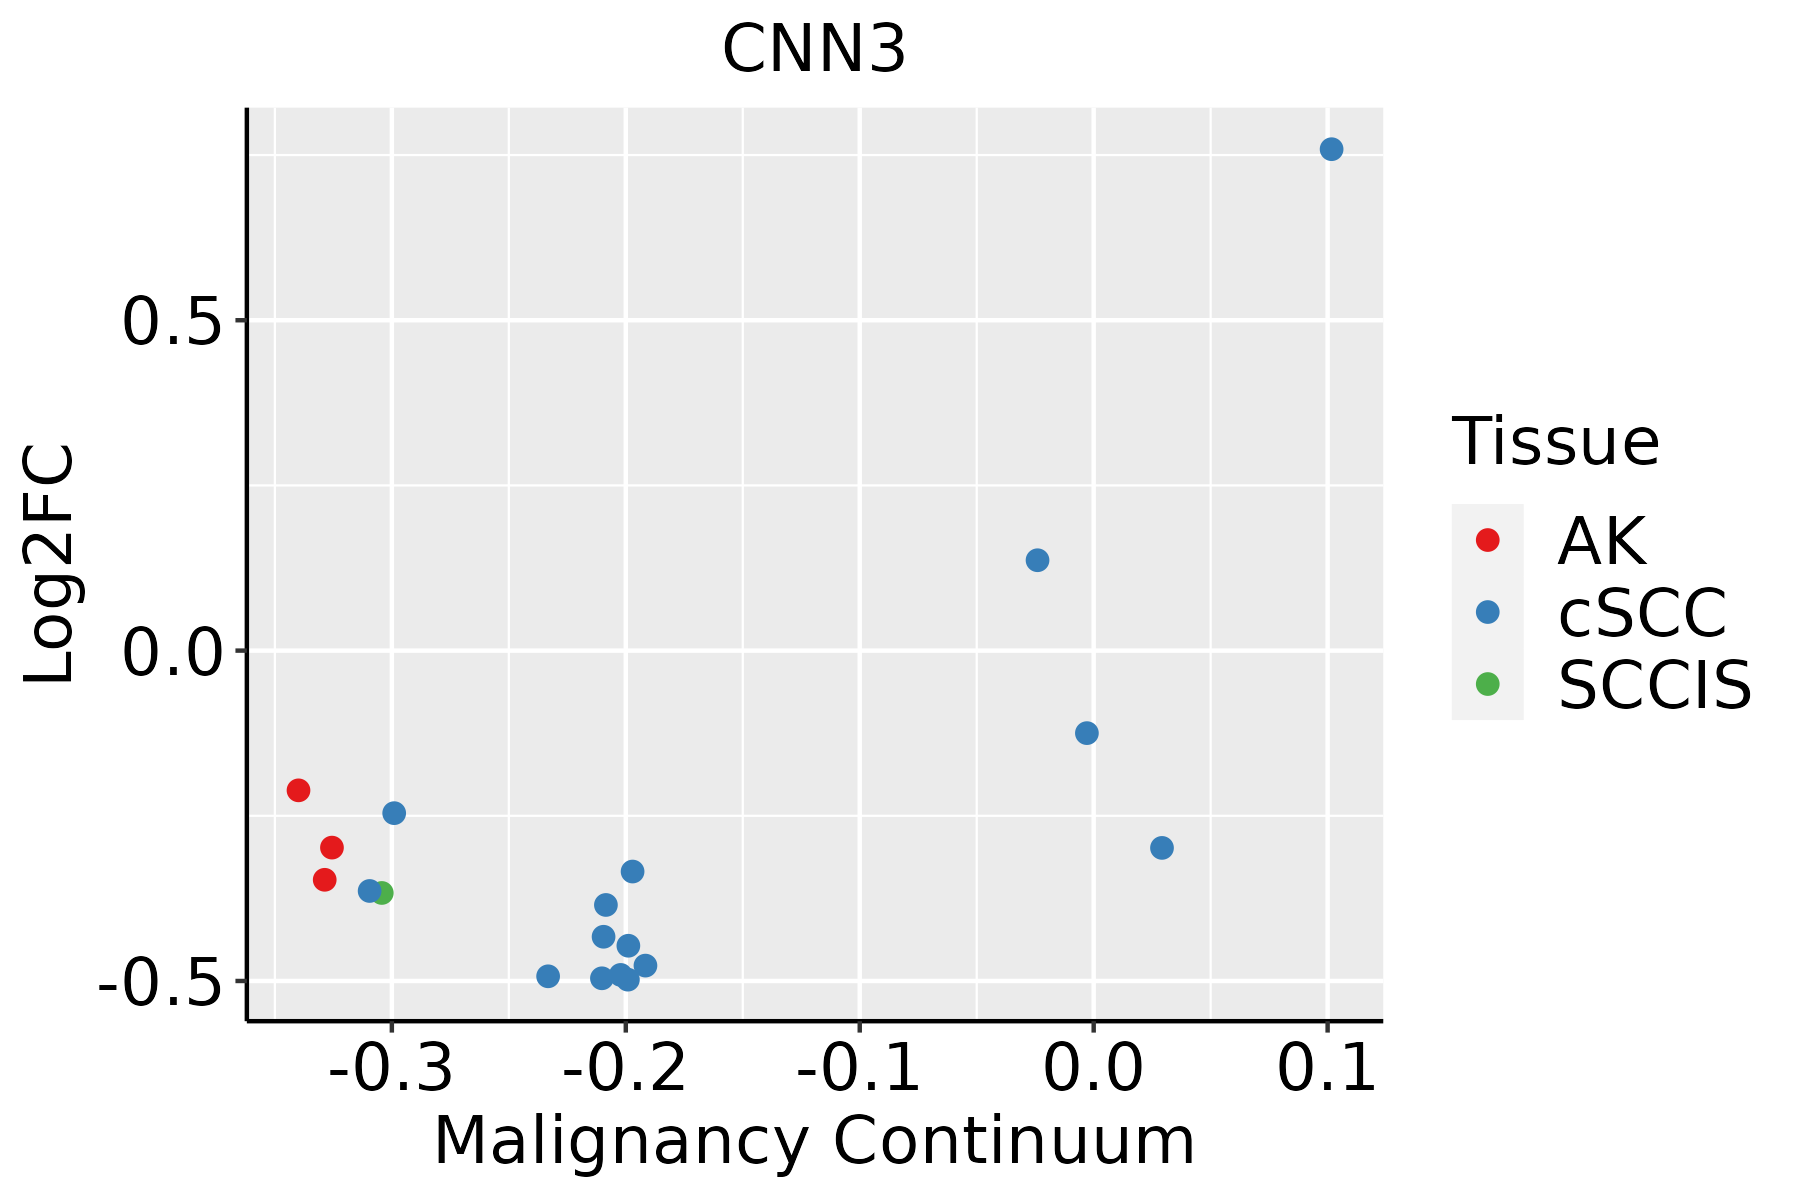 | AK: Actinic keratosis |
| cSCC: Cutaneous squamous cell carcinoma | ||
| SCCIS:squamous cell carcinoma in situ | ||
| Thyroid | 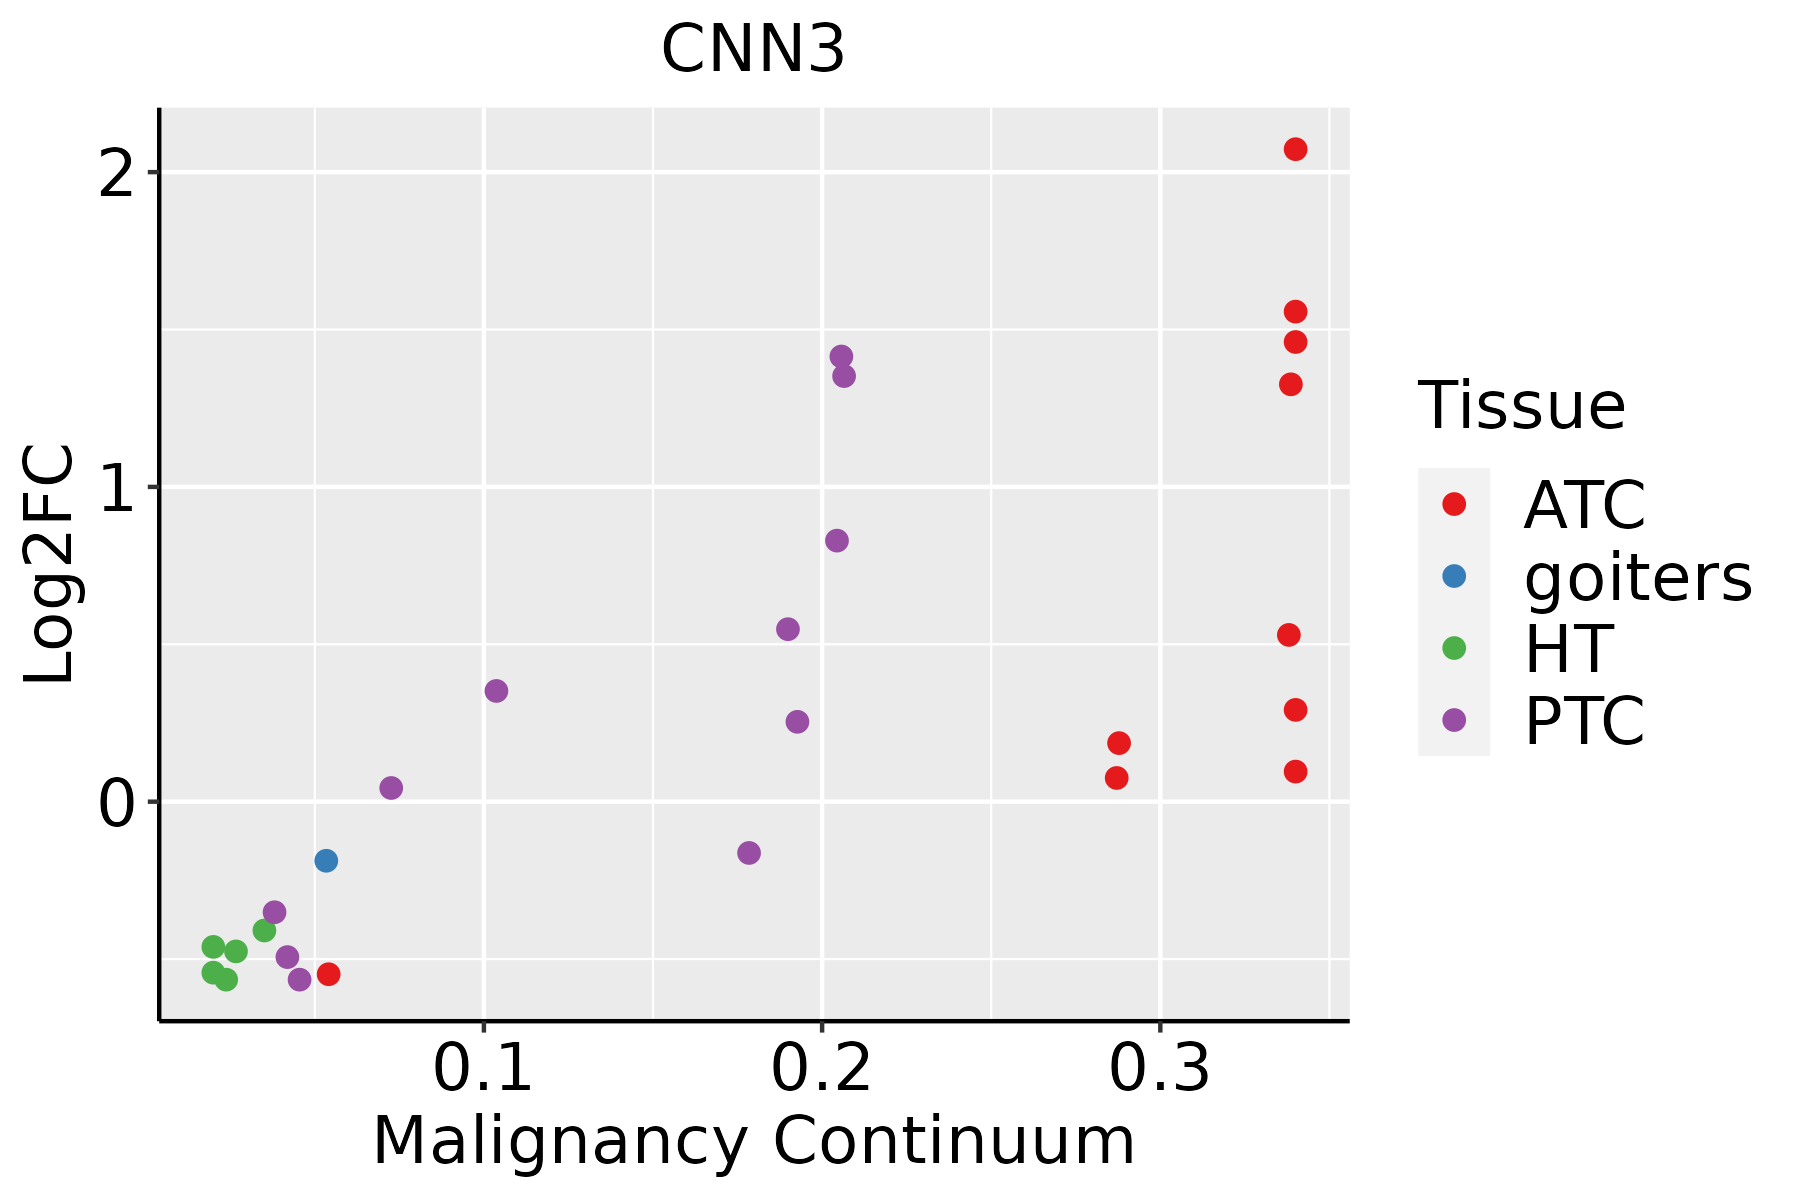 | ATC: Anaplastic thyroid cancer |
| HT: Hashimoto's thyroiditis | ||
| PTC: Papillary thyroid cancer |
| ∗log2FC in expression of this searched gene in stem-like cells from each diseased tissue sample relative to stem-like cells in normal samples in each tissue plotted against the malignancy continuum. Samples are colored based on if they are from different disease stage. |
Top |
Malignant transformation related pathway analysis |
| Find out the enriched GO biological processes and KEGG pathways involved in transition from healthy to precancer to cancer |
| Tissue | Disease Stage | Enriched GO biological Processes |
| Colorectum | AD |  |
| Colorectum | SER |  |
| Colorectum | MSS |  |
| Colorectum | MSI-H |  |
| Colorectum | FAP |  |
| ∗Top 15 enriched GO BP terms are showed in the bar plot of each disease state in each tissue. Each row represents a significant GO biological process which is colored according to the -log10(p.adjust). |
| Page: 1 2 3 4 5 6 7 8 9 |
| GO ID | Tissue | Disease Stage | Description | Gene Ratio | Bg Ratio | pvalue | p.adjust | Count |
| GO:00513468 | Breast | Precancer | negative regulation of hydrolase activity | 50/1080 | 379/18723 | 3.85e-08 | 2.34e-06 | 50 |
| GO:00434624 | Breast | Precancer | regulation of ATPase activity | 10/1080 | 46/18723 | 2.38e-04 | 3.57e-03 | 10 |
| GO:005134613 | Breast | IDC | negative regulation of hydrolase activity | 71/1434 | 379/18723 | 1.33e-12 | 2.90e-10 | 71 |
| GO:004346212 | Breast | IDC | regulation of ATPase activity | 12/1434 | 46/18723 | 1.31e-04 | 2.37e-03 | 12 |
| GO:005134623 | Breast | DCIS | negative regulation of hydrolase activity | 64/1390 | 379/18723 | 4.32e-10 | 4.80e-08 | 64 |
| GO:004346221 | Breast | DCIS | regulation of ATPase activity | 12/1390 | 46/18723 | 9.70e-05 | 1.78e-03 | 12 |
| GO:00310328 | Breast | DCIS | actomyosin structure organization | 25/1390 | 196/18723 | 5.59e-03 | 4.06e-02 | 25 |
| GO:0031032 | Colorectum | AD | actomyosin structure organization | 65/3918 | 196/18723 | 4.17e-05 | 7.37e-04 | 65 |
| GO:0051346 | Colorectum | SER | negative regulation of hydrolase activity | 82/2897 | 379/18723 | 8.19e-04 | 1.01e-02 | 82 |
| GO:00310321 | Colorectum | SER | actomyosin structure organization | 45/2897 | 196/18723 | 3.60e-03 | 3.03e-02 | 45 |
| GO:00310322 | Colorectum | MSS | actomyosin structure organization | 53/3467 | 196/18723 | 2.04e-03 | 1.75e-02 | 53 |
| GO:00513461 | Colorectum | MSS | negative regulation of hydrolase activity | 92/3467 | 379/18723 | 2.85e-03 | 2.22e-02 | 92 |
| GO:00310323 | Colorectum | FAP | actomyosin structure organization | 51/2622 | 196/18723 | 5.89e-06 | 1.88e-04 | 51 |
| GO:003103210 | Endometrium | AEH | actomyosin structure organization | 46/2100 | 196/18723 | 8.00e-07 | 2.91e-05 | 46 |
| GO:005134610 | Endometrium | AEH | negative regulation of hydrolase activity | 65/2100 | 379/18723 | 3.18e-04 | 3.57e-03 | 65 |
| GO:003103214 | Endometrium | EEC | actomyosin structure organization | 46/2168 | 196/18723 | 1.94e-06 | 5.80e-05 | 46 |
| GO:005134615 | Endometrium | EEC | negative regulation of hydrolase activity | 72/2168 | 379/18723 | 1.46e-05 | 2.87e-04 | 72 |
| GO:0051346110 | Esophagus | ESCC | negative regulation of hydrolase activity | 208/8552 | 379/18723 | 1.76e-04 | 1.14e-03 | 208 |
| GO:003103219 | Esophagus | ESCC | actomyosin structure organization | 108/8552 | 196/18723 | 4.86e-03 | 1.88e-02 | 108 |
| GO:00434627 | Esophagus | ESCC | regulation of ATPase activity | 30/8552 | 46/18723 | 5.91e-03 | 2.18e-02 | 30 |
| Page: 1 2 3 |
| Pathway ID | Tissue | Disease Stage | Description | Gene Ratio | Bg Ratio | pvalue | p.adjust | qvalue | Count |
| Page: 1 |
Top |
Cell-cell communication analysis |
| Identification of potential cell-cell interactions between two cell types and their ligand-receptor pairs for different disease states |
| Ligand | Receptor | LRpair | Pathway | Tissue | Disease Stage |
| Page: 1 |
Top |
Single-cell gene regulatory network inference analysis |
| Find out the significant the regulons (TFs) and the target genes of each regulon across cell types for different disease states |
| TF | Cell Type | Tissue | Disease Stage | Target Gene | RSS | Regulon Activity |
| ∗The dot plots of a searched regulon are shown for all cell subpopulations in each disease state of each tissue based on the regulon specific score inferred using pySCENIC and by calculating the average expression. |
| Page: 1 |
Top |
Somatic mutation of malignant transformation related genes |
| Annotation of somatic variants for genes involved in malignant transformation |
| Hugo Symbol | Variant Class | Variant Classification | dbSNP RS | HGVSc | HGVSp | HGVSp Short | SWISSPROT | BIOTYPE | SIFT | PolyPhen | Tumor Sample Barcode | Tissue | Histology | Sex | Age | Stage | Therapy Types | Drugs | Outcome |
| CNN3 | SNV | Missense_Mutation | c.185N>G | p.Ile62Arg | p.I62R | Q15417 | protein_coding | deleterious(0.02) | benign(0.009) | TCGA-B6-A0I2-01 | Breast | breast invasive carcinoma | Female | <65 | I/II | Unknown | Unknown | SD | |
| CNN3 | SNV | Missense_Mutation | c.836C>A | p.Pro279His | p.P279H | Q15417 | protein_coding | deleterious(0) | benign(0.012) | TCGA-BH-A18G-01 | Breast | breast invasive carcinoma | Female | >=65 | I/II | Unknown | Unknown | SD | |
| CNN3 | SNV | Missense_Mutation | c.313G>A | p.Glu105Lys | p.E105K | Q15417 | protein_coding | tolerated(0.12) | probably_damaging(0.983) | TCGA-F5-6814-01 | Colorectum | rectum adenocarcinoma | Male | <65 | I/II | Unknown | Unknown | SD | |
| CNN3 | insertion | Frame_Shift_Ins | novel | c.279_280insT | p.Gln94SerfsTer9 | p.Q94Sfs*9 | Q15417 | protein_coding | TCGA-D5-6928-01 | Colorectum | colon adenocarcinoma | Male | >=65 | I/II | Unknown | Unknown | SD | ||
| CNN3 | SNV | Missense_Mutation | novel | c.848N>G | p.Asn283Ser | p.N283S | Q15417 | protein_coding | deleterious(0.05) | benign(0.039) | TCGA-A5-A0G1-01 | Endometrium | uterine corpus endometrioid carcinoma | Female | >=65 | I/II | Unknown | Unknown | SD |
| CNN3 | SNV | Missense_Mutation | c.774G>A | p.Met258Ile | p.M258I | Q15417 | protein_coding | deleterious(0.01) | benign(0) | TCGA-A5-A1OF-01 | Endometrium | uterine corpus endometrioid carcinoma | Female | <65 | I/II | Unknown | Unknown | SD | |
| CNN3 | SNV | Missense_Mutation | novel | c.572C>T | p.Pro191Leu | p.P191L | Q15417 | protein_coding | deleterious(0.03) | probably_damaging(0.996) | TCGA-B5-A11E-01 | Endometrium | uterine corpus endometrioid carcinoma | Female | <65 | I/II | Unknown | Unknown | SD |
| CNN3 | SNV | Missense_Mutation | c.51N>T | p.Lys17Asn | p.K17N | Q15417 | protein_coding | tolerated(0.12) | benign(0) | TCGA-B5-A11N-01 | Endometrium | uterine corpus endometrioid carcinoma | Female | >=65 | I/II | Unknown | Unknown | SD | |
| CNN3 | SNV | Missense_Mutation | novel | c.262N>G | p.Asn88Asp | p.N88D | Q15417 | protein_coding | deleterious(0.02) | probably_damaging(0.987) | TCGA-BG-A222-01 | Endometrium | uterine corpus endometrioid carcinoma | Female | <65 | I/II | Unknown | Unknown | SD |
| CNN3 | SNV | Missense_Mutation | rs749615050 | c.98N>A | p.Arg33His | p.R33H | Q15417 | protein_coding | tolerated(0.07) | probably_damaging(0.992) | TCGA-BS-A0UV-01 | Endometrium | uterine corpus endometrioid carcinoma | Female | <65 | III/IV | Unknown | Unknown | SD |
| Page: 1 2 3 |
Top |
Related drugs of malignant transformation related genes |
| Identification of chemicals and drugs interact with genes involved in malignant transfromation |
| (DGIdb 4.0) |
| Entrez ID | Symbol | Category | Interaction Types | Drug Claim Name | Drug Name | PMIDs |
| Page: 1 |

Copyright 2023-Present -The University of Texas Health Science Center at Houston |