
|
|||||
|
 | |
| |
| |
| |
| |
| |
|
Gene: CMSS1 |
Gene summary for CMSS1 |
| Gene information | Species | Human | Gene symbol | CMSS1 | Gene ID | 84319 |
| Gene name | cms1 ribosomal small subunit homolog | |
| Gene Alias | C3orf26 | |
| Cytomap | 3q12.1 | |
| Gene Type | protein-coding | GO ID | GO:0003674 | UniProtAcc | Q9BQ75 |
Top |
Malignant transformation analysis |
| Identification of the aberrant gene expression in precancerous and cancerous lesions by comparing the gene expression of stem-like cells in diseased tissues with normal stem cells |
| Entrez ID | Symbol | Replicates | Species | Organ | Tissue | Adj P-value | Log2FC | Malignancy |
| 84319 | CMSS1 | Pt13.b | Human | Liver | HCC | 7.58e-10 | 8.12e-02 | 0.0251 |
| 84319 | CMSS1 | Pt14.a | Human | Liver | HCC | 3.17e-06 | 4.60e-01 | 0.0169 |
| 84319 | CMSS1 | Pt14.b | Human | Liver | HCC | 4.15e-02 | 1.38e-01 | 0.018 |
| 84319 | CMSS1 | S014 | Human | Liver | HCC | 4.24e-05 | 5.05e-01 | 0.2254 |
| 84319 | CMSS1 | S015 | Human | Liver | HCC | 7.96e-12 | 1.10e+00 | 0.2375 |
| 84319 | CMSS1 | S016 | Human | Liver | HCC | 1.49e-13 | 8.71e-01 | 0.2243 |
| 84319 | CMSS1 | S027 | Human | Liver | HCC | 2.72e-08 | 8.57e-01 | 0.2446 |
| 84319 | CMSS1 | S028 | Human | Liver | HCC | 1.64e-11 | 9.63e-01 | 0.2503 |
| 84319 | CMSS1 | S029 | Human | Liver | HCC | 2.62e-03 | 6.02e-01 | 0.2581 |
| 84319 | CMSS1 | C04 | Human | Oral cavity | OSCC | 4.90e-22 | 1.55e+00 | 0.2633 |
| 84319 | CMSS1 | C21 | Human | Oral cavity | OSCC | 3.21e-17 | 1.12e+00 | 0.2678 |
| 84319 | CMSS1 | C30 | Human | Oral cavity | OSCC | 1.99e-23 | 1.62e+00 | 0.3055 |
| 84319 | CMSS1 | C38 | Human | Oral cavity | OSCC | 2.75e-05 | 8.12e-01 | 0.172 |
| 84319 | CMSS1 | C43 | Human | Oral cavity | OSCC | 4.54e-16 | -7.68e-02 | 0.1704 |
| 84319 | CMSS1 | C46 | Human | Oral cavity | OSCC | 3.41e-05 | 6.63e-02 | 0.1673 |
| 84319 | CMSS1 | C51 | Human | Oral cavity | OSCC | 1.62e-03 | 6.33e-01 | 0.2674 |
| 84319 | CMSS1 | C06 | Human | Oral cavity | OSCC | 1.46e-05 | 1.51e+00 | 0.2699 |
| 84319 | CMSS1 | C08 | Human | Oral cavity | OSCC | 2.21e-22 | 8.04e-01 | 0.1919 |
| 84319 | CMSS1 | C09 | Human | Oral cavity | OSCC | 2.46e-06 | -6.92e-02 | 0.1431 |
| 84319 | CMSS1 | LP17 | Human | Oral cavity | LP | 2.18e-03 | 1.21e+00 | 0.2349 |
| Page: 1 2 3 4 5 6 7 8 9 10 |
| Tissue | Expression Dynamics | Abbreviation |
| Colorectum (GSE201348) | 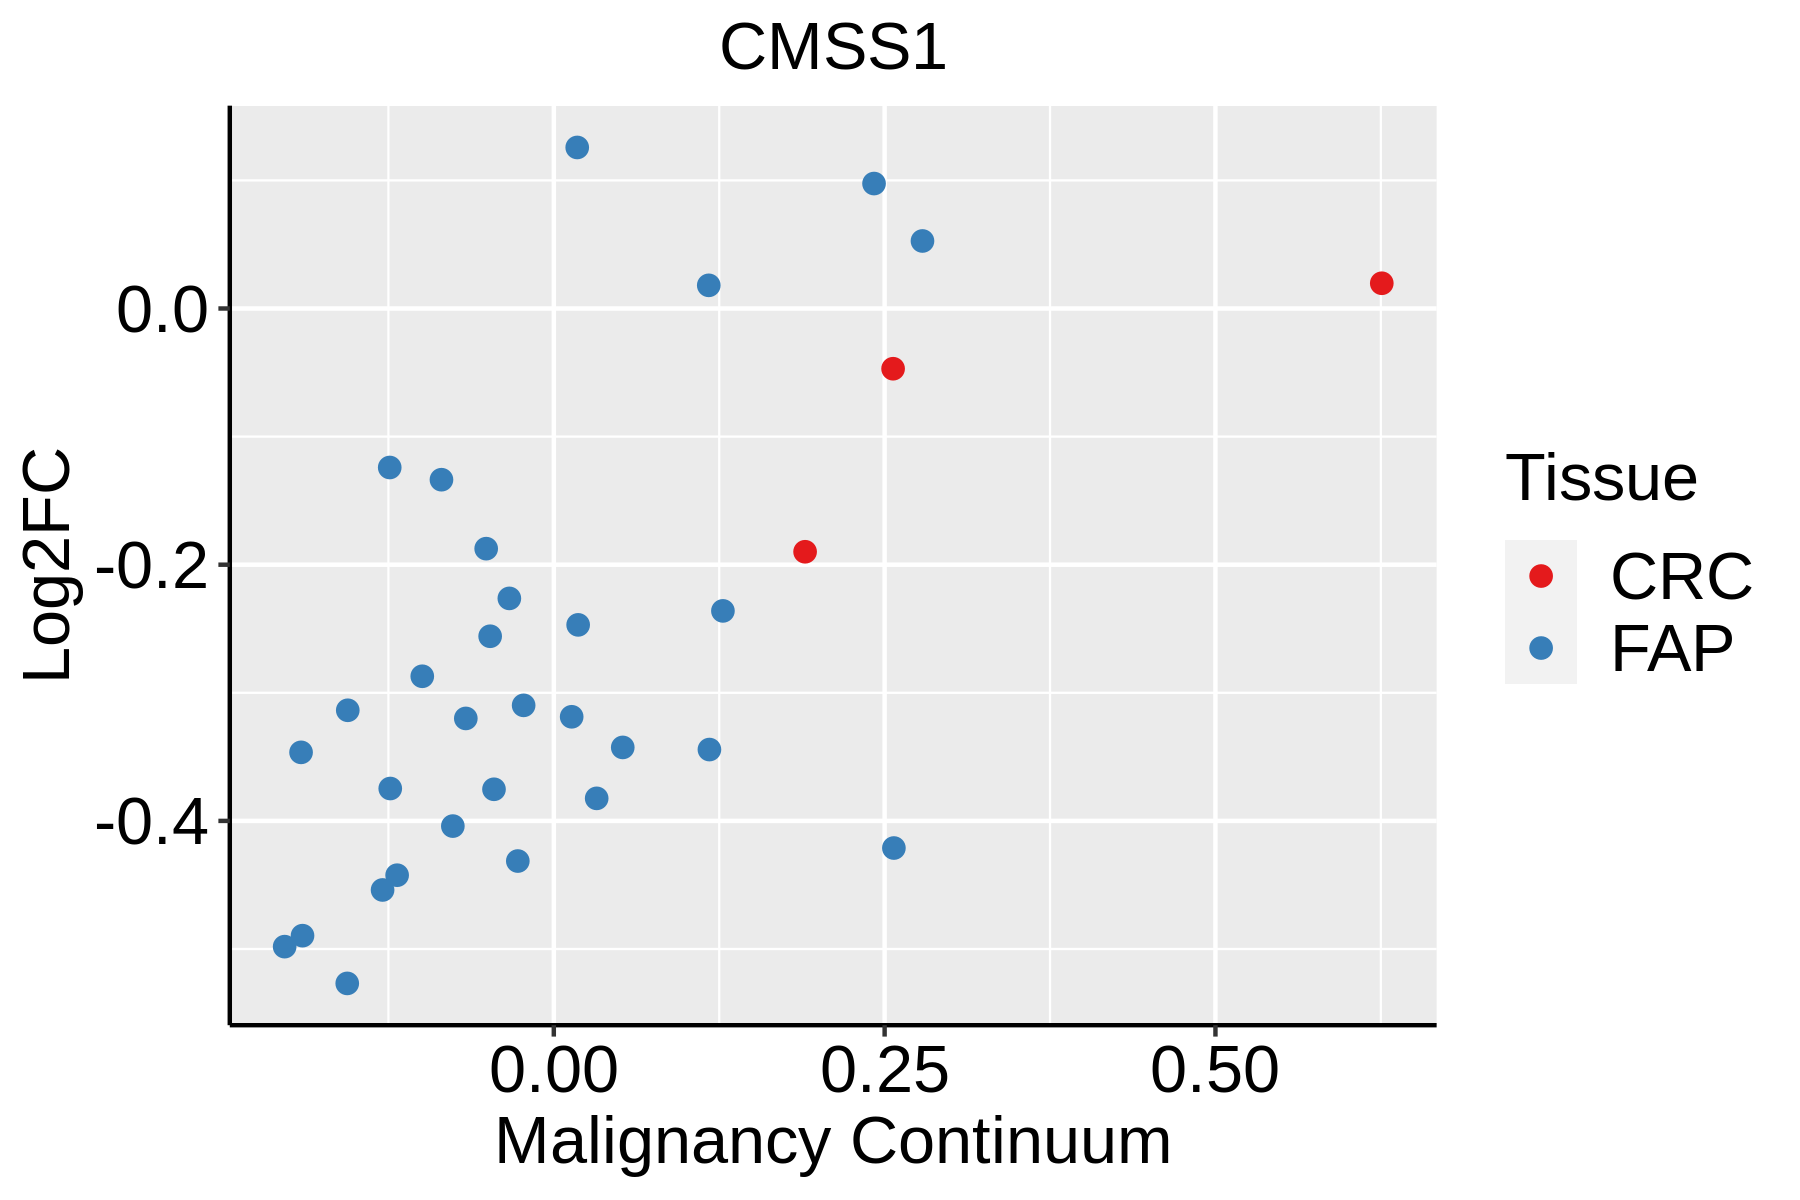 | FAP: Familial adenomatous polyposis |
| CRC: Colorectal cancer | ||
| Colorectum (HTA11) | 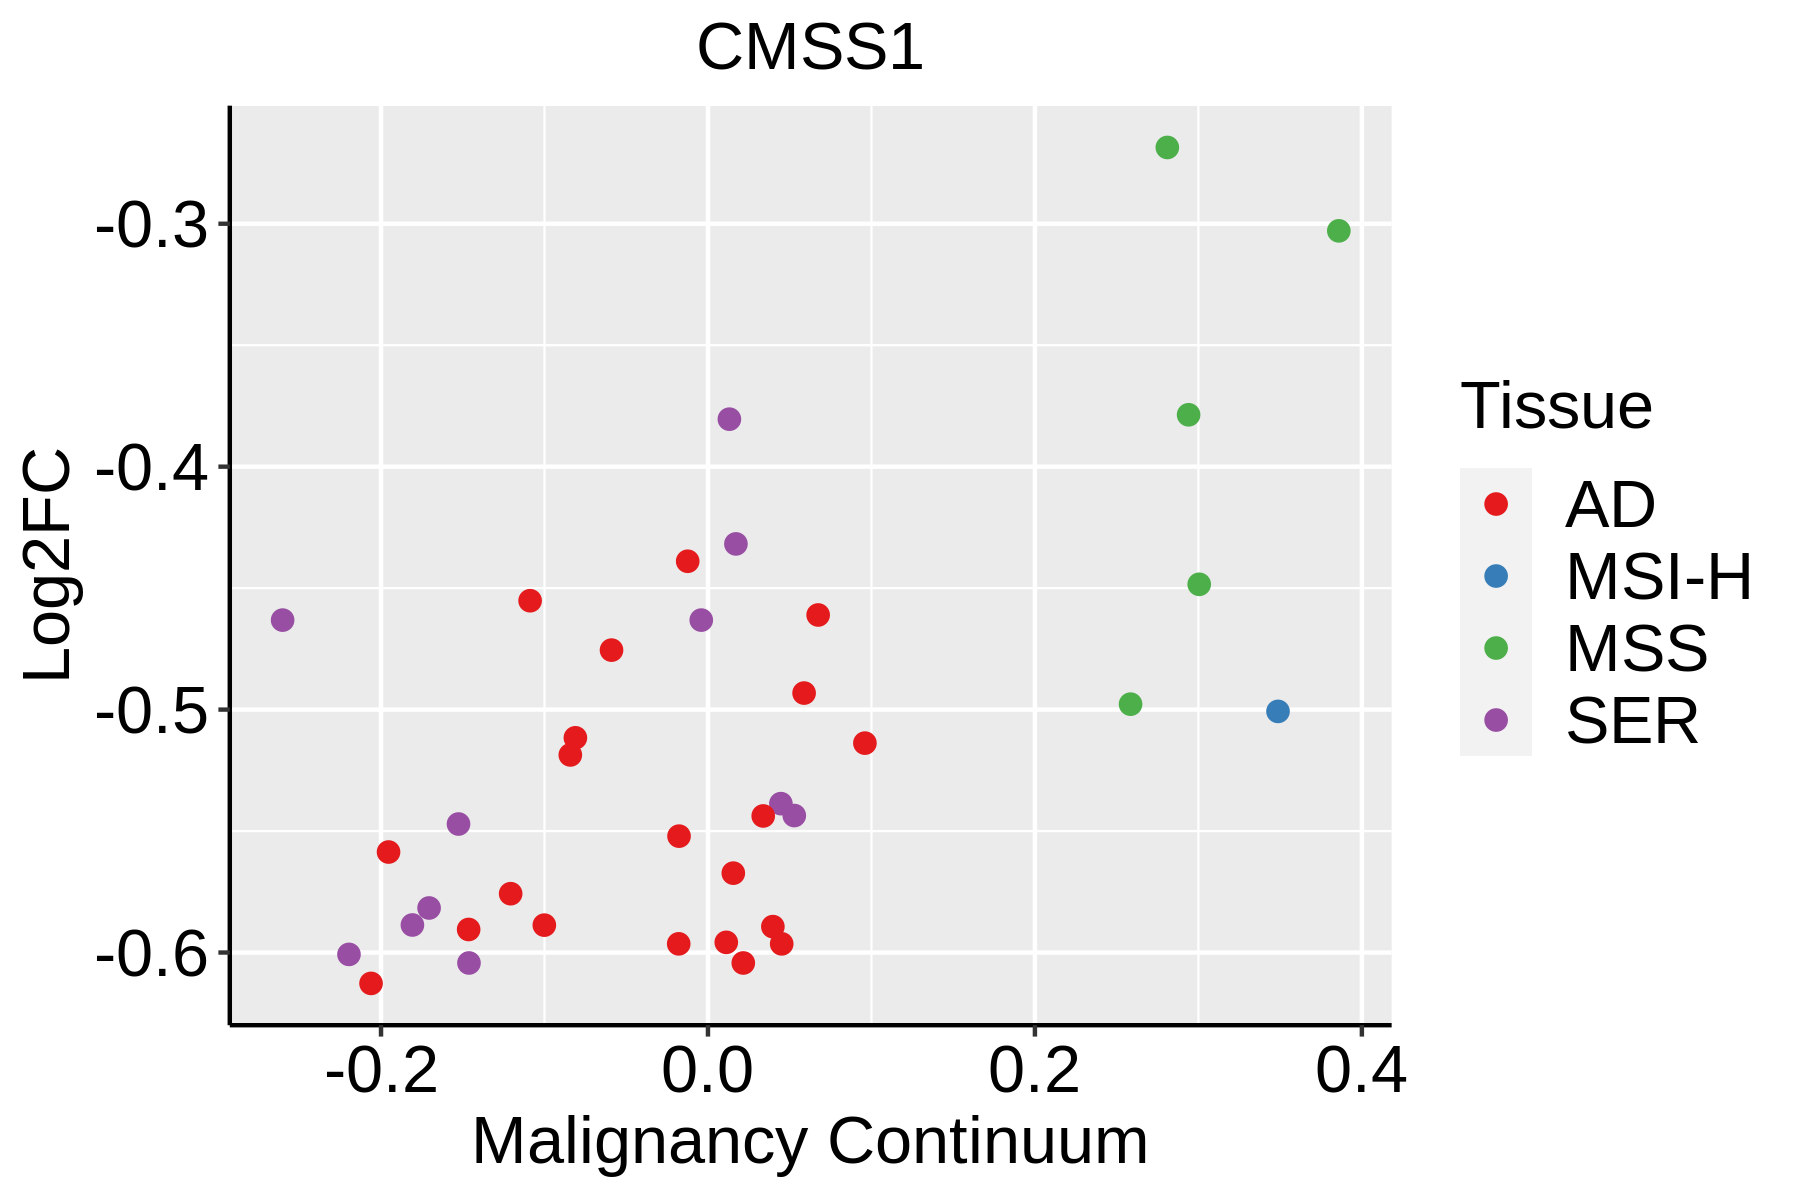 | AD: Adenomas |
| SER: Sessile serrated lesions | ||
| MSI-H: Microsatellite-high colorectal cancer | ||
| MSS: Microsatellite stable colorectal cancer | ||
| Endometrium | 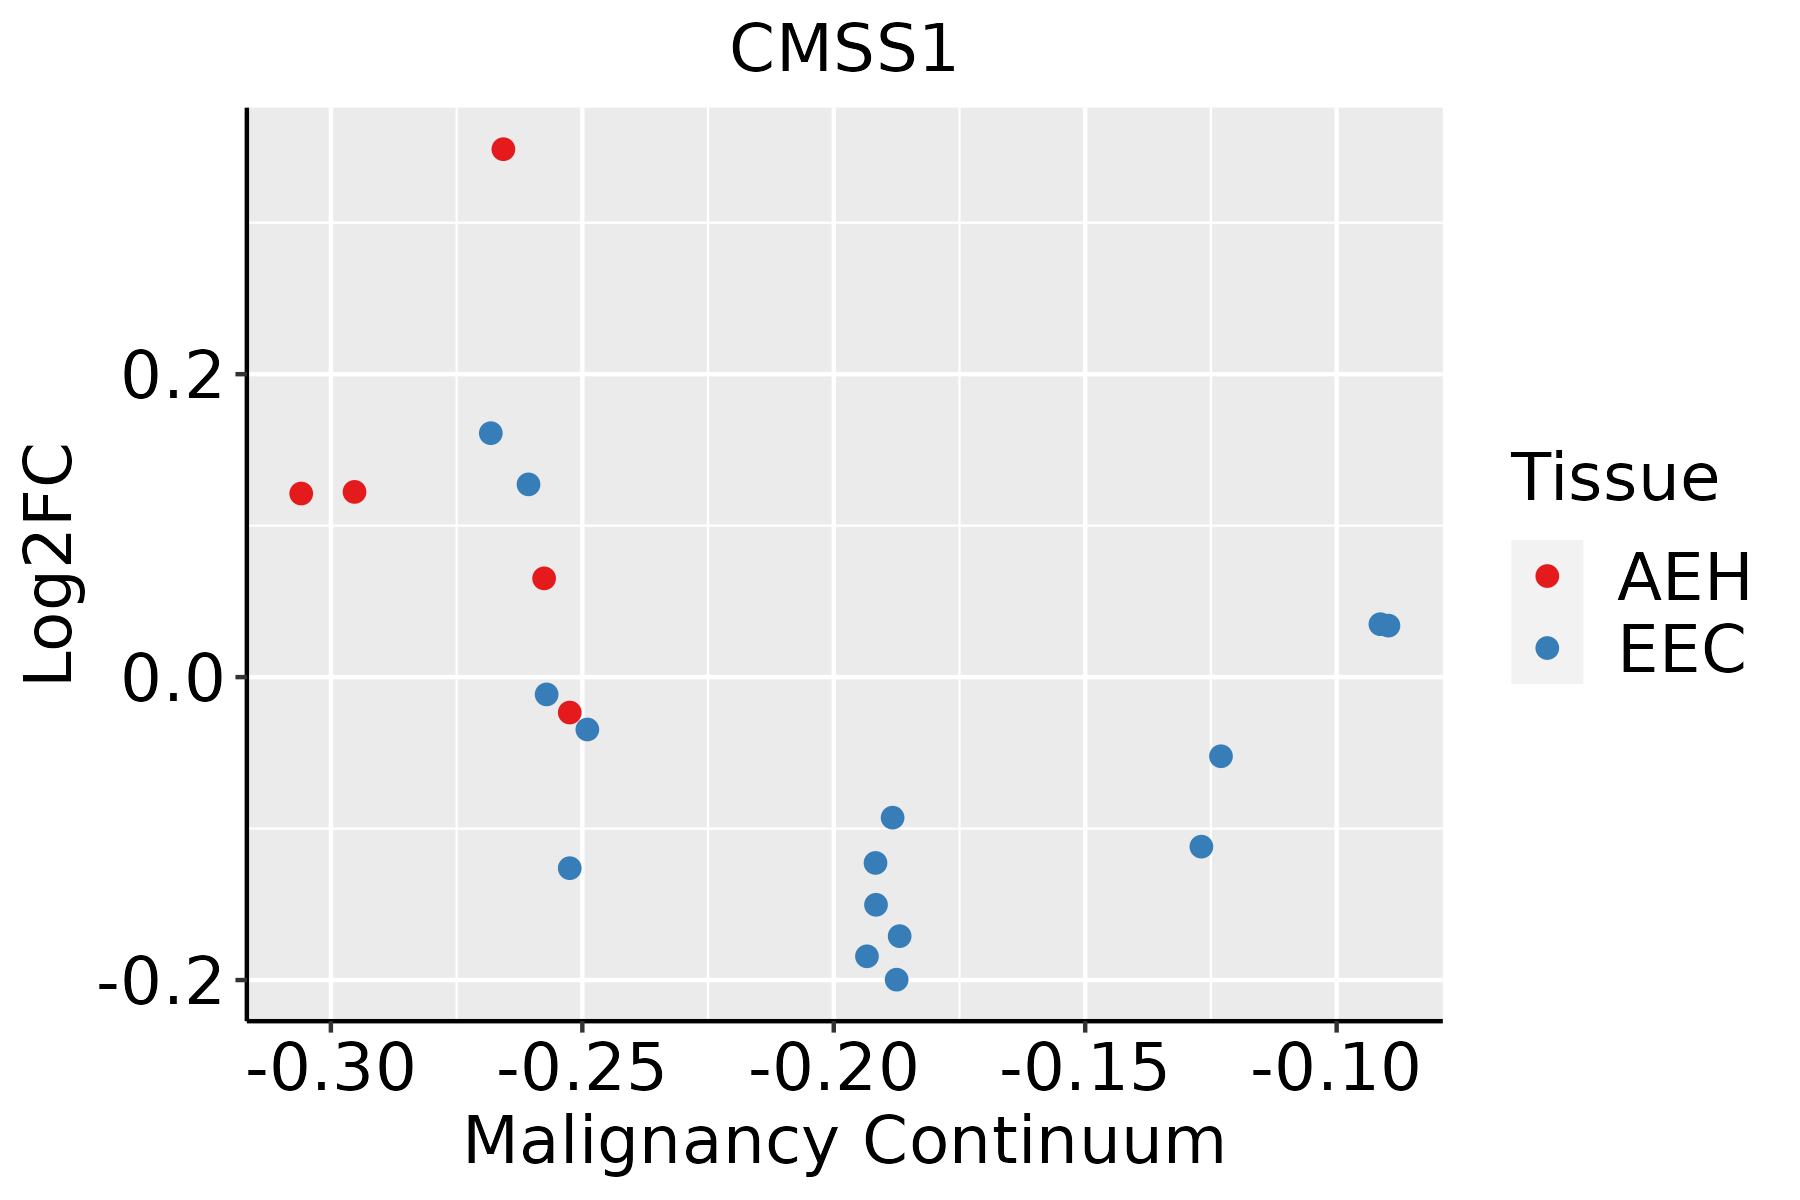 | AEH: Atypical endometrial hyperplasia |
| EEC: Endometrioid Cancer | ||
| Esophagus | 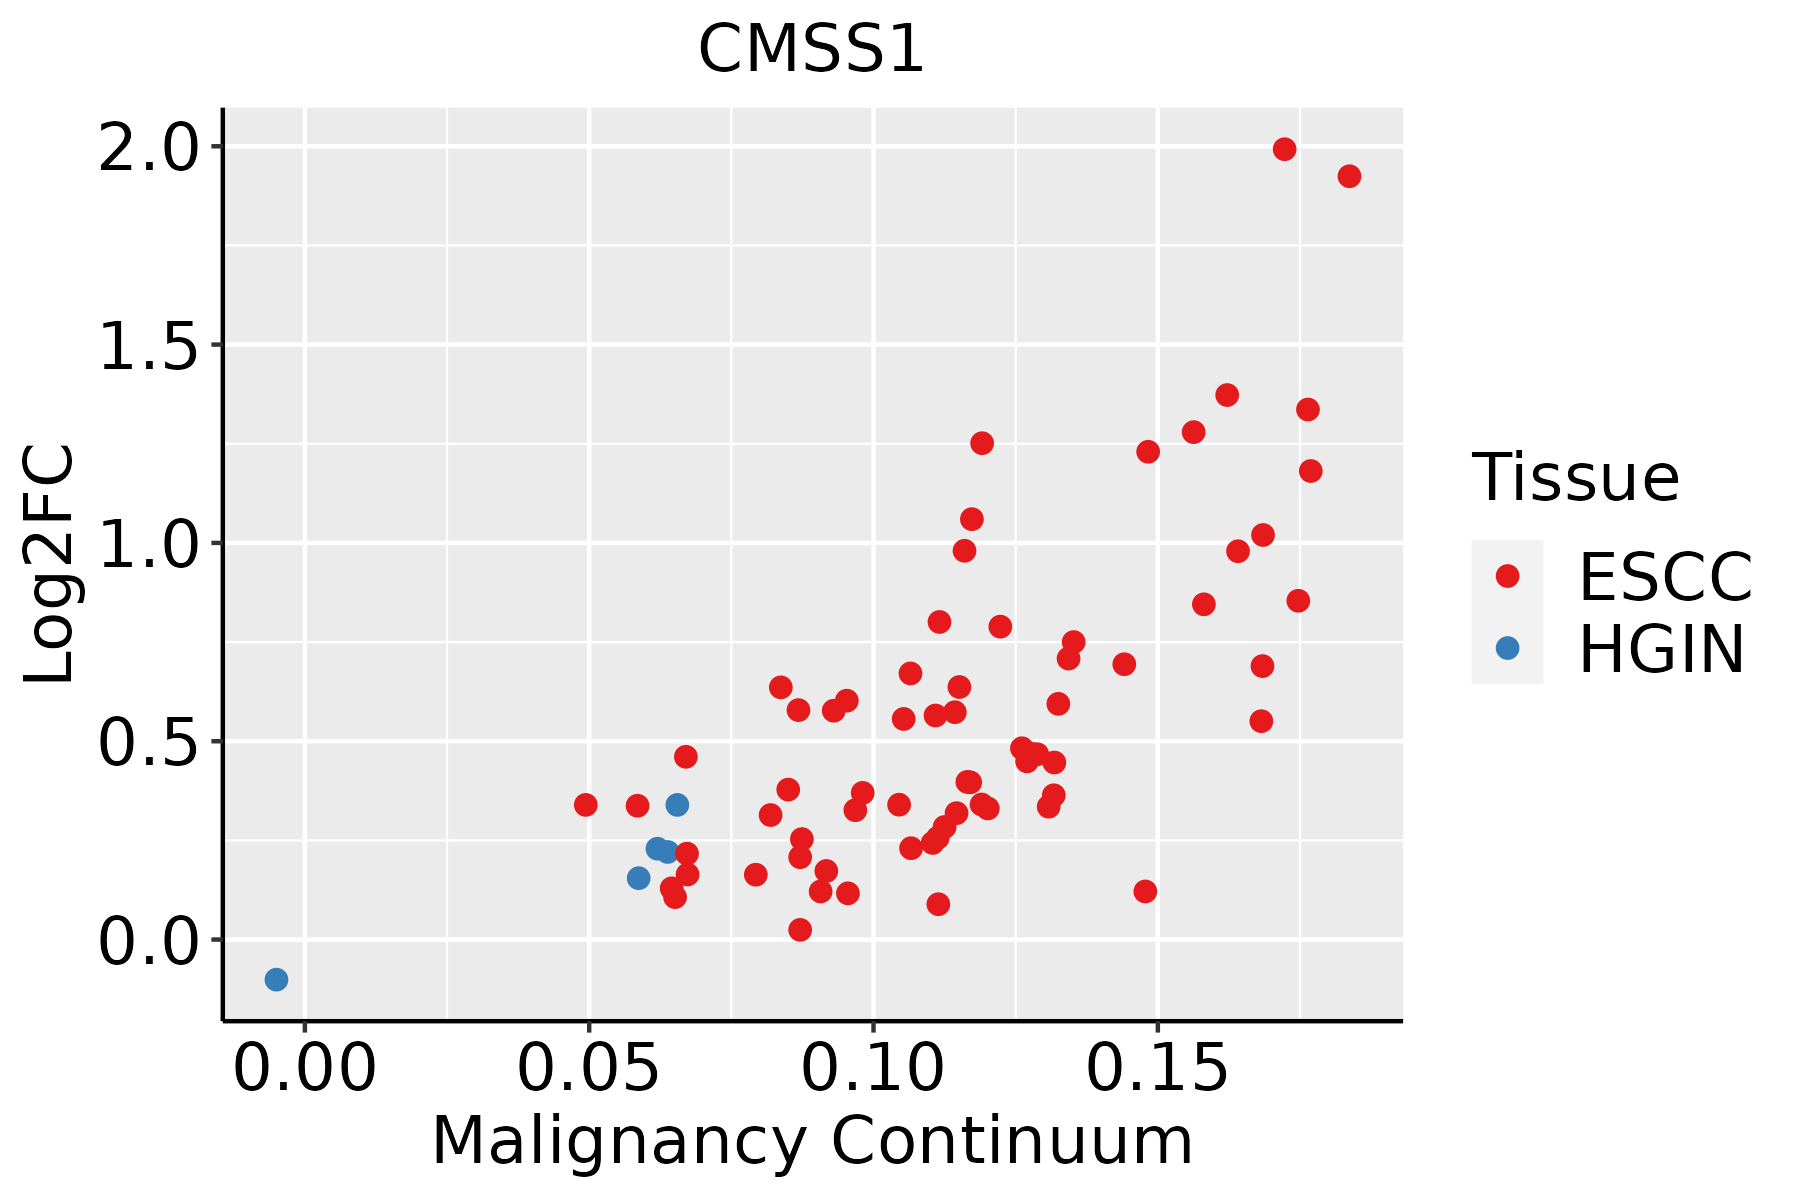 | ESCC: Esophageal squamous cell carcinoma |
| HGIN: High-grade intraepithelial neoplasias | ||
| LGIN: Low-grade intraepithelial neoplasias | ||
| Liver |  | HCC: Hepatocellular carcinoma |
| NAFLD: Non-alcoholic fatty liver disease | ||
| Oral Cavity |  | EOLP: Erosive Oral lichen planus |
| LP: leukoplakia | ||
| NEOLP: Non-erosive oral lichen planus | ||
| OSCC: Oral squamous cell carcinoma | ||
| Skin | 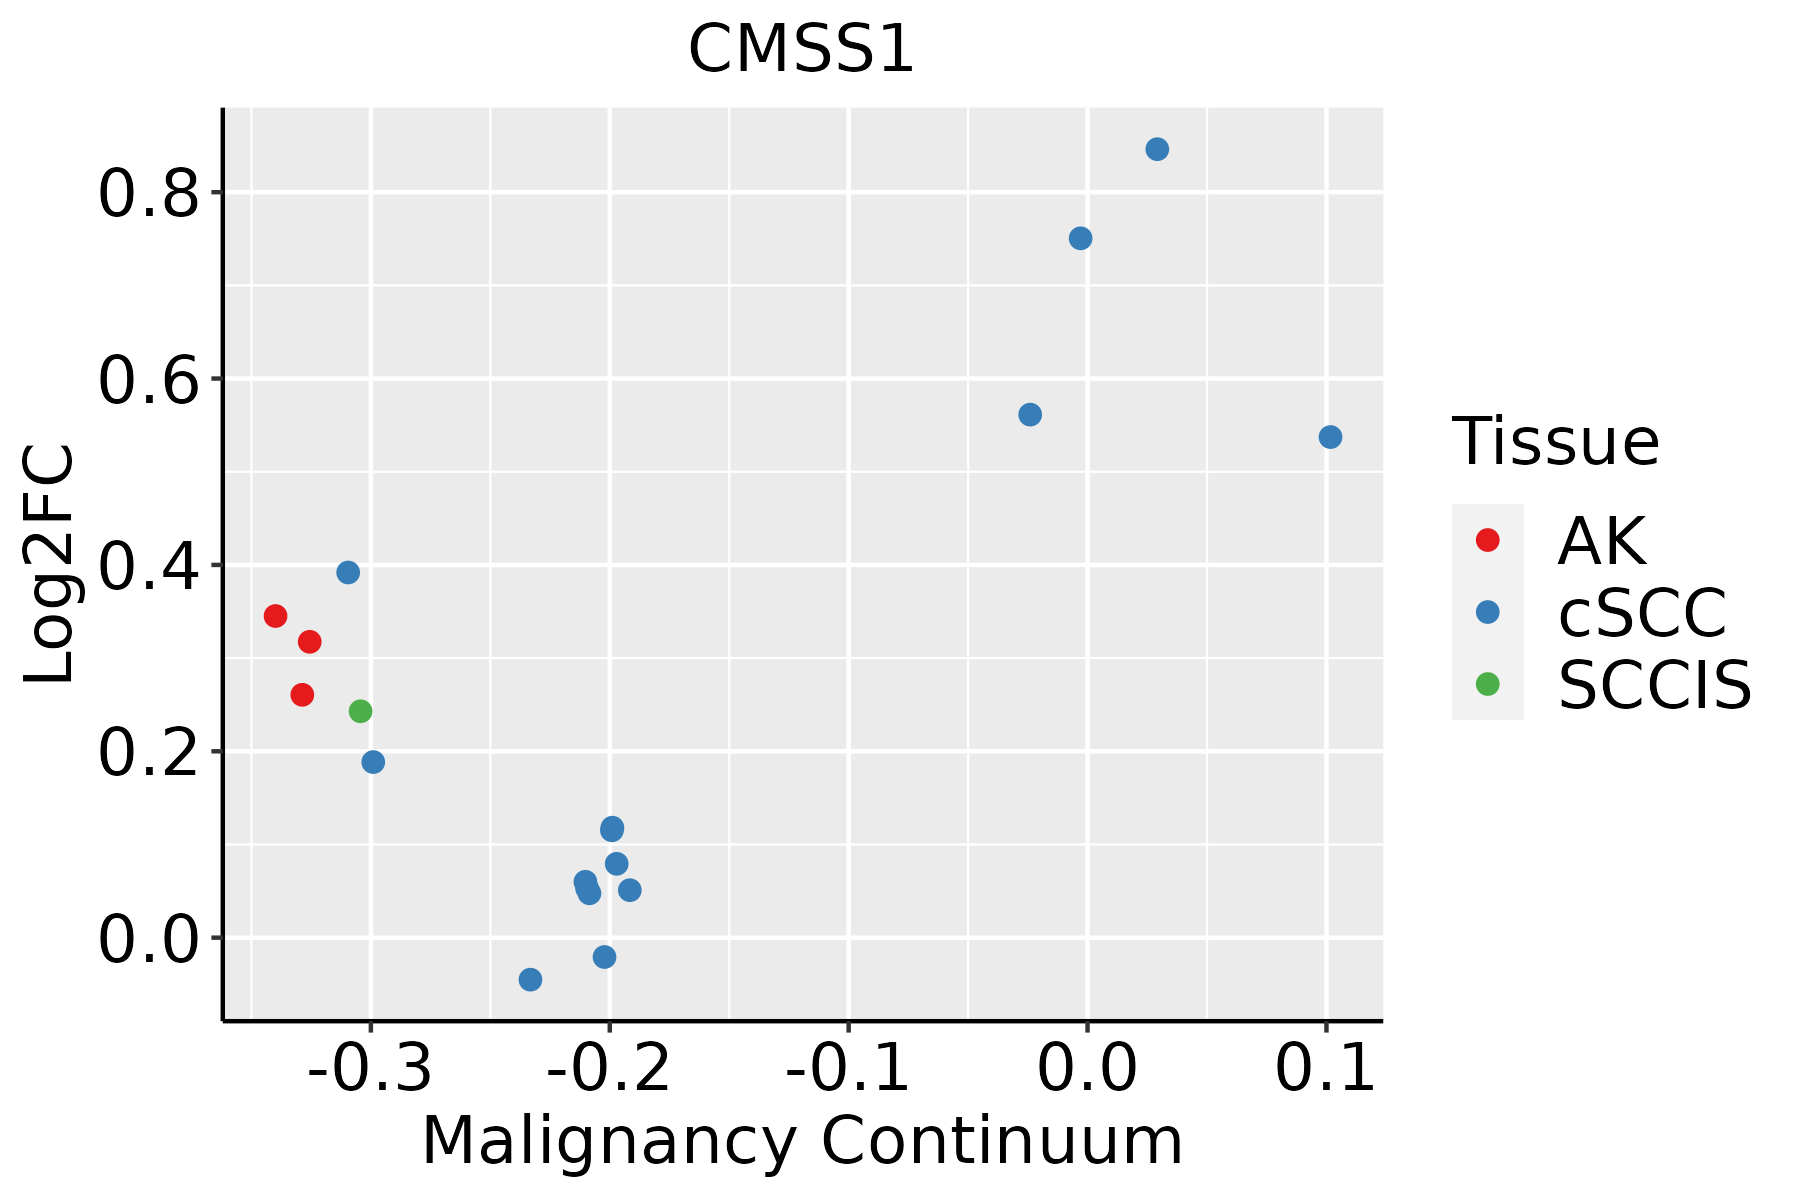 | AK: Actinic keratosis |
| cSCC: Cutaneous squamous cell carcinoma | ||
| SCCIS:squamous cell carcinoma in situ | ||
| Thyroid | 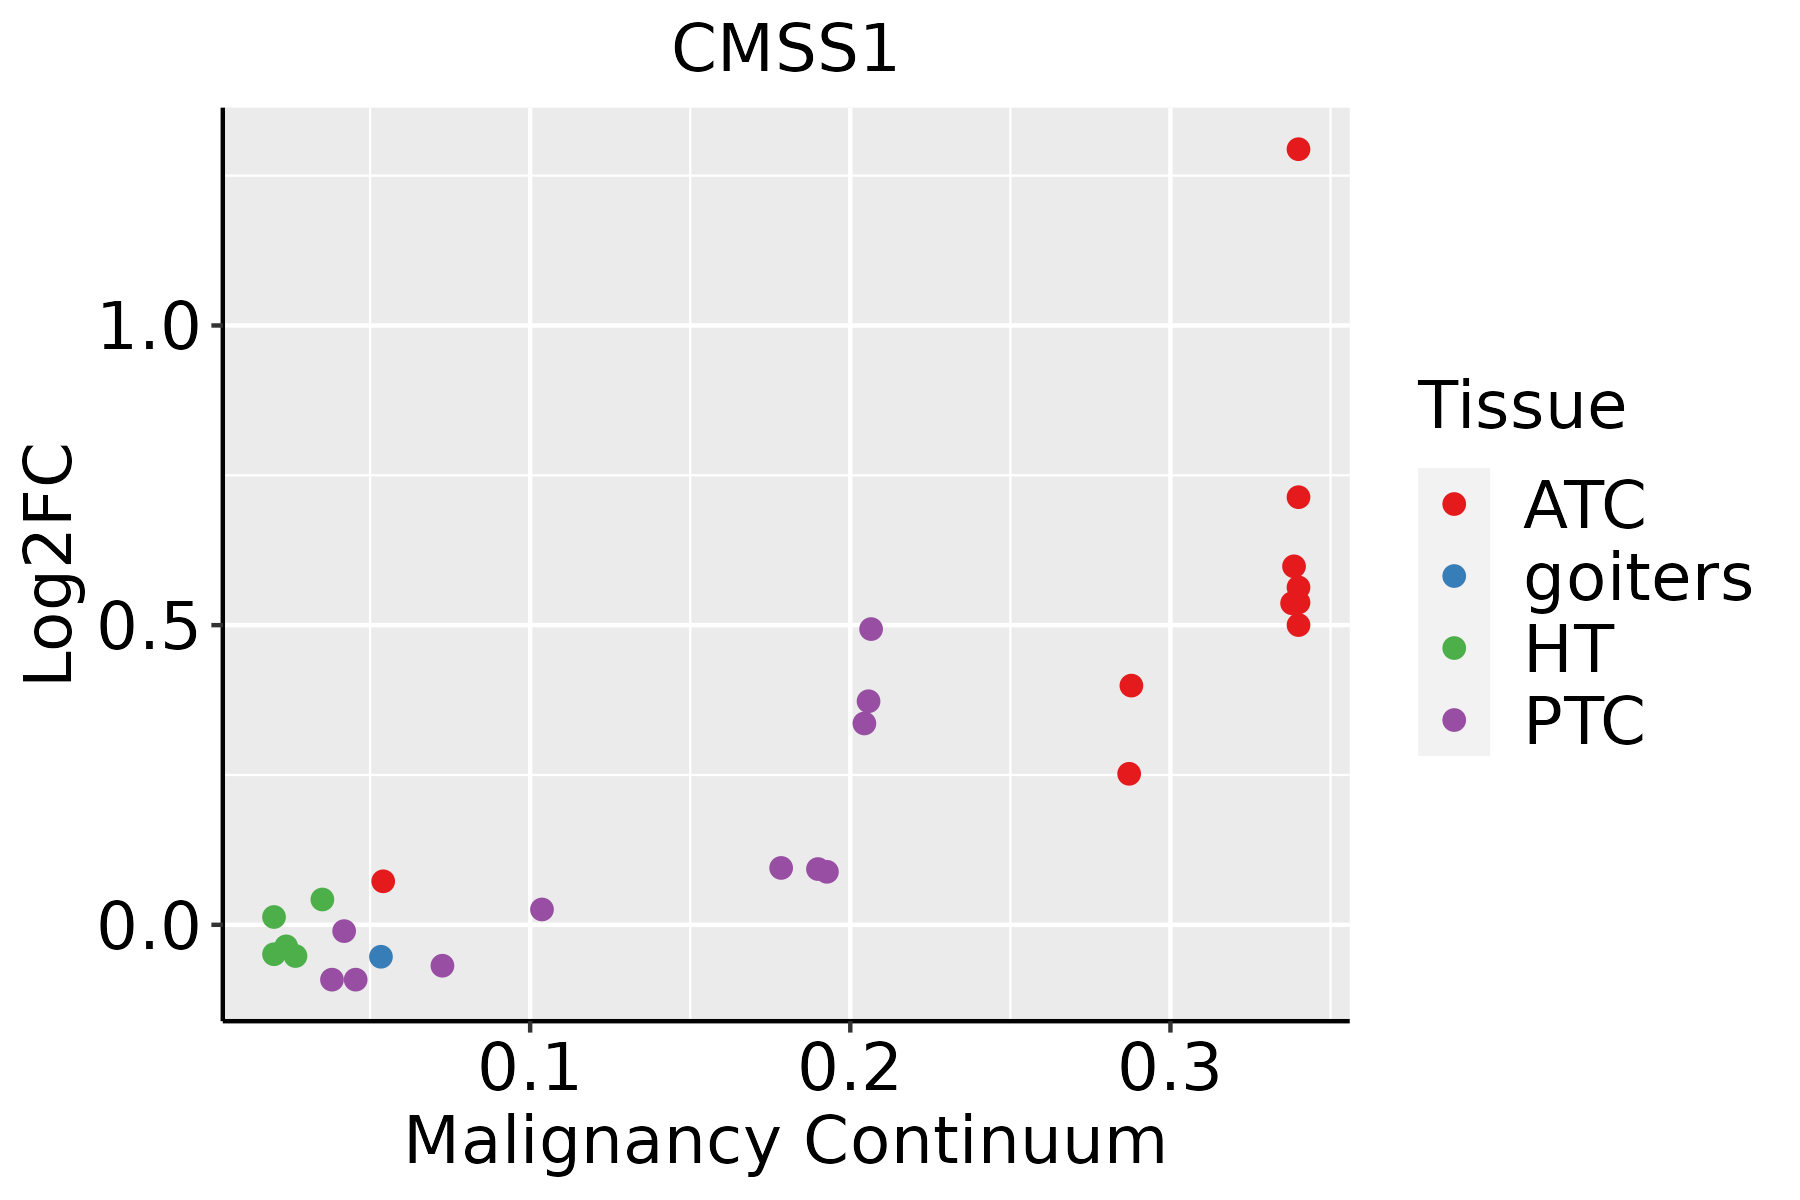 | ATC: Anaplastic thyroid cancer |
| HT: Hashimoto's thyroiditis | ||
| PTC: Papillary thyroid cancer |
| ∗log2FC in expression of this searched gene in stem-like cells from each diseased tissue sample relative to stem-like cells in normal samples in each tissue plotted against the malignancy continuum. Samples are colored based on if they are from different disease stage. |
Top |
Malignant transformation related pathway analysis |
| Find out the enriched GO biological processes and KEGG pathways involved in transition from healthy to precancer to cancer |
| Tissue | Disease Stage | Enriched GO biological Processes |
| Colorectum | AD |  |
| Colorectum | SER |  |
| Colorectum | MSS |  |
| Colorectum | MSI-H |  |
| Colorectum | FAP |  |
| ∗Top 15 enriched GO BP terms are showed in the bar plot of each disease state in each tissue. Each row represents a significant GO biological process which is colored according to the -log10(p.adjust). |
| Page: 1 2 3 4 5 6 7 8 9 |
| GO ID | Tissue | Disease Stage | Description | Gene Ratio | Bg Ratio | pvalue | p.adjust | Count |
| Page: 1 |
| Pathway ID | Tissue | Disease Stage | Description | Gene Ratio | Bg Ratio | pvalue | p.adjust | qvalue | Count |
| Page: 1 |
Top |
Cell-cell communication analysis |
| Identification of potential cell-cell interactions between two cell types and their ligand-receptor pairs for different disease states |
| Ligand | Receptor | LRpair | Pathway | Tissue | Disease Stage |
| Page: 1 |
Top |
Single-cell gene regulatory network inference analysis |
| Find out the significant the regulons (TFs) and the target genes of each regulon across cell types for different disease states |
| TF | Cell Type | Tissue | Disease Stage | Target Gene | RSS | Regulon Activity |
| ∗The dot plots of a searched regulon are shown for all cell subpopulations in each disease state of each tissue based on the regulon specific score inferred using pySCENIC and by calculating the average expression. |
| Page: 1 |
Top |
Somatic mutation of malignant transformation related genes |
| Annotation of somatic variants for genes involved in malignant transformation |
| Hugo Symbol | Variant Class | Variant Classification | dbSNP RS | HGVSc | HGVSp | HGVSp Short | SWISSPROT | BIOTYPE | SIFT | PolyPhen | Tumor Sample Barcode | Tissue | Histology | Sex | Age | Stage | Therapy Types | Drugs | Outcome |
| CMSS1 | SNV | Missense_Mutation | rs746747839 | c.464N>T | p.Ser155Leu | p.S155L | Q9BQ75 | protein_coding | deleterious(0.01) | probably_damaging(0.995) | TCGA-AN-A046-01 | Breast | breast invasive carcinoma | Female | >=65 | I/II | Unknown | Unknown | SD |
| CMSS1 | insertion | Frame_Shift_Ins | novel | c.648_649insCTATGTTGCCCAGGCTGGTCTC | p.Lys217LeufsTer12 | p.K217Lfs*12 | Q9BQ75 | protein_coding | TCGA-BH-A0AY-01 | Breast | breast invasive carcinoma | Female | <65 | I/II | Chemotherapy | SD | |||
| CMSS1 | SNV | Missense_Mutation | rs767387483 | c.587C>T | p.Ala196Val | p.A196V | Q9BQ75 | protein_coding | deleterious(0) | benign(0.007) | TCGA-2W-A8YY-01 | Cervix | cervical & endocervical cancer | Female | <65 | I/II | Chemotherapy | cisplatin | CR |
| CMSS1 | SNV | Missense_Mutation | c.4N>T | p.Ala2Ser | p.A2S | Q9BQ75 | protein_coding | deleterious(0.02) | probably_damaging(0.978) | TCGA-C5-A1MI-01 | Cervix | cervical & endocervical cancer | Female | <65 | I/II | Chemotherapy | cisplatin | PD | |
| CMSS1 | SNV | Missense_Mutation | rs752532070 | c.193N>A | p.Glu65Lys | p.E65K | Q9BQ75 | protein_coding | deleterious(0.04) | benign(0.258) | TCGA-DS-A5RQ-01 | Cervix | cervical & endocervical cancer | Female | >=65 | I/II | Chemotherapy | cisplatin | CR |
| CMSS1 | SNV | Missense_Mutation | novel | c.91N>A | p.Asp31Asn | p.D31N | Q9BQ75 | protein_coding | tolerated(0.09) | benign(0) | TCGA-JW-A5VL-01 | Cervix | cervical & endocervical cancer | Female | <65 | I/II | Unknown | Unknown | SD |
| CMSS1 | SNV | Missense_Mutation | c.691N>C | p.Lys231Gln | p.K231Q | Q9BQ75 | protein_coding | deleterious(0.01) | probably_damaging(0.978) | TCGA-AA-3667-01 | Colorectum | colon adenocarcinoma | Female | <65 | I/II | Unknown | Unknown | SD | |
| CMSS1 | SNV | Missense_Mutation | rs756587102 | c.741G>A | p.Met247Ile | p.M247I | Q9BQ75 | protein_coding | deleterious(0.02) | benign(0.018) | TCGA-CK-4951-01 | Colorectum | colon adenocarcinoma | Female | >=65 | I/II | Unknown | Unknown | PD |
| CMSS1 | SNV | Missense_Mutation | rs776581370 | c.611N>A | p.Arg204His | p.R204H | Q9BQ75 | protein_coding | tolerated(0.23) | benign(0.031) | TCGA-CM-4746-01 | Colorectum | colon adenocarcinoma | Male | <65 | I/II | Unknown | Unknown | SD |
| CMSS1 | SNV | Missense_Mutation | c.695T>G | p.Phe232Cys | p.F232C | Q9BQ75 | protein_coding | tolerated(0.14) | benign(0.009) | TCGA-AG-3892-01 | Colorectum | rectum adenocarcinoma | Female | <65 | I/II | Unknown | Unknown | SD |
| Page: 1 2 3 4 |
Top |
Related drugs of malignant transformation related genes |
| Identification of chemicals and drugs interact with genes involved in malignant transfromation |
| (DGIdb 4.0) |
| Entrez ID | Symbol | Category | Interaction Types | Drug Claim Name | Drug Name | PMIDs |
| Page: 1 |

Copyright 2023-Present -The University of Texas Health Science Center at Houston |