
|
|||||
|
 | |
| |
| |
| |
| |
| |
|
Gene: CCDC91 |
Gene summary for CCDC91 |
| Gene information | Species | Human | Gene symbol | CCDC91 | Gene ID | 55297 |
| Gene name | coiled-coil domain containing 91 | |
| Gene Alias | HSD8 | |
| Cytomap | 12p11.22 | |
| Gene Type | protein-coding | GO ID | GO:0006810 | UniProtAcc | Q05D28 |
Top |
Malignant transformation analysis |
| Identification of the aberrant gene expression in precancerous and cancerous lesions by comparing the gene expression of stem-like cells in diseased tissues with normal stem cells |
| Entrez ID | Symbol | Replicates | Species | Organ | Tissue | Adj P-value | Log2FC | Malignancy |
| 55297 | CCDC91 | HCC1_Meng | Human | Liver | HCC | 1.43e-60 | -9.03e-02 | 0.0246 |
| 55297 | CCDC91 | HCC2_Meng | Human | Liver | HCC | 3.43e-23 | -6.72e-02 | 0.0107 |
| 55297 | CCDC91 | HCC1 | Human | Liver | HCC | 2.51e-02 | 3.04e+00 | 0.5336 |
| 55297 | CCDC91 | HCC2 | Human | Liver | HCC | 4.85e-05 | 3.20e+00 | 0.5341 |
| 55297 | CCDC91 | Pt13.b | Human | Liver | HCC | 1.92e-06 | 3.23e-02 | 0.0251 |
| 55297 | CCDC91 | S014 | Human | Liver | HCC | 5.81e-09 | 4.73e-01 | 0.2254 |
| 55297 | CCDC91 | S015 | Human | Liver | HCC | 4.63e-08 | 5.28e-01 | 0.2375 |
| 55297 | CCDC91 | S016 | Human | Liver | HCC | 9.61e-07 | 3.70e-01 | 0.2243 |
| 55297 | CCDC91 | S027 | Human | Liver | HCC | 1.17e-03 | 4.21e-01 | 0.2446 |
| 55297 | CCDC91 | S028 | Human | Liver | HCC | 1.64e-08 | 4.57e-01 | 0.2503 |
| 55297 | CCDC91 | S029 | Human | Liver | HCC | 4.72e-04 | 4.27e-01 | 0.2581 |
| 55297 | CCDC91 | RNA-P17T-P17T-6 | Human | Lung | IAC | 3.30e-08 | 7.66e-01 | 0.3385 |
| 55297 | CCDC91 | RNA-P17T-P17T-8 | Human | Lung | IAC | 1.84e-05 | 5.81e-01 | 0.3329 |
| 55297 | CCDC91 | RNA-P25T1-P25T1-1 | Human | Lung | AIS | 1.26e-17 | 7.54e-01 | -0.2116 |
| 55297 | CCDC91 | RNA-P25T1-P25T1-2 | Human | Lung | AIS | 4.75e-08 | 7.80e-01 | -0.1941 |
| 55297 | CCDC91 | RNA-P25T1-P25T1-3 | Human | Lung | AIS | 1.69e-03 | 5.92e-01 | -0.2107 |
| 55297 | CCDC91 | RNA-P25T1-P25T1-4 | Human | Lung | AIS | 1.26e-11 | 6.83e-01 | -0.2119 |
| 55297 | CCDC91 | RNA-P3T-P3T-2 | Human | Lung | IAC | 1.19e-02 | 4.80e-01 | 0.1835 |
| 55297 | CCDC91 | RNA-P6T1-P6T1-1 | Human | Lung | MIAC | 5.03e-03 | 8.30e-01 | -0.0238 |
| 55297 | CCDC91 | RNA-P6T1-P6T1-2 | Human | Lung | MIAC | 2.74e-05 | 1.04e+00 | -0.0186 |
| Page: 1 2 3 4 5 6 7 8 9 10 11 |
| Tissue | Expression Dynamics | Abbreviation |
| Cervix | 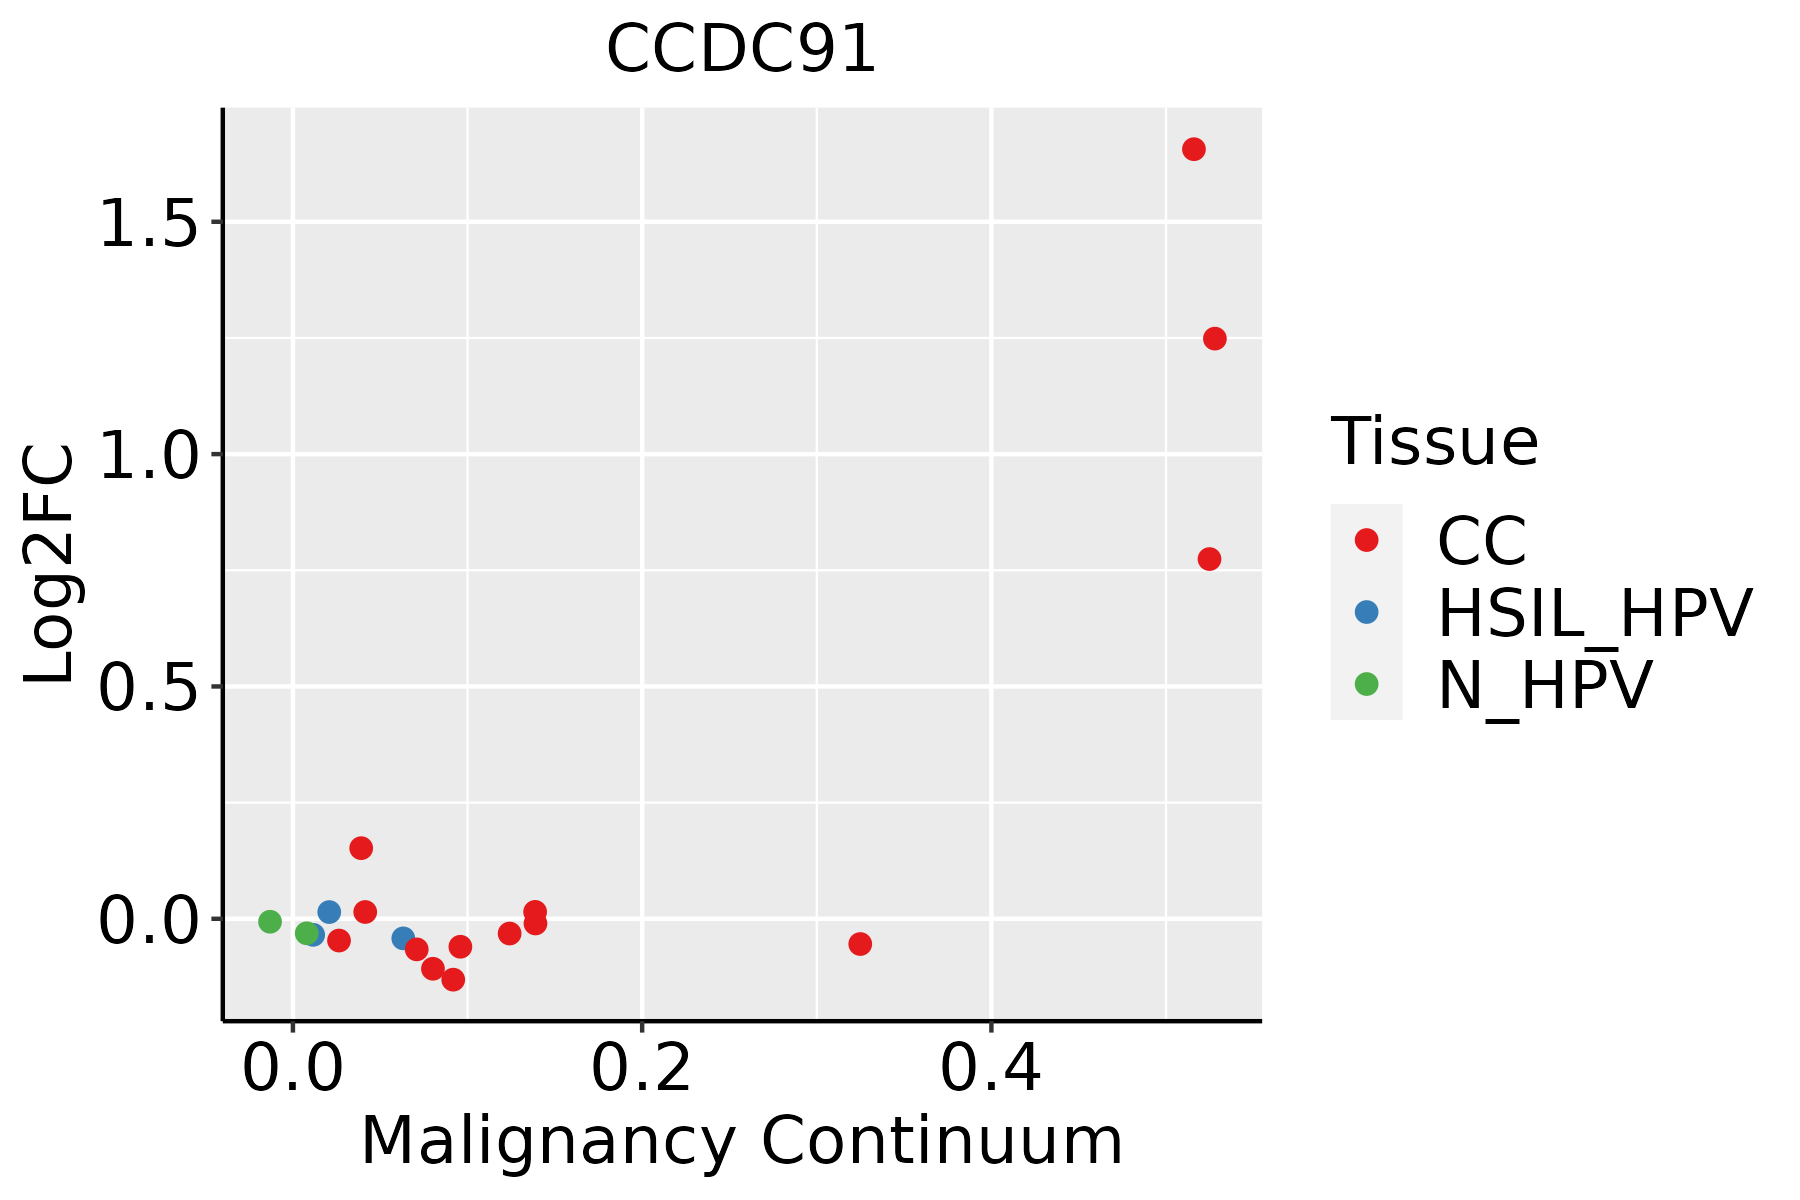 | CC: Cervix cancer |
| HSIL_HPV: HPV-infected high-grade squamous intraepithelial lesions | ||
| N_HPV: HPV-infected normal cervix | ||
| Colorectum (GSE201348) |  | FAP: Familial adenomatous polyposis |
| CRC: Colorectal cancer | ||
| Colorectum (HTA11) |  | AD: Adenomas |
| SER: Sessile serrated lesions | ||
| MSI-H: Microsatellite-high colorectal cancer | ||
| MSS: Microsatellite stable colorectal cancer | ||
| Endometrium | 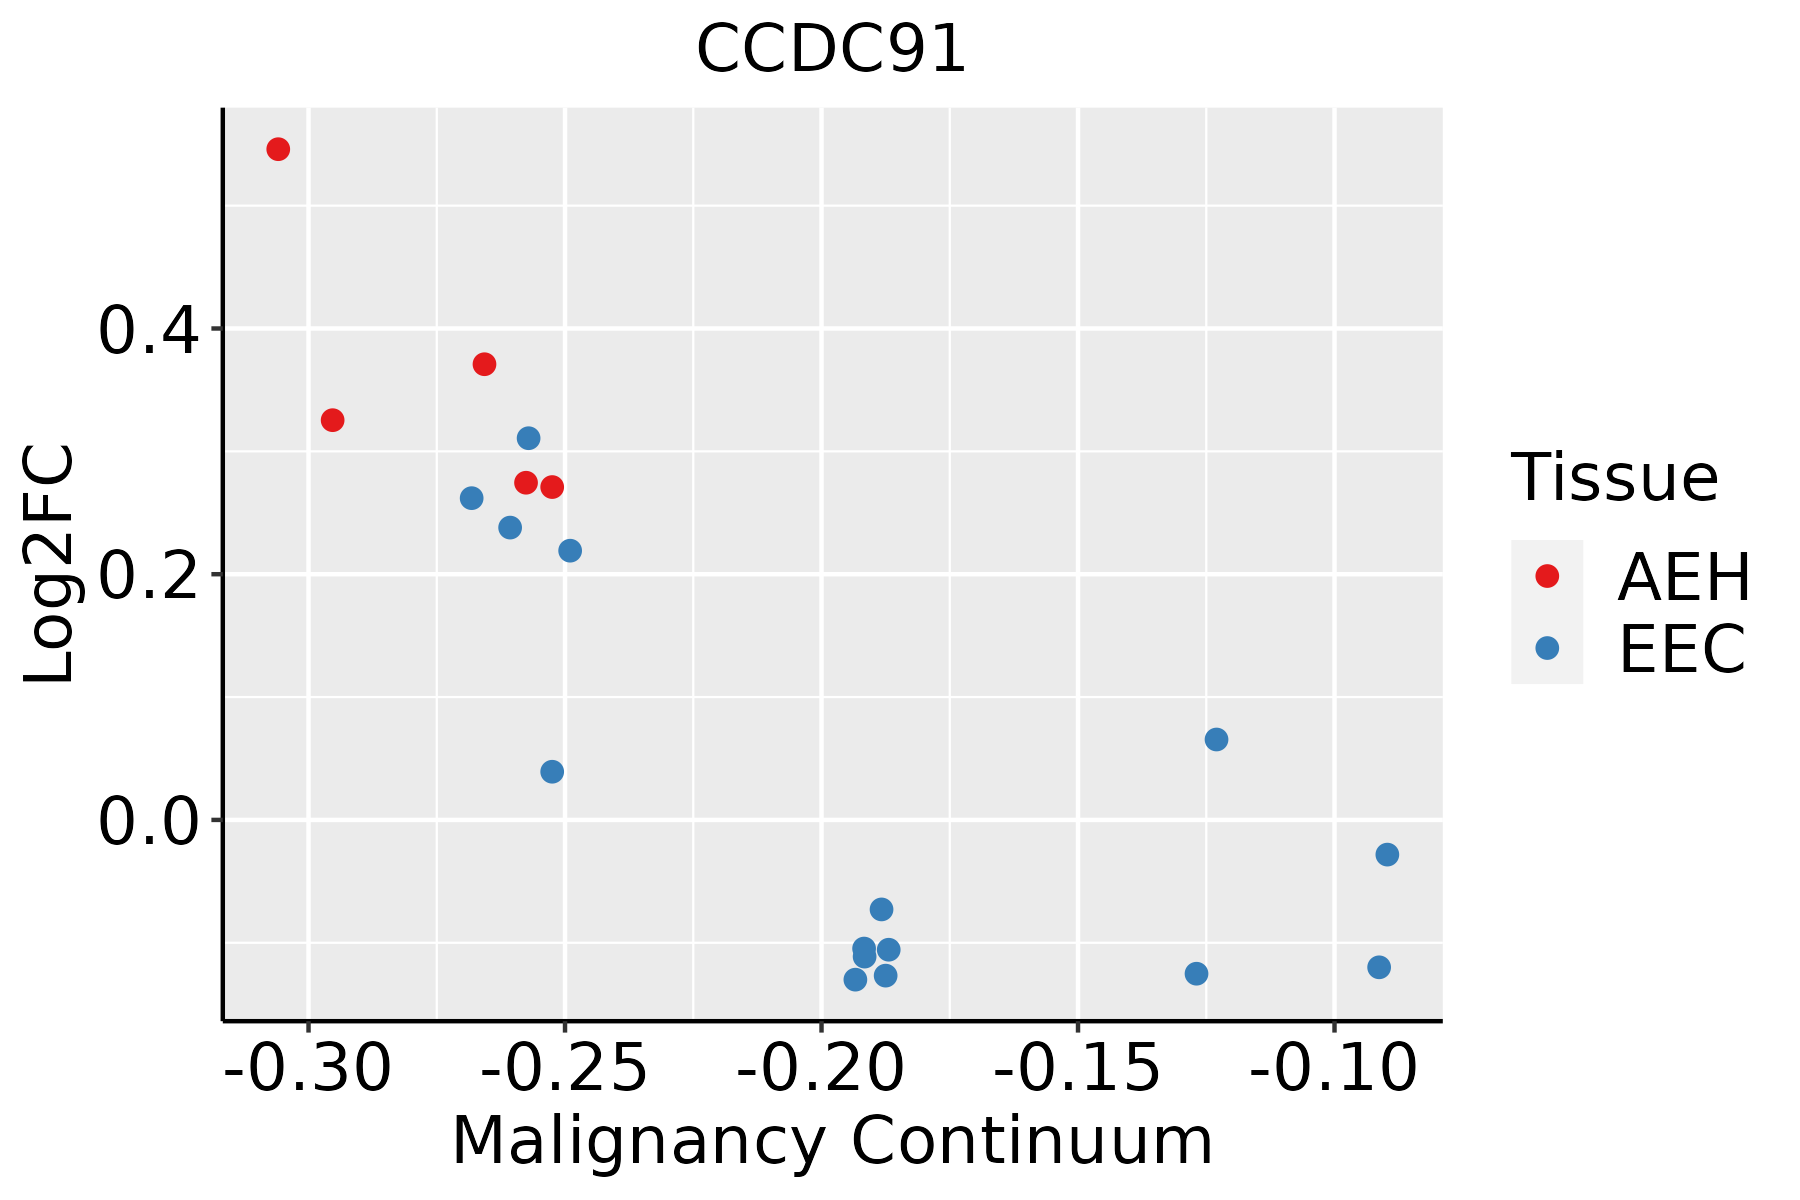 | AEH: Atypical endometrial hyperplasia |
| EEC: Endometrioid Cancer | ||
| Esophagus | 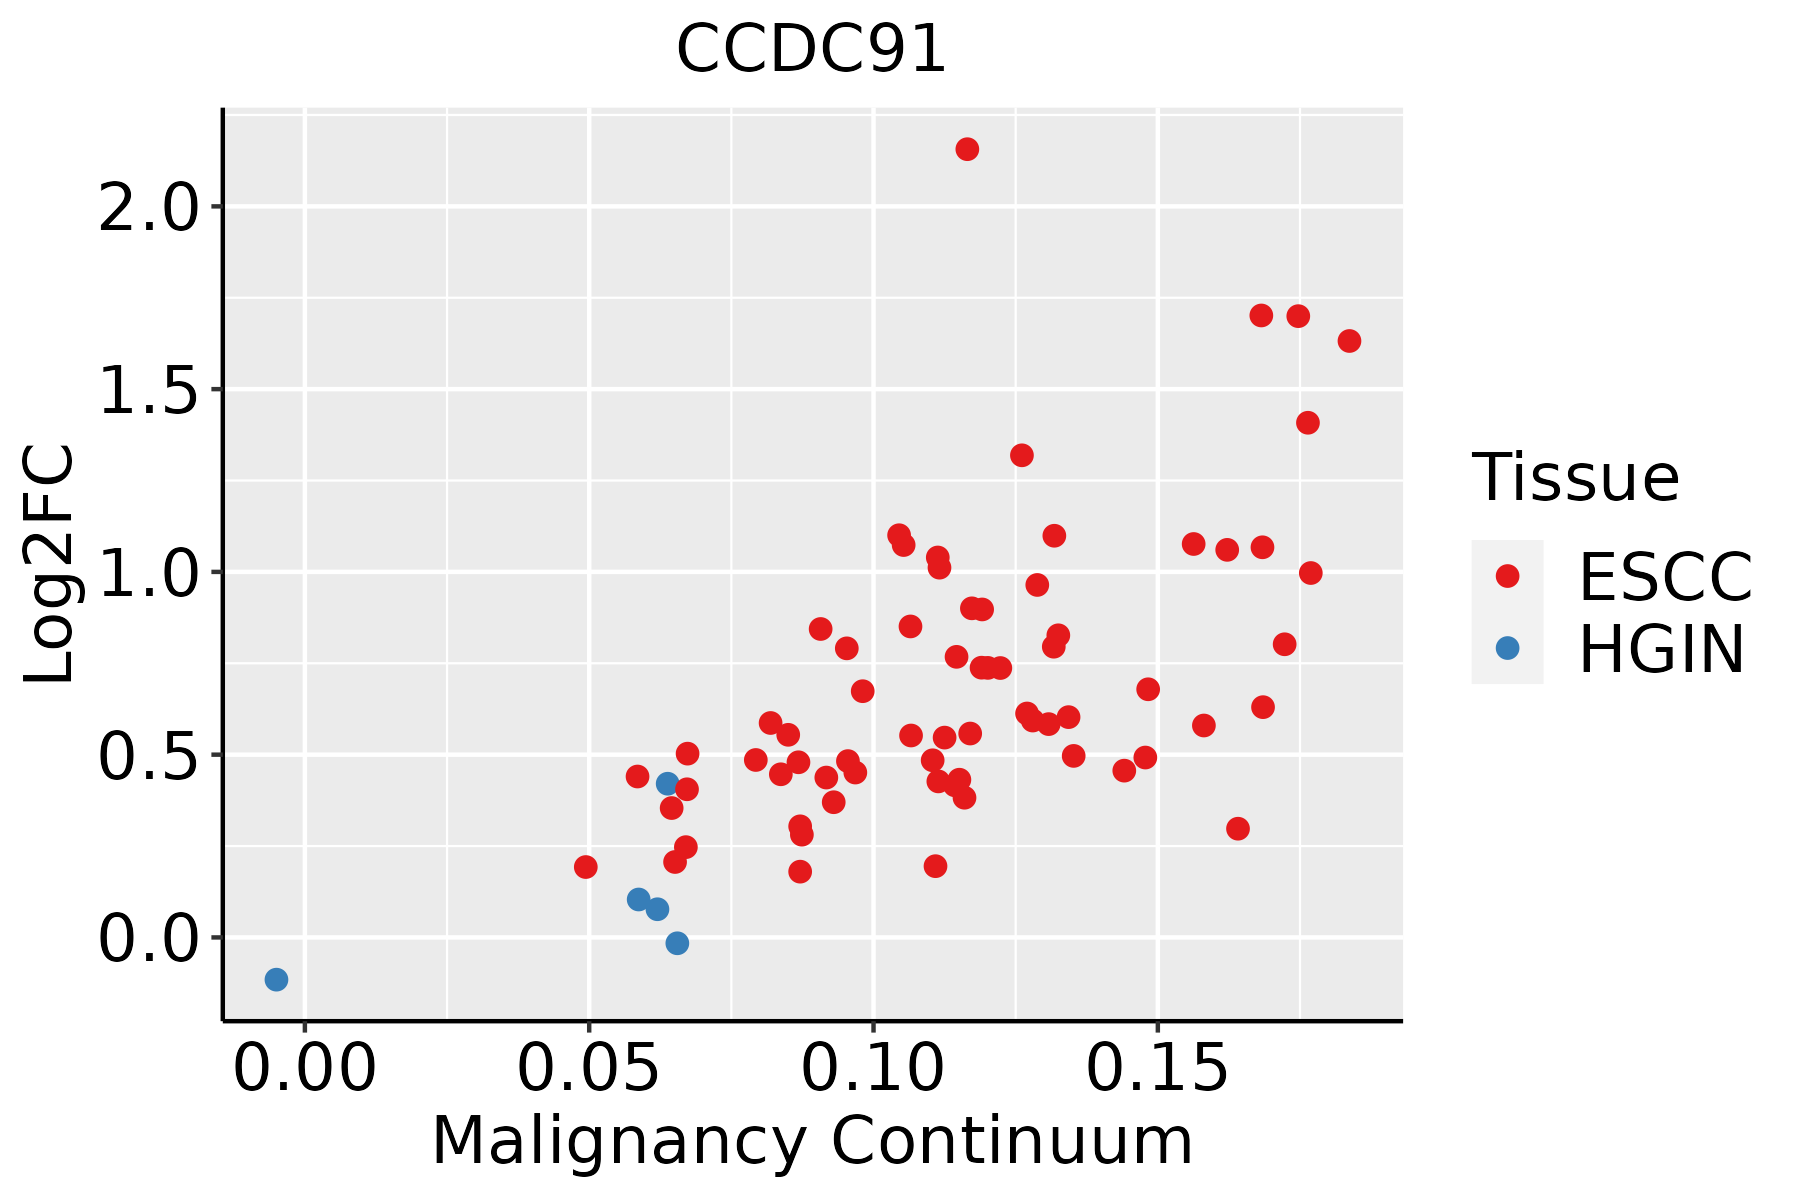 | ESCC: Esophageal squamous cell carcinoma |
| HGIN: High-grade intraepithelial neoplasias | ||
| LGIN: Low-grade intraepithelial neoplasias | ||
| Liver | 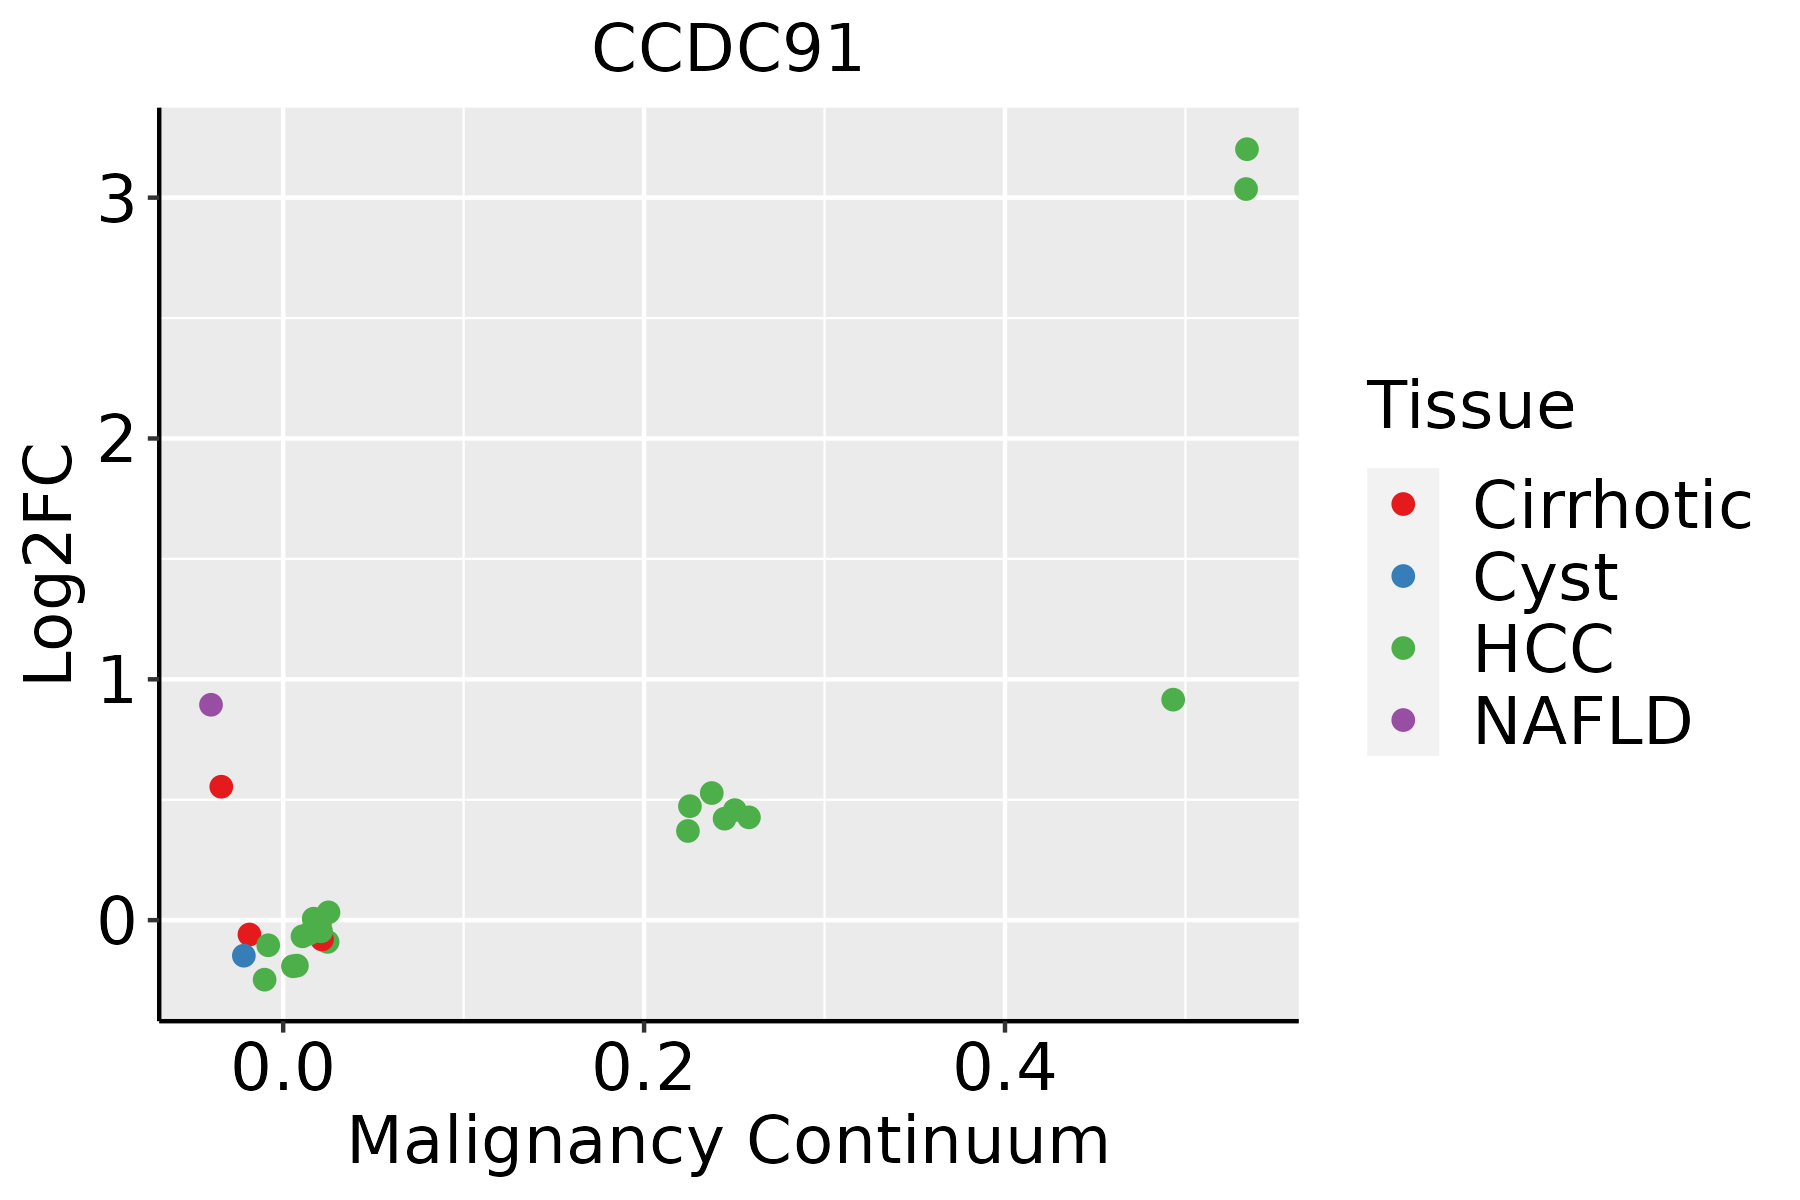 | HCC: Hepatocellular carcinoma |
| NAFLD: Non-alcoholic fatty liver disease | ||
| Lung | 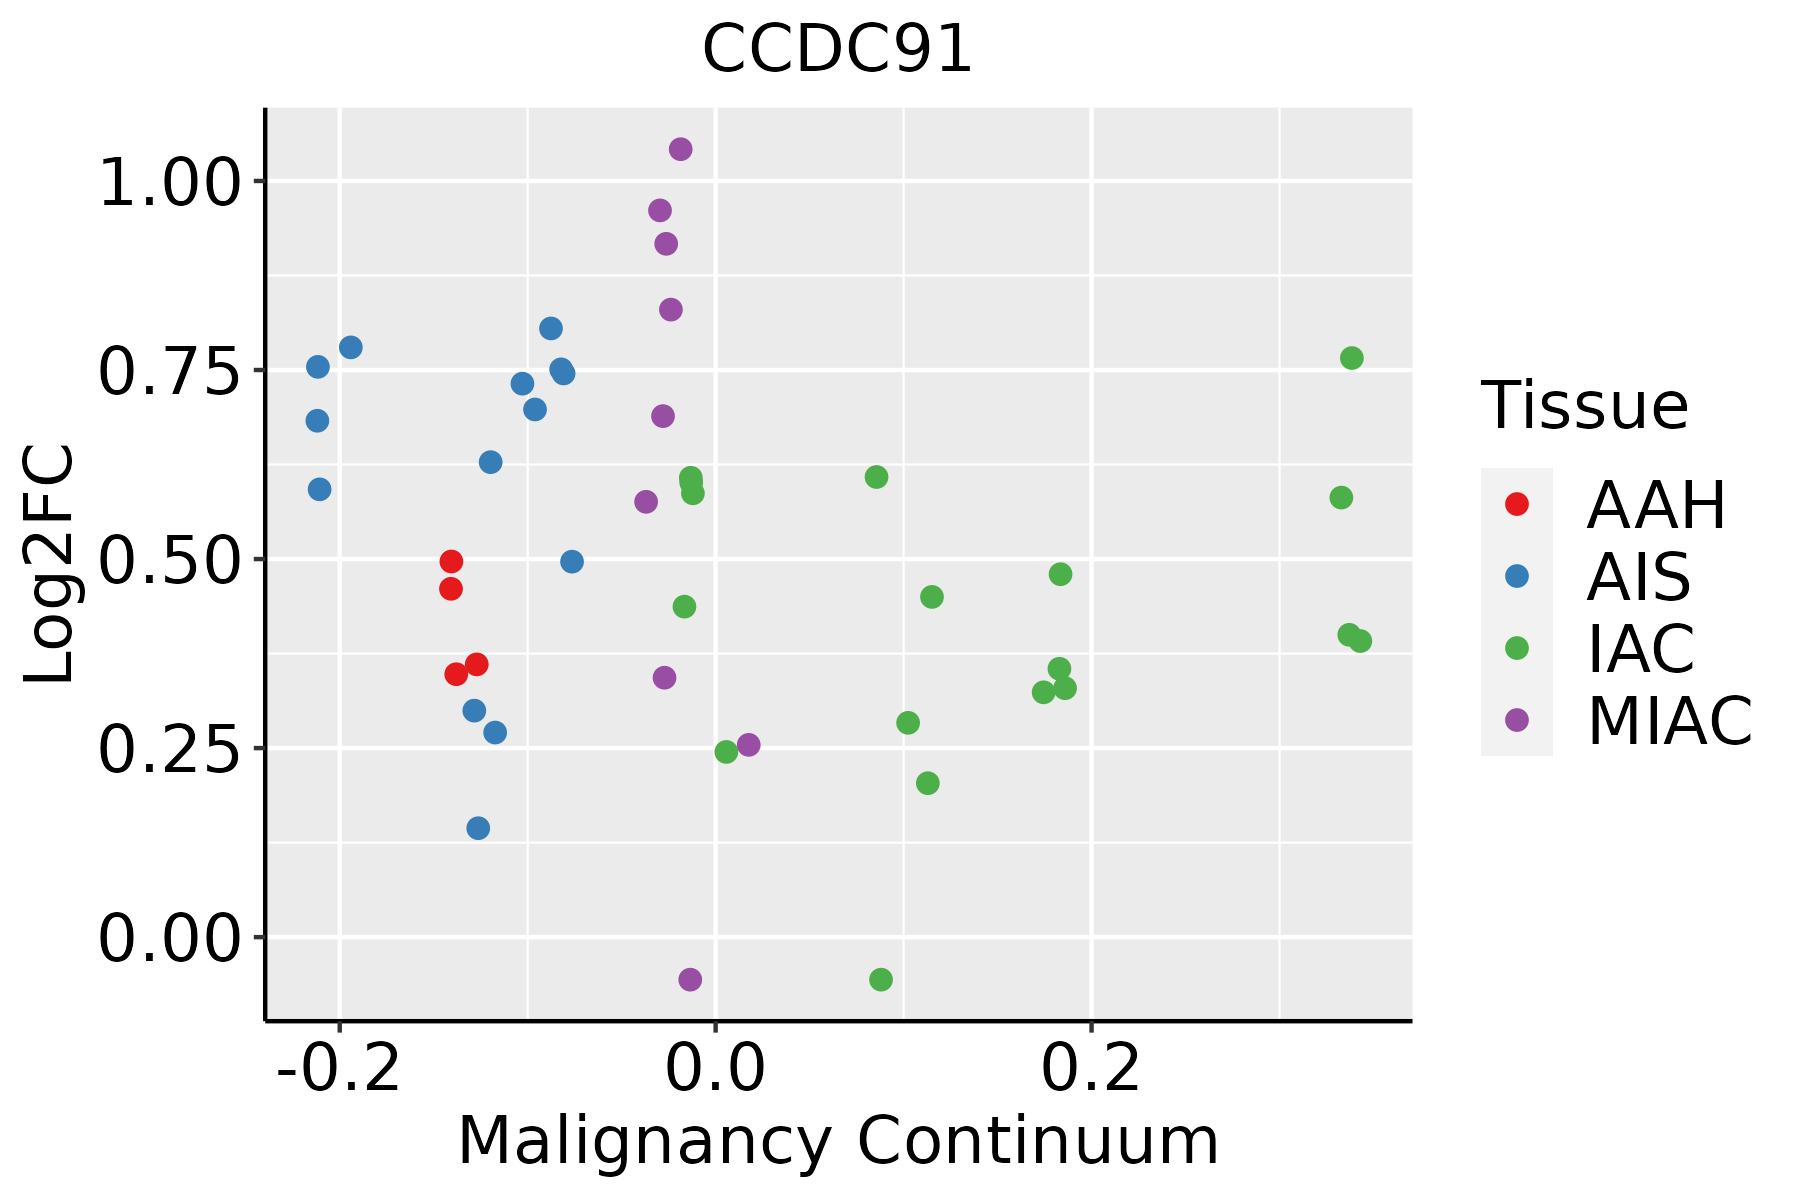 | AAH: Atypical adenomatous hyperplasia |
| AIS: Adenocarcinoma in situ | ||
| IAC: Invasive lung adenocarcinoma | ||
| MIA: Minimally invasive adenocarcinoma | ||
| Oral Cavity | 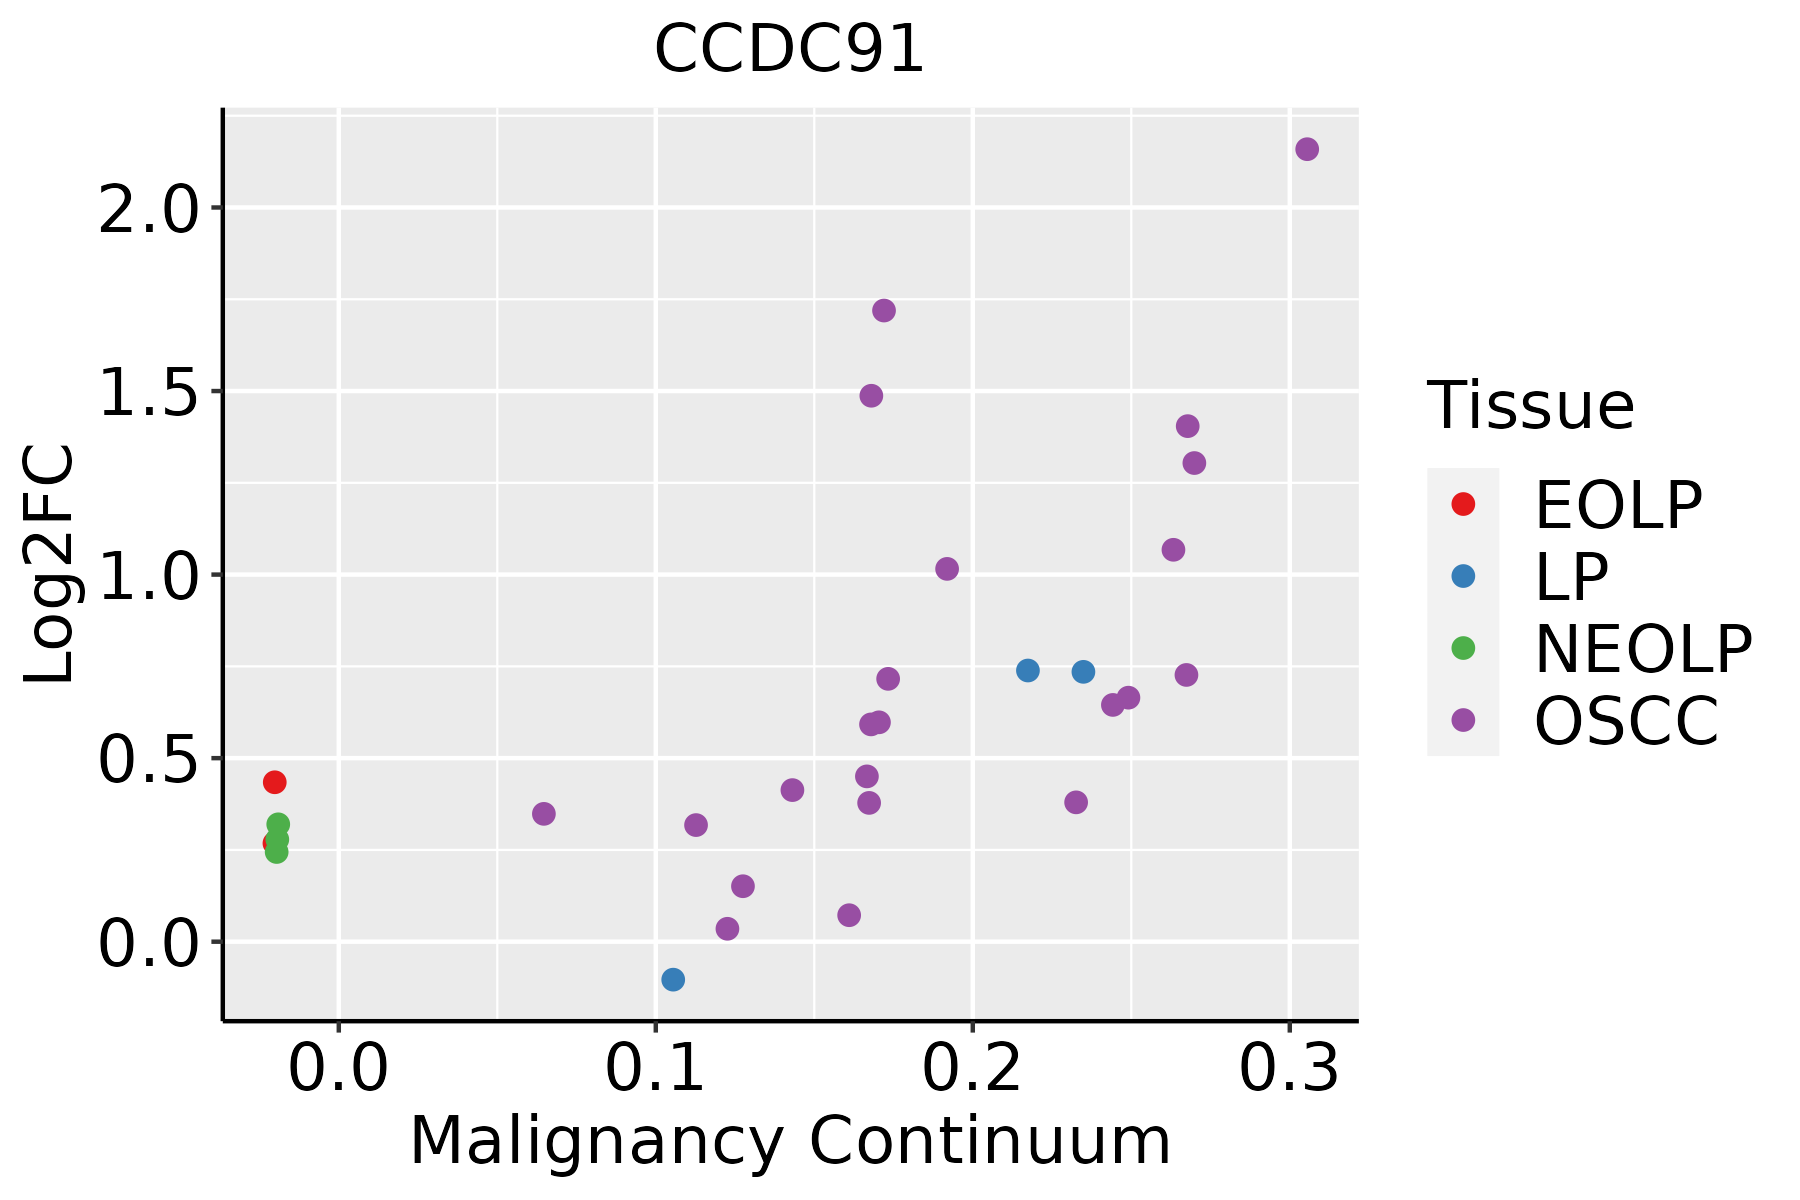 | EOLP: Erosive Oral lichen planus |
| LP: leukoplakia | ||
| NEOLP: Non-erosive oral lichen planus | ||
| OSCC: Oral squamous cell carcinoma | ||
| Skin |  | AK: Actinic keratosis |
| cSCC: Cutaneous squamous cell carcinoma | ||
| SCCIS:squamous cell carcinoma in situ | ||
| Thyroid | 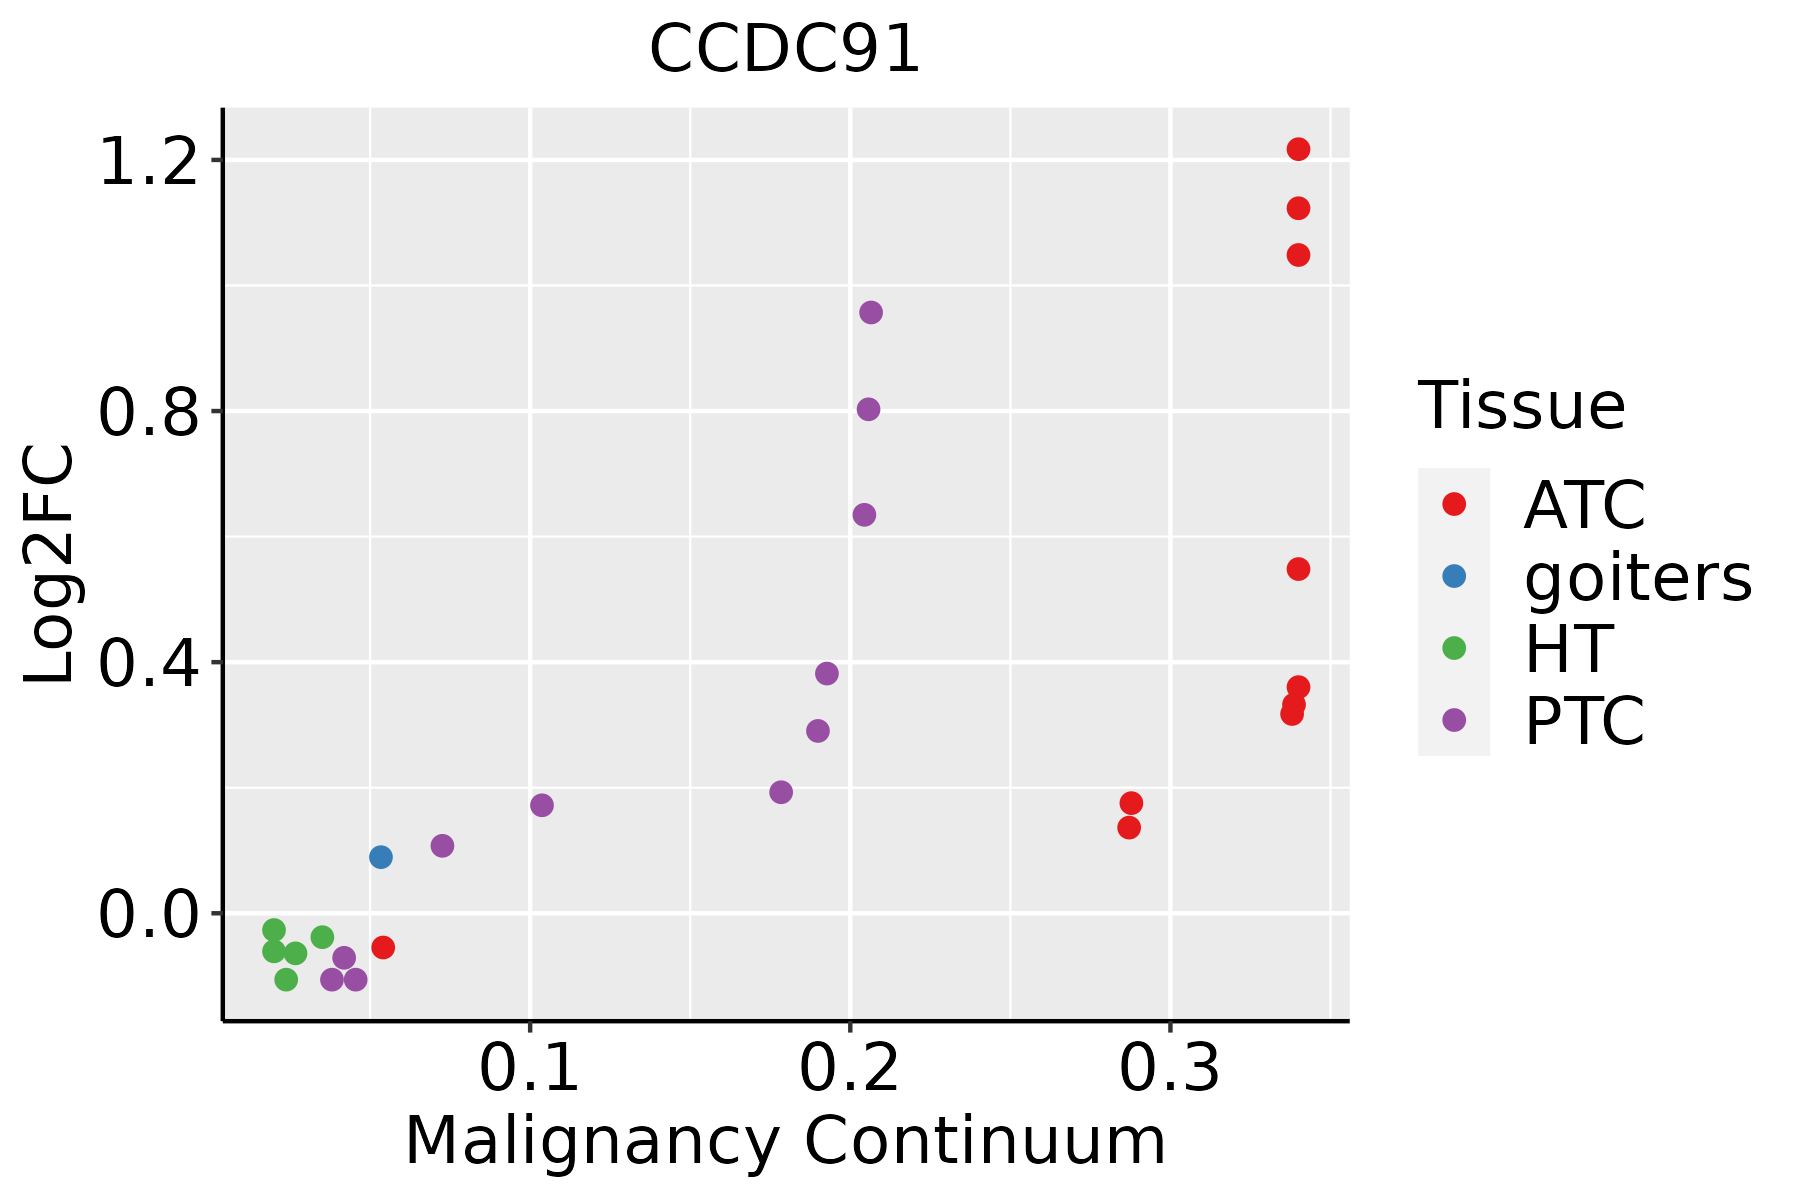 | ATC: Anaplastic thyroid cancer |
| HT: Hashimoto's thyroiditis | ||
| PTC: Papillary thyroid cancer |
| ∗log2FC in expression of this searched gene in stem-like cells from each diseased tissue sample relative to stem-like cells in normal samples in each tissue plotted against the malignancy continuum. Samples are colored based on if they are from different disease stage. |
Top |
Malignant transformation related pathway analysis |
| Find out the enriched GO biological processes and KEGG pathways involved in transition from healthy to precancer to cancer |
| Tissue | Disease Stage | Enriched GO biological Processes |
| Colorectum | AD |  |
| Colorectum | SER |  |
| Colorectum | MSS |  |
| Colorectum | MSI-H |  |
| Colorectum | FAP |  |
| ∗Top 15 enriched GO BP terms are showed in the bar plot of each disease state in each tissue. Each row represents a significant GO biological process which is colored according to the -log10(p.adjust). |
| Page: 1 2 3 4 5 6 7 8 9 |
| GO ID | Tissue | Disease Stage | Description | Gene Ratio | Bg Ratio | pvalue | p.adjust | Count |
| GO:00068927 | Cervix | CC | post-Golgi vesicle-mediated transport | 28/2311 | 104/18723 | 4.31e-05 | 6.61e-04 | 28 |
| GO:00481938 | Cervix | CC | Golgi vesicle transport | 58/2311 | 296/18723 | 2.24e-04 | 2.54e-03 | 58 |
| GO:00070347 | Cervix | CC | vacuolar transport | 34/2311 | 157/18723 | 7.03e-04 | 6.40e-03 | 34 |
| GO:00164827 | Cervix | CC | cytosolic transport | 33/2311 | 168/18723 | 4.43e-03 | 2.70e-02 | 33 |
| GO:00070416 | Cervix | CC | lysosomal transport | 24/2311 | 114/18723 | 5.81e-03 | 3.33e-02 | 24 |
| GO:0048193 | Colorectum | AD | Golgi vesicle transport | 109/3918 | 296/18723 | 1.80e-10 | 1.68e-08 | 109 |
| GO:0016482 | Colorectum | AD | cytosolic transport | 68/3918 | 168/18723 | 6.00e-09 | 3.72e-07 | 68 |
| GO:0006892 | Colorectum | AD | post-Golgi vesicle-mediated transport | 45/3918 | 104/18723 | 2.22e-07 | 9.26e-06 | 45 |
| GO:0007034 | Colorectum | AD | vacuolar transport | 60/3918 | 157/18723 | 4.97e-07 | 1.85e-05 | 60 |
| GO:0007041 | Colorectum | AD | lysosomal transport | 42/3918 | 114/18723 | 6.61e-05 | 1.07e-03 | 42 |
| GO:00481932 | Colorectum | MSS | Golgi vesicle transport | 101/3467 | 296/18723 | 9.09e-11 | 9.77e-09 | 101 |
| GO:00164822 | Colorectum | MSS | cytosolic transport | 59/3467 | 168/18723 | 2.29e-07 | 9.79e-06 | 59 |
| GO:00068922 | Colorectum | MSS | post-Golgi vesicle-mediated transport | 40/3467 | 104/18723 | 1.45e-06 | 4.82e-05 | 40 |
| GO:00070342 | Colorectum | MSS | vacuolar transport | 52/3467 | 157/18723 | 8.25e-06 | 2.07e-04 | 52 |
| GO:00070411 | Colorectum | MSS | lysosomal transport | 36/3467 | 114/18723 | 5.38e-04 | 6.04e-03 | 36 |
| GO:00481933 | Colorectum | MSI-H | Golgi vesicle transport | 39/1319 | 296/18723 | 1.17e-04 | 3.51e-03 | 39 |
| GO:00481934 | Colorectum | FAP | Golgi vesicle transport | 77/2622 | 296/18723 | 2.86e-08 | 2.62e-06 | 77 |
| GO:00068923 | Colorectum | FAP | post-Golgi vesicle-mediated transport | 36/2622 | 104/18723 | 9.23e-08 | 6.22e-06 | 36 |
| GO:00164823 | Colorectum | FAP | cytosolic transport | 47/2622 | 168/18723 | 1.58e-06 | 6.72e-05 | 47 |
| GO:00070343 | Colorectum | FAP | vacuolar transport | 40/2622 | 157/18723 | 9.41e-05 | 1.61e-03 | 40 |
| Page: 1 2 3 4 5 6 |
| Pathway ID | Tissue | Disease Stage | Description | Gene Ratio | Bg Ratio | pvalue | p.adjust | qvalue | Count |
| Page: 1 |
Top |
Cell-cell communication analysis |
| Identification of potential cell-cell interactions between two cell types and their ligand-receptor pairs for different disease states |
| Ligand | Receptor | LRpair | Pathway | Tissue | Disease Stage |
| Page: 1 |
Top |
Single-cell gene regulatory network inference analysis |
| Find out the significant the regulons (TFs) and the target genes of each regulon across cell types for different disease states |
| TF | Cell Type | Tissue | Disease Stage | Target Gene | RSS | Regulon Activity |
| ∗The dot plots of a searched regulon are shown for all cell subpopulations in each disease state of each tissue based on the regulon specific score inferred using pySCENIC and by calculating the average expression. |
| Page: 1 |
Top |
Somatic mutation of malignant transformation related genes |
| Annotation of somatic variants for genes involved in malignant transformation |
| Hugo Symbol | Variant Class | Variant Classification | dbSNP RS | HGVSc | HGVSp | HGVSp Short | SWISSPROT | BIOTYPE | SIFT | PolyPhen | Tumor Sample Barcode | Tissue | Histology | Sex | Age | Stage | Therapy Types | Drugs | Outcome |
| CCDC91 | SNV | Missense_Mutation | c.768N>C | p.Gln256His | p.Q256H | Q7Z6B0 | protein_coding | deleterious(0) | probably_damaging(0.997) | TCGA-A8-A06Q-01 | Breast | breast invasive carcinoma | Female | <65 | III/IV | Unknown | Unknown | SD | |
| CCDC91 | SNV | Missense_Mutation | rs544457452 | c.995N>T | p.Ala332Val | p.A332V | Q7Z6B0 | protein_coding | tolerated(1) | benign(0) | TCGA-B6-A0IH-01 | Breast | breast invasive carcinoma | Female | >=65 | III/IV | Unknown | Unknown | SD |
| CCDC91 | SNV | Missense_Mutation | novel | c.272N>C | p.Gln91Pro | p.Q91P | Q7Z6B0 | protein_coding | tolerated(0.18) | probably_damaging(0.986) | TCGA-C8-A130-01 | Breast | breast invasive carcinoma | Female | <65 | III/IV | Unknown | Unknown | SD |
| CCDC91 | deletion | Frame_Shift_Del | novel | c.871_874delNNNN | p.Cys291TrpfsTer12 | p.C291Wfs*12 | Q7Z6B0 | protein_coding | TCGA-3C-AALK-01 | Breast | breast invasive carcinoma | Female | <65 | I/II | Chemotherapy | docetaxel | SD | ||
| CCDC91 | SNV | Missense_Mutation | c.721N>C | p.Glu241Gln | p.E241Q | Q7Z6B0 | protein_coding | deleterious(0.01) | probably_damaging(0.996) | TCGA-Q1-A73O-01 | Cervix | cervical & endocervical cancer | Female | <65 | I/II | Chemotherapy | cisplatin | CR | |
| CCDC91 | insertion | Frame_Shift_Ins | novel | c.1047_1048insAATAAAT | p.Lys350AsnfsTer3 | p.K350Nfs*3 | Q7Z6B0 | protein_coding | TCGA-DS-A1OD-01 | Cervix | cervical & endocervical cancer | Female | <65 | I/II | Chemotherapy | cisplatin | SD | ||
| CCDC91 | SNV | Missense_Mutation | novel | c.1079A>G | p.Gln360Arg | p.Q360R | Q7Z6B0 | protein_coding | tolerated(0.07) | benign(0.015) | TCGA-A6-3809-01 | Colorectum | colon adenocarcinoma | Female | >=65 | I/II | Unknown | Unknown | SD |
| CCDC91 | SNV | Missense_Mutation | novel | c.668N>T | p.Ser223Phe | p.S223F | Q7Z6B0 | protein_coding | deleterious(0.01) | possibly_damaging(0.735) | TCGA-AA-3510-01 | Colorectum | colon adenocarcinoma | Male | >=65 | I/II | Unknown | Unknown | SD |
| CCDC91 | SNV | Missense_Mutation | rs753292484 | c.622N>A | p.Glu208Lys | p.E208K | Q7Z6B0 | protein_coding | deleterious(0.01) | benign(0.294) | TCGA-AA-A00N-01 | Colorectum | colon adenocarcinoma | Male | >=65 | I/II | Unknown | Unknown | PD |
| CCDC91 | SNV | Missense_Mutation | novel | c.947N>G | p.Asp316Gly | p.D316G | Q7Z6B0 | protein_coding | deleterious(0.02) | benign(0.068) | TCGA-CM-6168-01 | Colorectum | colon adenocarcinoma | Female | >=65 | I/II | Unknown | Unknown | SD |
| Page: 1 2 3 4 5 6 |
Top |
Related drugs of malignant transformation related genes |
| Identification of chemicals and drugs interact with genes involved in malignant transfromation |
| (DGIdb 4.0) |
| Entrez ID | Symbol | Category | Interaction Types | Drug Claim Name | Drug Name | PMIDs |
| Page: 1 |

Copyright 2023-Present -The University of Texas Health Science Center at Houston |