
|
|||||
|
 | |
| |
| |
| |
| |
| |
|
Gene: C19orf43 |
Gene summary for C19ORF43 |
| Gene information | Species | Human | Gene symbol | C19orf43 | Gene ID | 79002 |
| Gene name | telomerase RNA component interacting RNase | |
| Gene Alias | C19orf43 | |
| Cytomap | 19p13.13 | |
| Gene Type | protein-coding | GO ID | GO:0006139 | UniProtAcc | K7EN60 |
Top |
Malignant transformation analysis |
| Identification of the aberrant gene expression in precancerous and cancerous lesions by comparing the gene expression of stem-like cells in diseased tissues with normal stem cells |
| Entrez ID | Symbol | Replicates | Species | Organ | Tissue | Adj P-value | Log2FC | Malignancy |
| 79002 | C19orf43 | P61T-E | Human | Esophagus | ESCC | 4.41e-62 | 1.67e+00 | 0.099 |
| 79002 | C19orf43 | P62T-E | Human | Esophagus | ESCC | 4.15e-123 | 2.37e+00 | 0.1302 |
| 79002 | C19orf43 | P65T-E | Human | Esophagus | ESCC | 2.31e-50 | 1.24e+00 | 0.0978 |
| 79002 | C19orf43 | P74T-E | Human | Esophagus | ESCC | 3.87e-46 | 1.33e+00 | 0.1479 |
| 79002 | C19orf43 | P75T-E | Human | Esophagus | ESCC | 4.60e-77 | 1.59e+00 | 0.1125 |
| 79002 | C19orf43 | P76T-E | Human | Esophagus | ESCC | 1.06e-51 | 1.10e+00 | 0.1207 |
| 79002 | C19orf43 | P79T-E | Human | Esophagus | ESCC | 2.94e-23 | 5.42e-01 | 0.1154 |
| 79002 | C19orf43 | P80T-E | Human | Esophagus | ESCC | 2.14e-59 | 1.77e+00 | 0.155 |
| 79002 | C19orf43 | P82T-E | Human | Esophagus | ESCC | 1.87e-24 | 1.28e+00 | 0.1072 |
| 79002 | C19orf43 | P83T-E | Human | Esophagus | ESCC | 4.01e-61 | 1.72e+00 | 0.1738 |
| 79002 | C19orf43 | P84T-E | Human | Esophagus | ESCC | 1.18e-09 | 7.50e-01 | 0.0933 |
| 79002 | C19orf43 | P89T-E | Human | Esophagus | ESCC | 1.37e-28 | 1.82e+00 | 0.1752 |
| 79002 | C19orf43 | P91T-E | Human | Esophagus | ESCC | 4.40e-21 | 2.15e+00 | 0.1828 |
| 79002 | C19orf43 | P104T-E | Human | Esophagus | ESCC | 6.41e-10 | 1.21e+00 | 0.0931 |
| 79002 | C19orf43 | P107T-E | Human | Esophagus | ESCC | 7.73e-68 | 1.72e+00 | 0.171 |
| 79002 | C19orf43 | P126T-E | Human | Esophagus | ESCC | 2.96e-26 | 2.54e+00 | 0.1125 |
| 79002 | C19orf43 | P127T-E | Human | Esophagus | ESCC | 1.20e-79 | 1.55e+00 | 0.0826 |
| 79002 | C19orf43 | P128T-E | Human | Esophagus | ESCC | 4.22e-71 | 3.03e+00 | 0.1241 |
| 79002 | C19orf43 | P130T-E | Human | Esophagus | ESCC | 6.03e-128 | 2.96e+00 | 0.1676 |
| 79002 | C19orf43 | S41 | Human | Liver | Cirrhotic | 1.10e-04 | -6.98e-01 | -0.0343 |
| Page: 1 2 3 4 5 6 7 8 9 10 11 12 |
| Tissue | Expression Dynamics | Abbreviation |
| Breast | 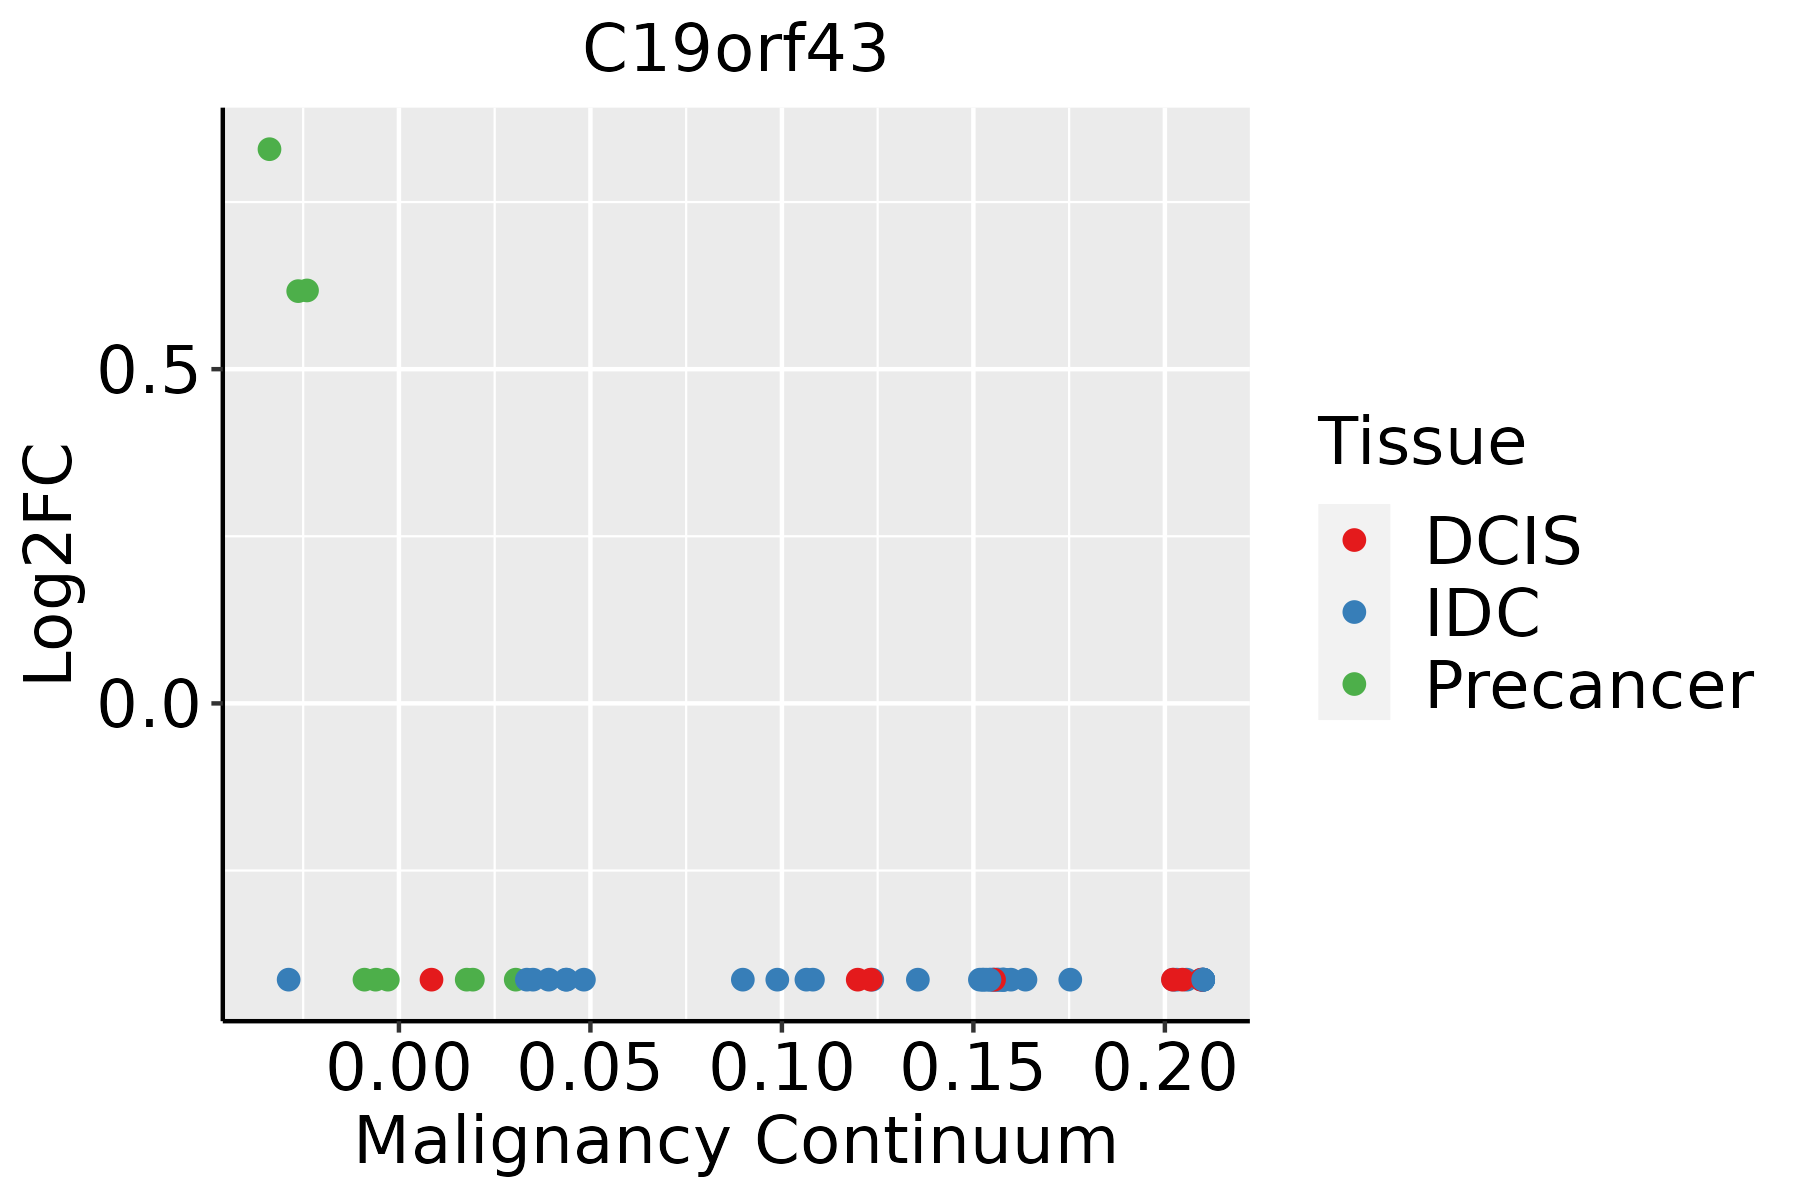 | IDC: Invasive ductal carcinoma |
| DCIS: Ductal carcinoma in situ | ||
| Precancer(BRCA1-mut): Precancerous lesion from BRCA1 mutation carriers | ||
| Colorectum (GSE201348) | 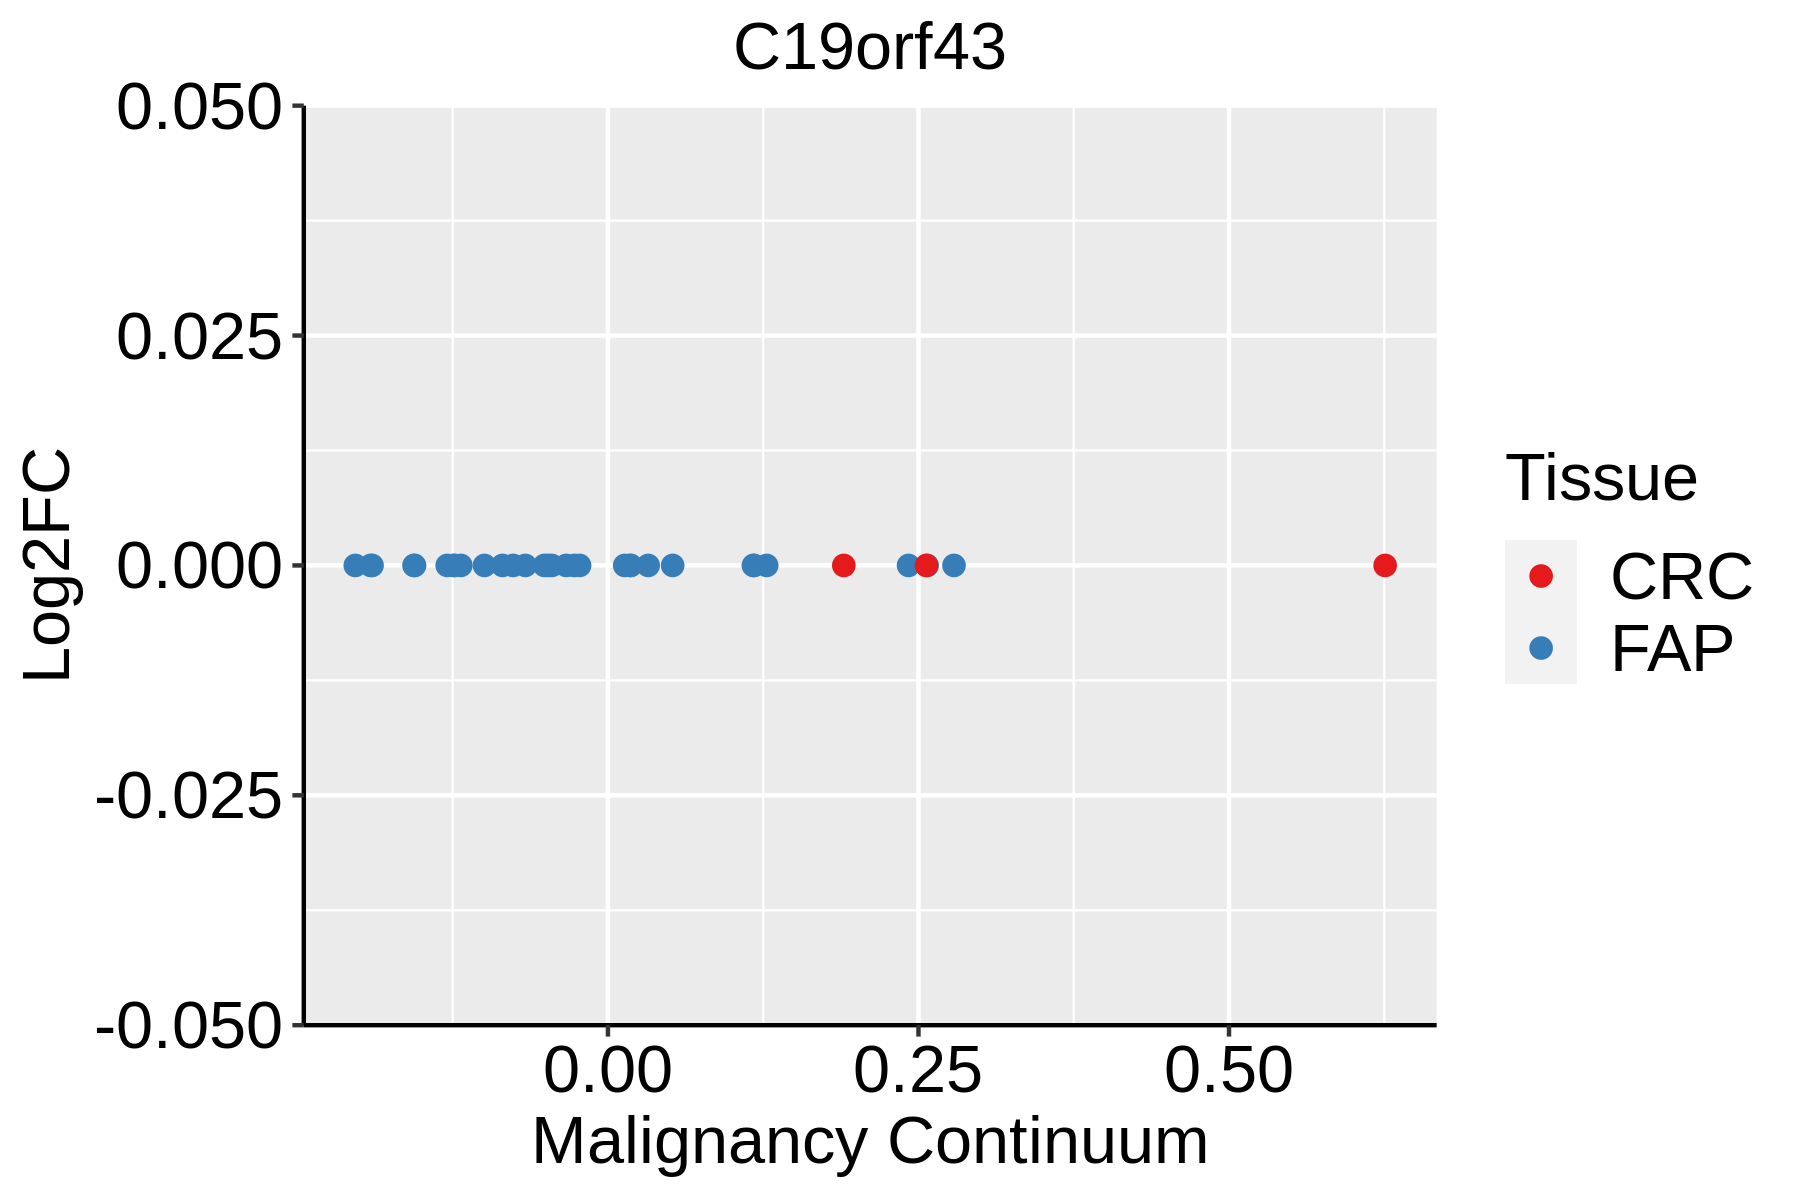 | FAP: Familial adenomatous polyposis |
| CRC: Colorectal cancer | ||
| Colorectum (HTA11) | 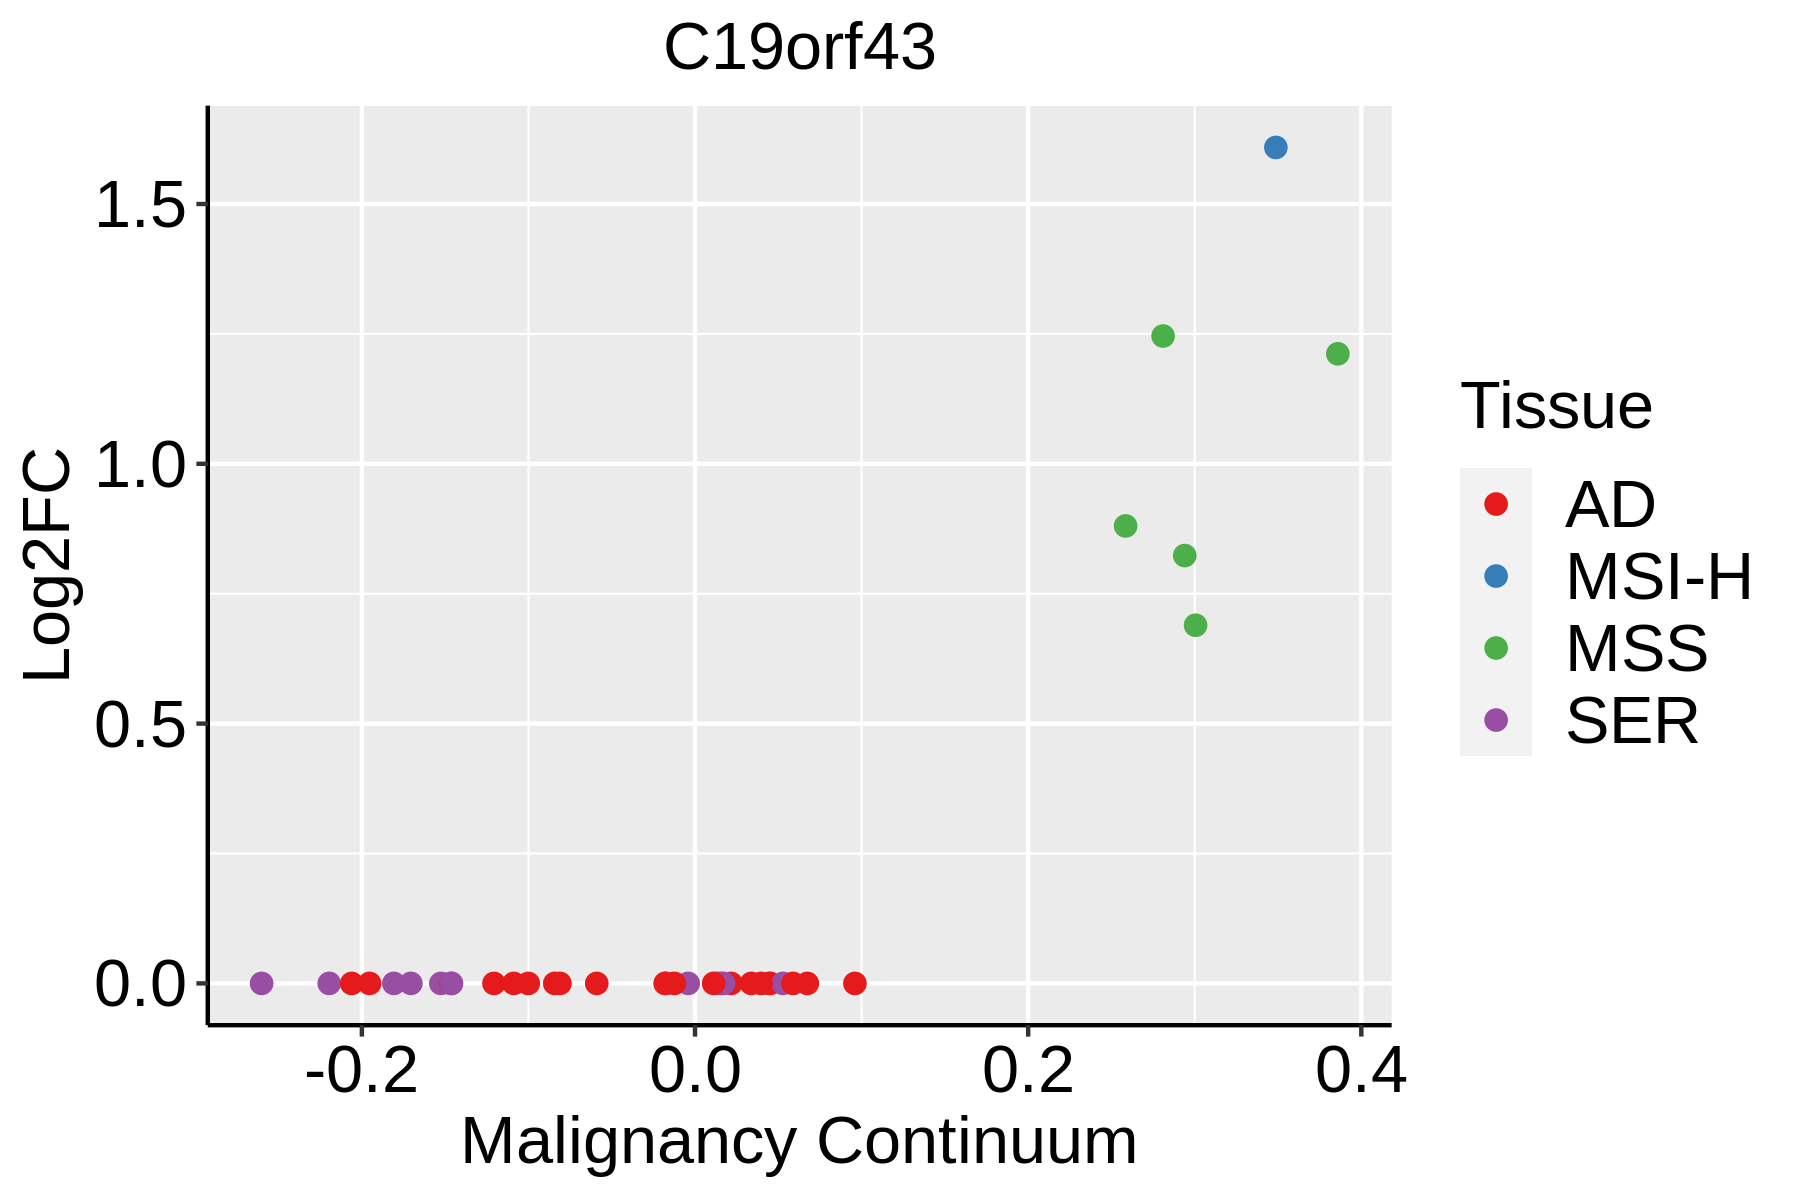 | AD: Adenomas |
| SER: Sessile serrated lesions | ||
| MSI-H: Microsatellite-high colorectal cancer | ||
| MSS: Microsatellite stable colorectal cancer | ||
| Endometrium |  | AEH: Atypical endometrial hyperplasia |
| EEC: Endometrioid Cancer | ||
| Esophagus | 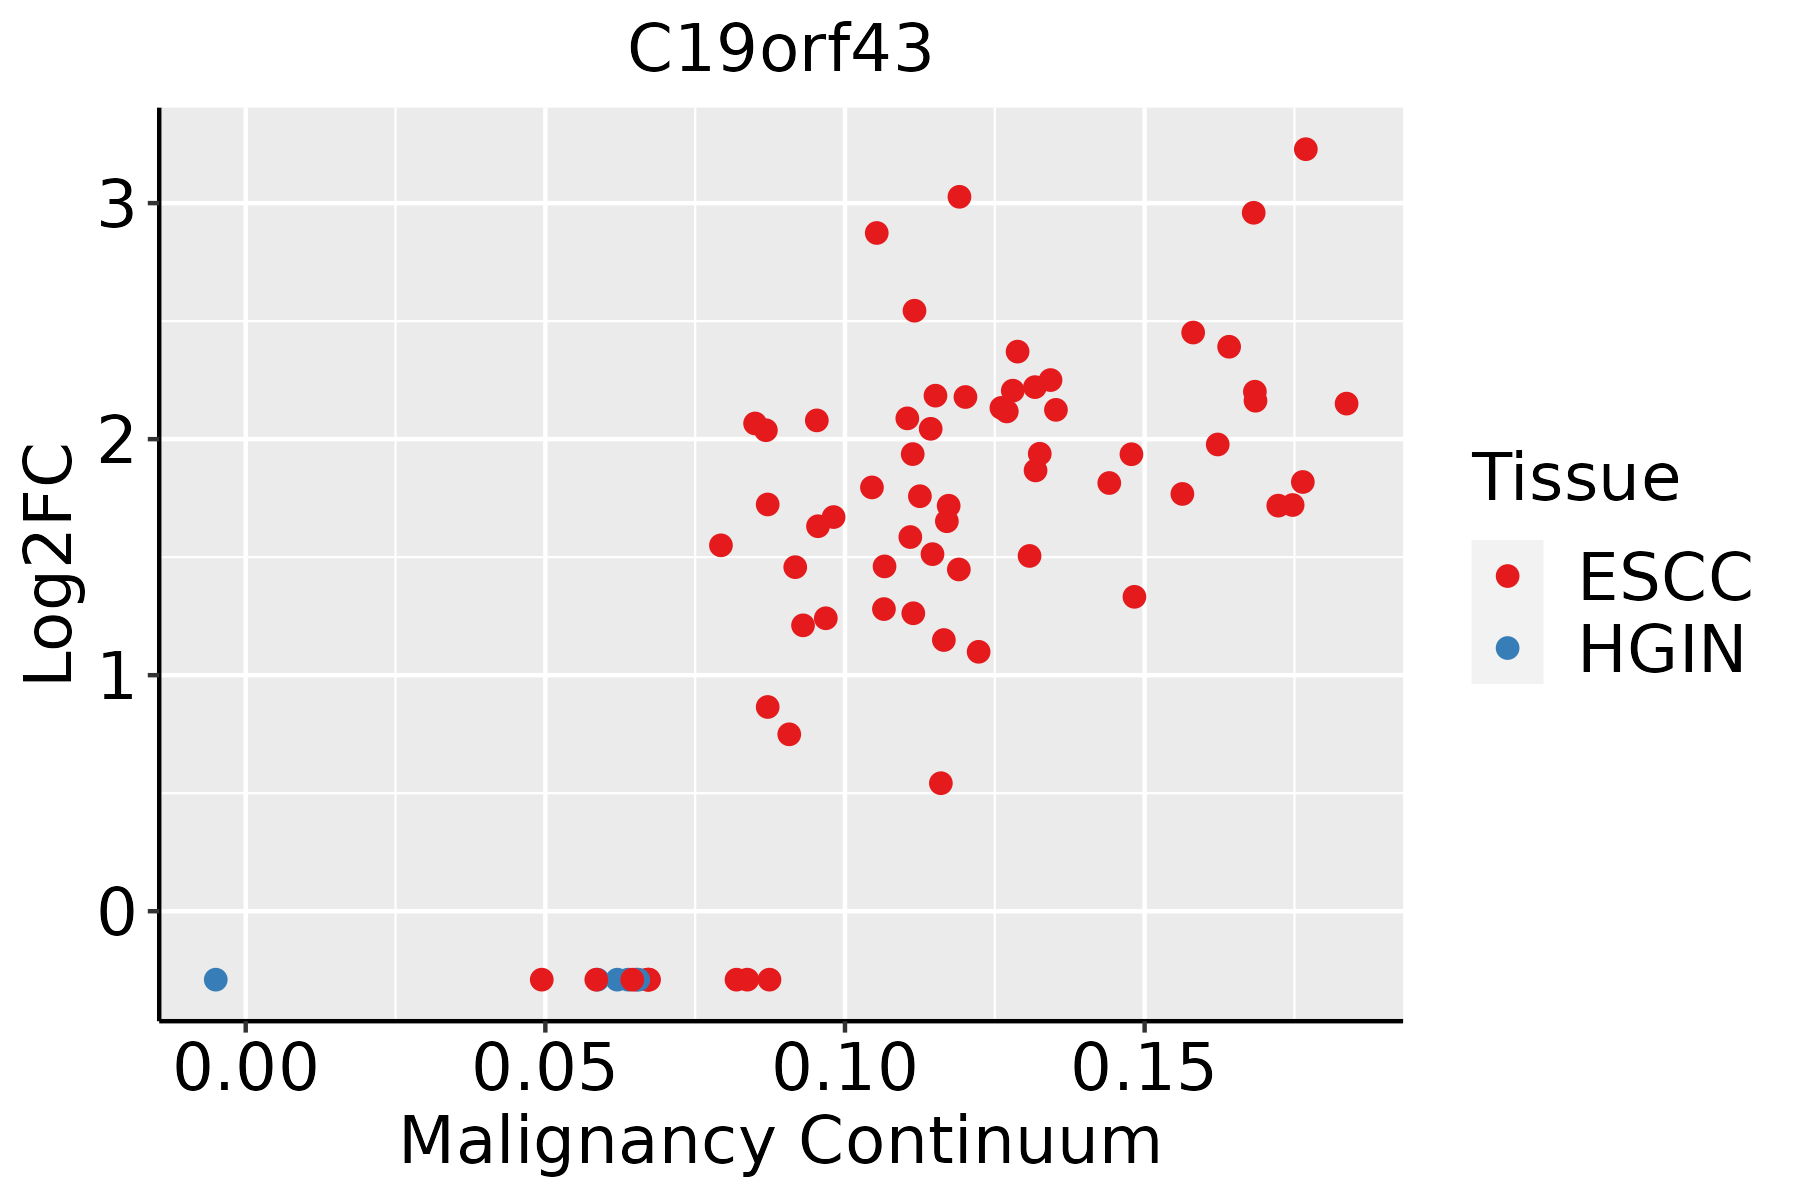 | ESCC: Esophageal squamous cell carcinoma |
| HGIN: High-grade intraepithelial neoplasias | ||
| LGIN: Low-grade intraepithelial neoplasias | ||
| Liver | 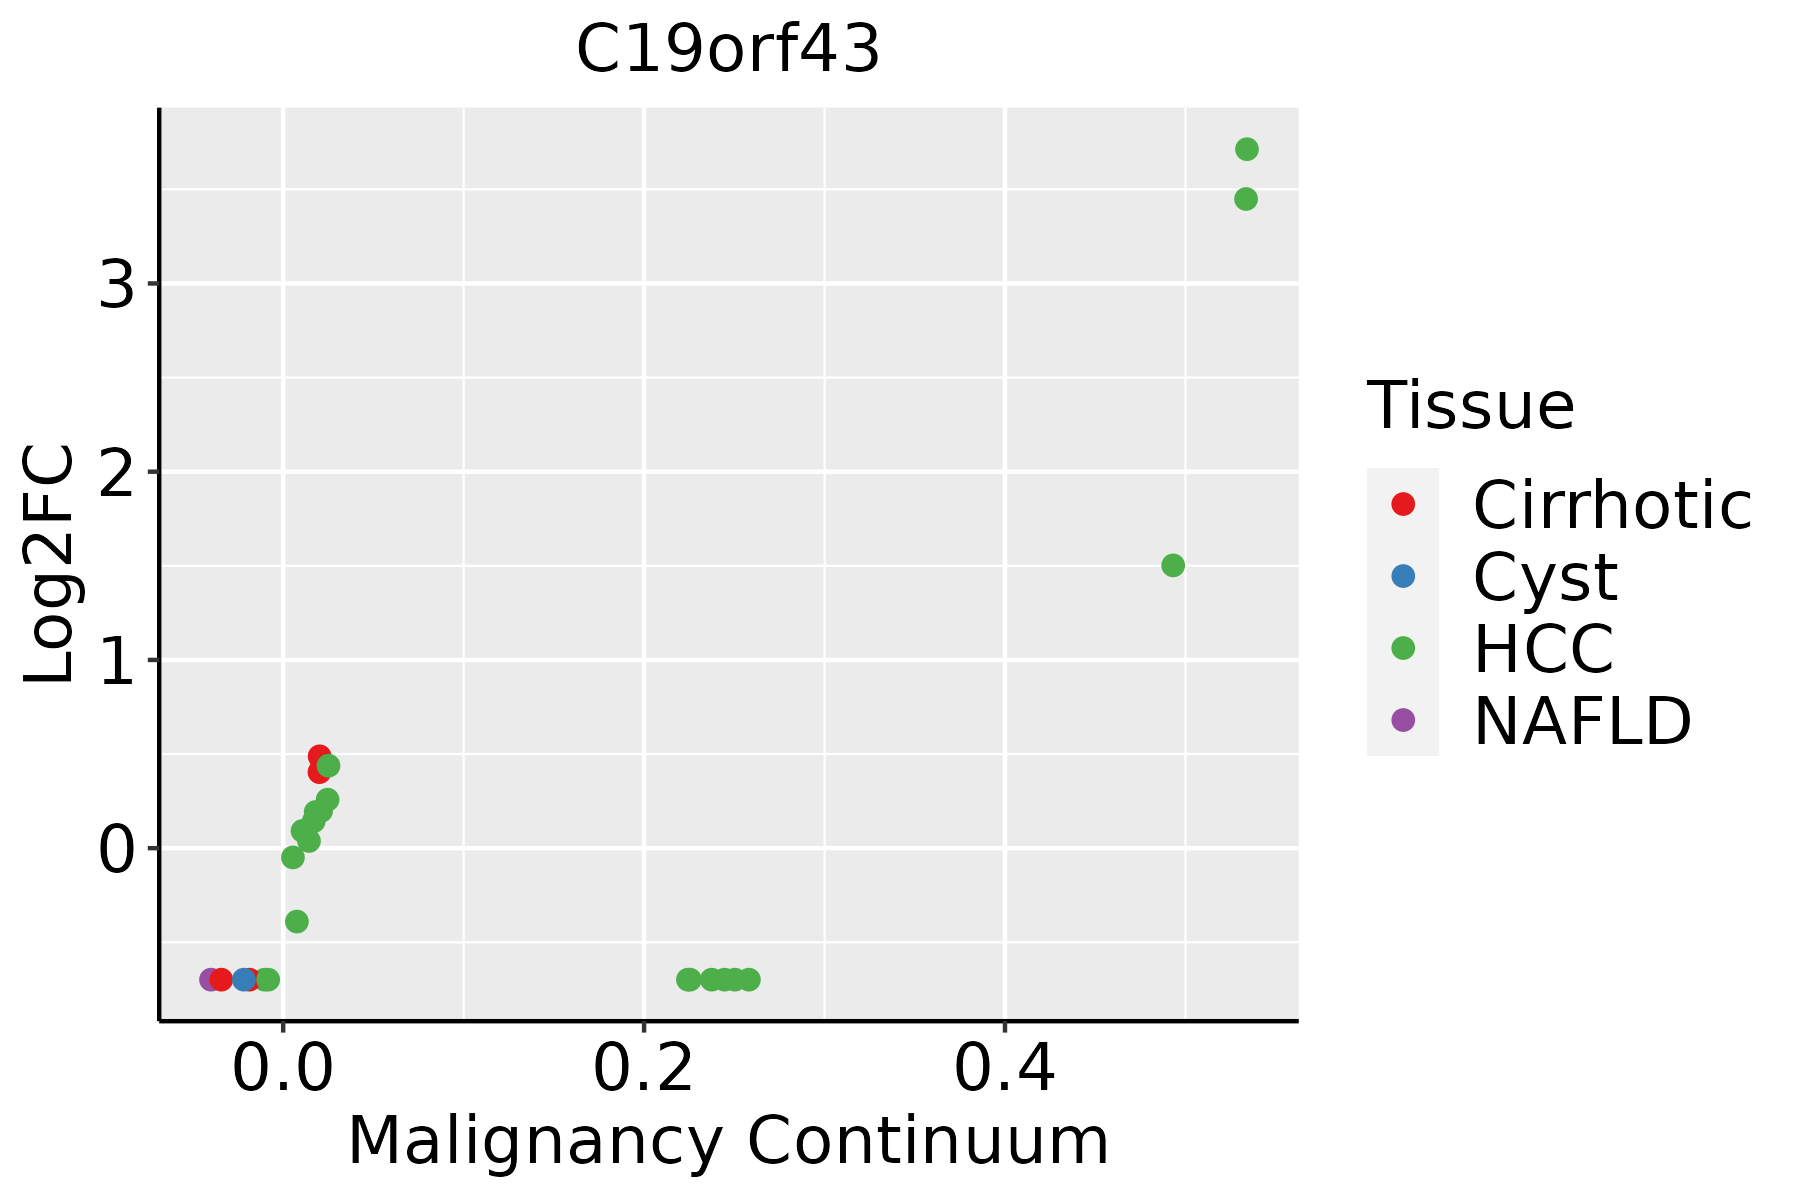 | HCC: Hepatocellular carcinoma |
| NAFLD: Non-alcoholic fatty liver disease | ||
| Oral Cavity |  | EOLP: Erosive Oral lichen planus |
| LP: leukoplakia | ||
| NEOLP: Non-erosive oral lichen planus | ||
| OSCC: Oral squamous cell carcinoma | ||
| Prostate | 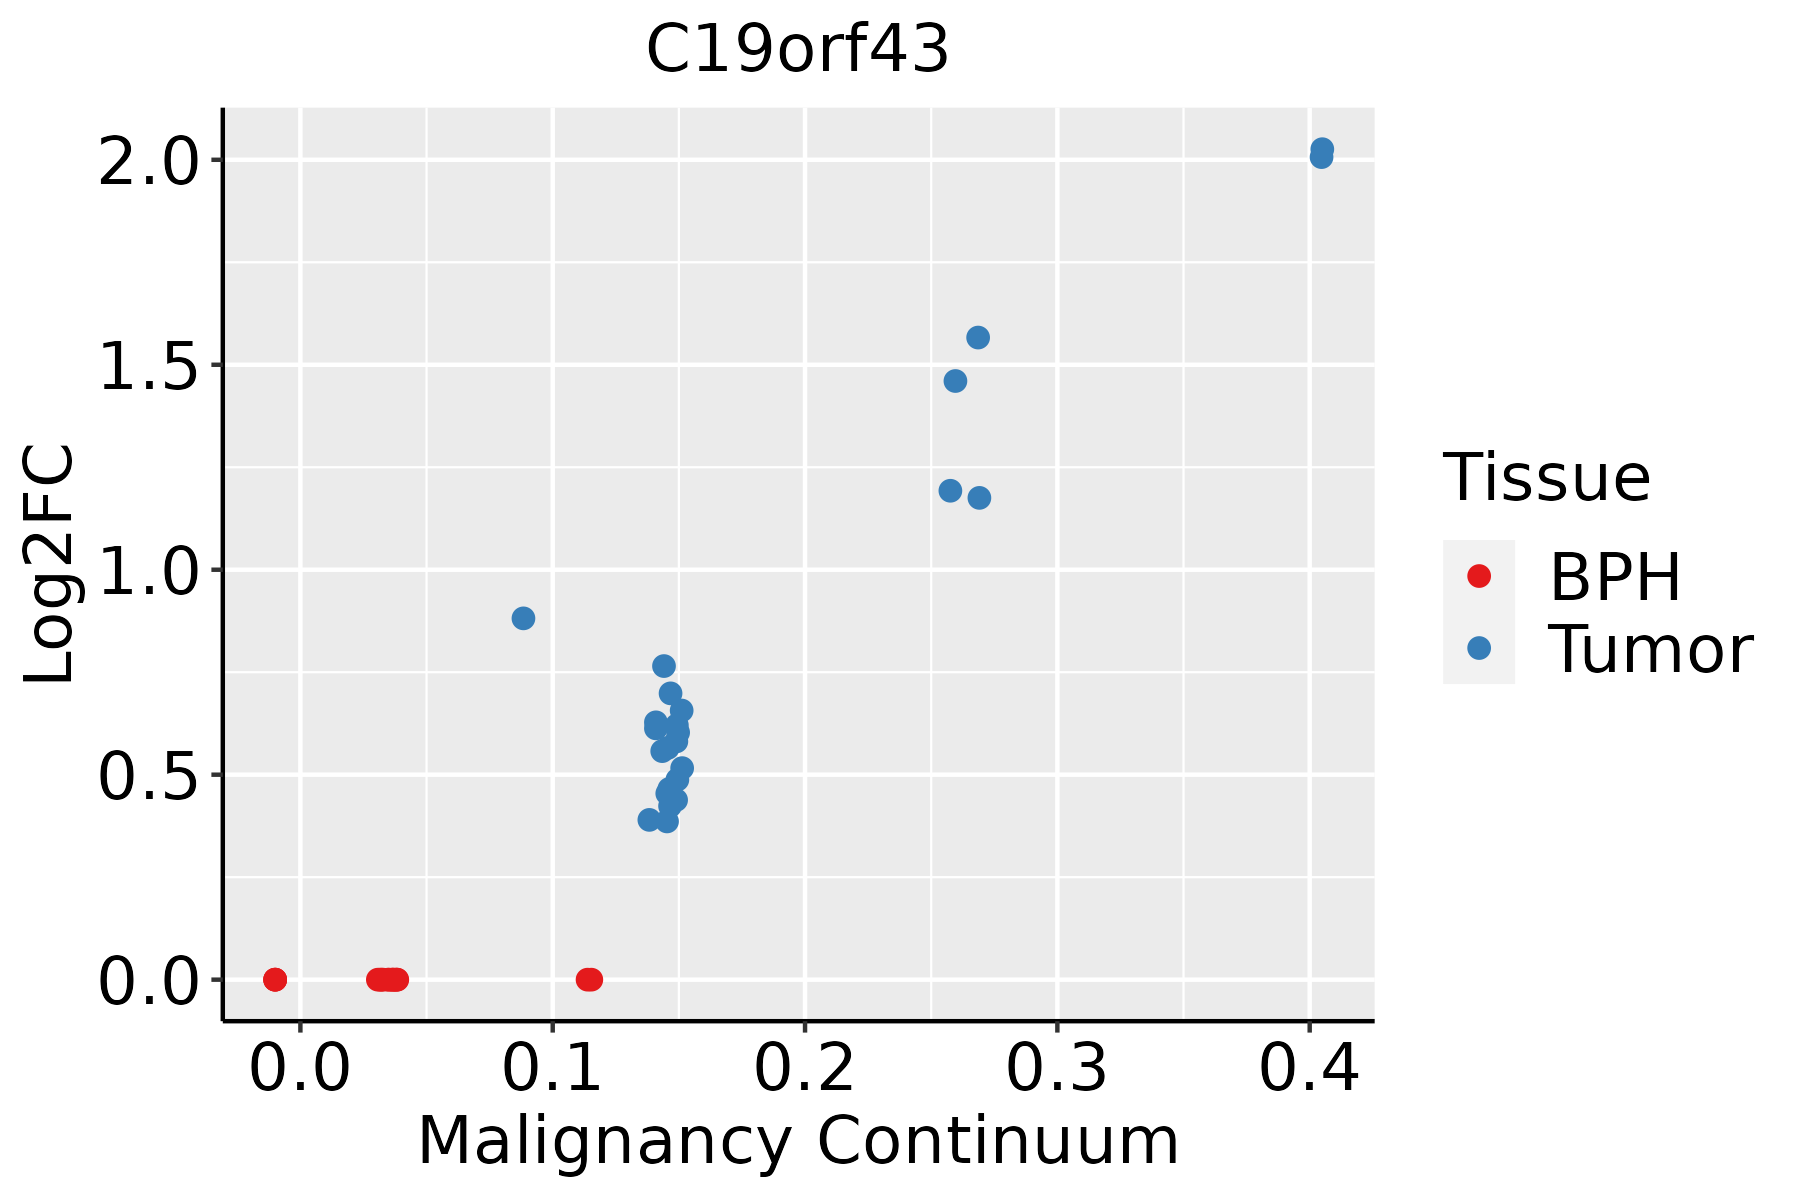 | BPH: Benign Prostatic Hyperplasia |
| Skin | 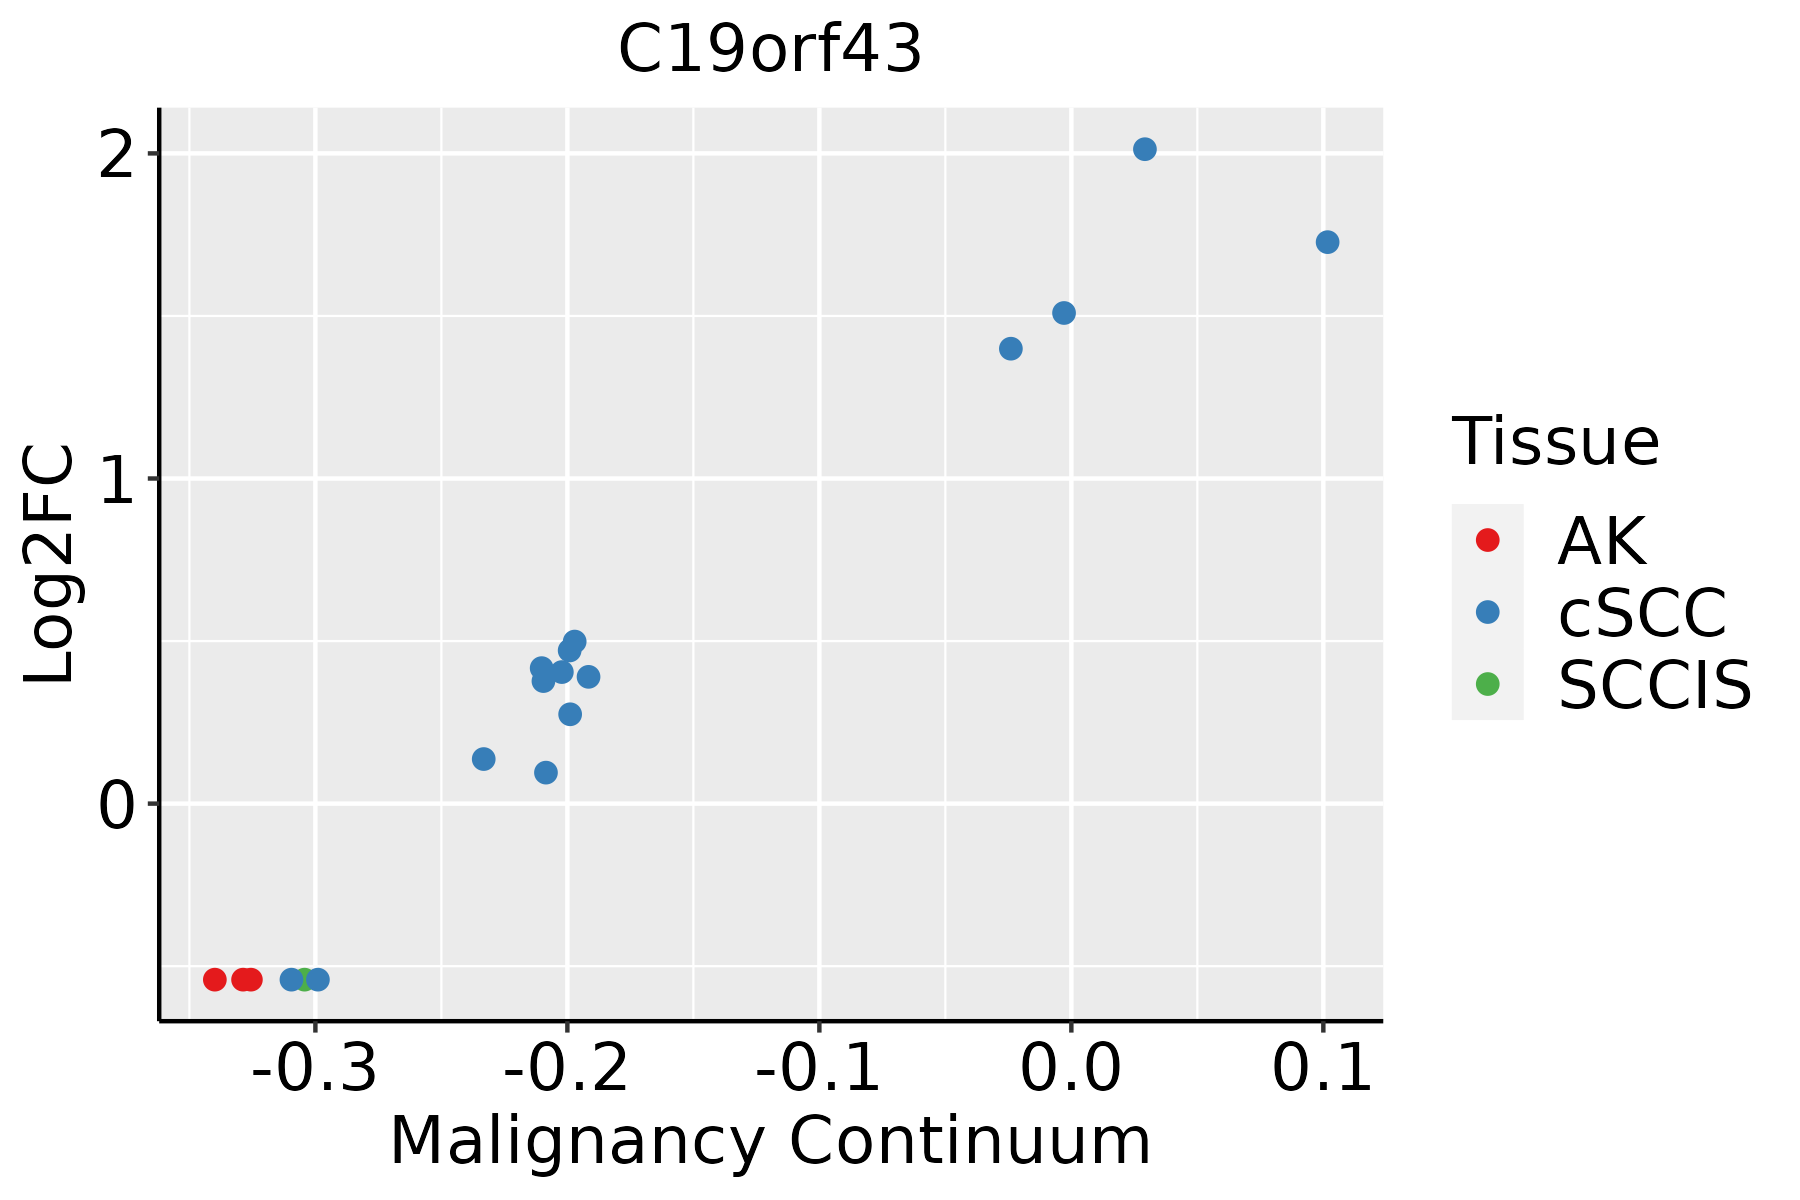 | AK: Actinic keratosis |
| cSCC: Cutaneous squamous cell carcinoma | ||
| SCCIS:squamous cell carcinoma in situ |
| ∗log2FC in expression of this searched gene in stem-like cells from each diseased tissue sample relative to stem-like cells in normal samples in each tissue plotted against the malignancy continuum. Samples are colored based on if they are from different disease stage. |
Top |
Malignant transformation related pathway analysis |
| Find out the enriched GO biological processes and KEGG pathways involved in transition from healthy to precancer to cancer |
| Tissue | Disease Stage | Enriched GO biological Processes |
| Colorectum | AD |  |
| Colorectum | SER |  |
| Colorectum | MSS |  |
| Colorectum | MSI-H |  |
| Colorectum | FAP |  |
| ∗Top 15 enriched GO BP terms are showed in the bar plot of each disease state in each tissue. Each row represents a significant GO biological process which is colored according to the -log10(p.adjust). |
| Page: 1 2 3 4 5 6 7 8 9 |
| GO ID | Tissue | Disease Stage | Description | Gene Ratio | Bg Ratio | pvalue | p.adjust | Count |
| Page: 1 |
| Pathway ID | Tissue | Disease Stage | Description | Gene Ratio | Bg Ratio | pvalue | p.adjust | qvalue | Count |
| Page: 1 |
Top |
Cell-cell communication analysis |
| Identification of potential cell-cell interactions between two cell types and their ligand-receptor pairs for different disease states |
| Ligand | Receptor | LRpair | Pathway | Tissue | Disease Stage |
| Page: 1 |
Top |
Single-cell gene regulatory network inference analysis |
| Find out the significant the regulons (TFs) and the target genes of each regulon across cell types for different disease states |
| TF | Cell Type | Tissue | Disease Stage | Target Gene | RSS | Regulon Activity |
| ∗The dot plots of a searched regulon are shown for all cell subpopulations in each disease state of each tissue based on the regulon specific score inferred using pySCENIC and by calculating the average expression. |
| Page: 1 |
Top |
Somatic mutation of malignant transformation related genes |
| Annotation of somatic variants for genes involved in malignant transformation |
| Hugo Symbol | Variant Class | Variant Classification | dbSNP RS | HGVSc | HGVSp | HGVSp Short | SWISSPROT | BIOTYPE | SIFT | PolyPhen | Tumor Sample Barcode | Tissue | Histology | Sex | Age | Stage | Therapy Types | Drugs | Outcome |
| C19orf43 | SNV | Missense_Mutation | c.442G>A | p.Asp148Asn | p.D148N | Q9BQ61 | protein_coding | deleterious(0.01) | probably_damaging(0.924) | TCGA-B6-A0RE-01 | Breast | breast invasive carcinoma | Female | <65 | I/II | Unknown | Unknown | SD | |
| C19orf43 | SNV | Missense_Mutation | c.466N>A | p.Glu156Lys | p.E156K | Q9BQ61 | protein_coding | deleterious(0) | probably_damaging(0.994) | TCGA-IR-A3LA-01 | Cervix | cervical & endocervical cancer | Female | <65 | I/II | Chemotherapy | cisplatin | CR | |
| C19orf43 | SNV | Missense_Mutation | c.362G>A | p.Gly121Asp | p.G121D | Q9BQ61 | protein_coding | deleterious(0) | probably_damaging(0.999) | TCGA-AA-3672-01 | Colorectum | colon adenocarcinoma | Female | >=65 | III/IV | Unknown | Unknown | SD | |
| C19orf43 | SNV | Missense_Mutation | c.463N>A | p.Ala155Thr | p.A155T | Q9BQ61 | protein_coding | deleterious(0.01) | probably_damaging(0.996) | TCGA-F4-6570-01 | Colorectum | colon adenocarcinoma | Female | >=65 | I/II | Unknown | Unknown | SD | |
| C19orf43 | SNV | Missense_Mutation | novel | c.445G>A | p.Ala149Thr | p.A149T | Q9BQ61 | protein_coding | deleterious(0.01) | benign(0.096) | TCGA-AJ-A3EK-01 | Endometrium | uterine corpus endometrioid carcinoma | Female | <65 | I/II | Chemotherapy | carboplatin | CR |
| C19orf43 | SNV | Missense_Mutation | c.505G>A | p.Asp169Asn | p.D169N | Q9BQ61 | protein_coding | tolerated(0.1) | possibly_damaging(0.58) | TCGA-AP-A0LF-01 | Endometrium | uterine corpus endometrioid carcinoma | Female | >=65 | III/IV | Unknown | Unknown | SD | |
| C19orf43 | SNV | Missense_Mutation | novel | c.397G>A | p.Ala133Thr | p.A133T | Q9BQ61 | protein_coding | deleterious(0.04) | benign(0.319) | TCGA-AP-A1DK-01 | Endometrium | uterine corpus endometrioid carcinoma | Female | <65 | I/II | Unknown | Unknown | SD |
| C19orf43 | SNV | Missense_Mutation | novel | c.474A>C | p.Lys158Asn | p.K158N | Q9BQ61 | protein_coding | tolerated(0.11) | possibly_damaging(0.662) | TCGA-BK-A6W3-01 | Endometrium | uterine corpus endometrioid carcinoma | Female | <65 | I/II | Unknown | Unknown | SD |
| C19orf43 | SNV | Missense_Mutation | c.505N>A | p.Asp169Asn | p.D169N | Q9BQ61 | protein_coding | tolerated(0.1) | possibly_damaging(0.58) | TCGA-E6-A1LZ-01 | Endometrium | uterine corpus endometrioid carcinoma | Female | >=65 | I/II | Chemotherapy | carboplatin | SD | |
| C19orf43 | SNV | Missense_Mutation | novel | c.436A>G | p.Lys146Glu | p.K146E | Q9BQ61 | protein_coding | tolerated(0.13) | probably_damaging(0.994) | TCGA-EO-A22U-01 | Endometrium | uterine corpus endometrioid carcinoma | Female | >=65 | I/II | Unknown | Unknown | SD |
| Page: 1 2 |
Top |
Related drugs of malignant transformation related genes |
| Identification of chemicals and drugs interact with genes involved in malignant transfromation |
| (DGIdb 4.0) |
| Entrez ID | Symbol | Category | Interaction Types | Drug Claim Name | Drug Name | PMIDs |
| Page: 1 |

Copyright 2023-Present -The University of Texas Health Science Center at Houston |