| Tissue | Expression Dynamics | Abbreviation |
| Colorectum (GSE201348) |  | FAP: Familial adenomatous polyposis |
| CRC: Colorectal cancer |
| Colorectum (HTA11) | 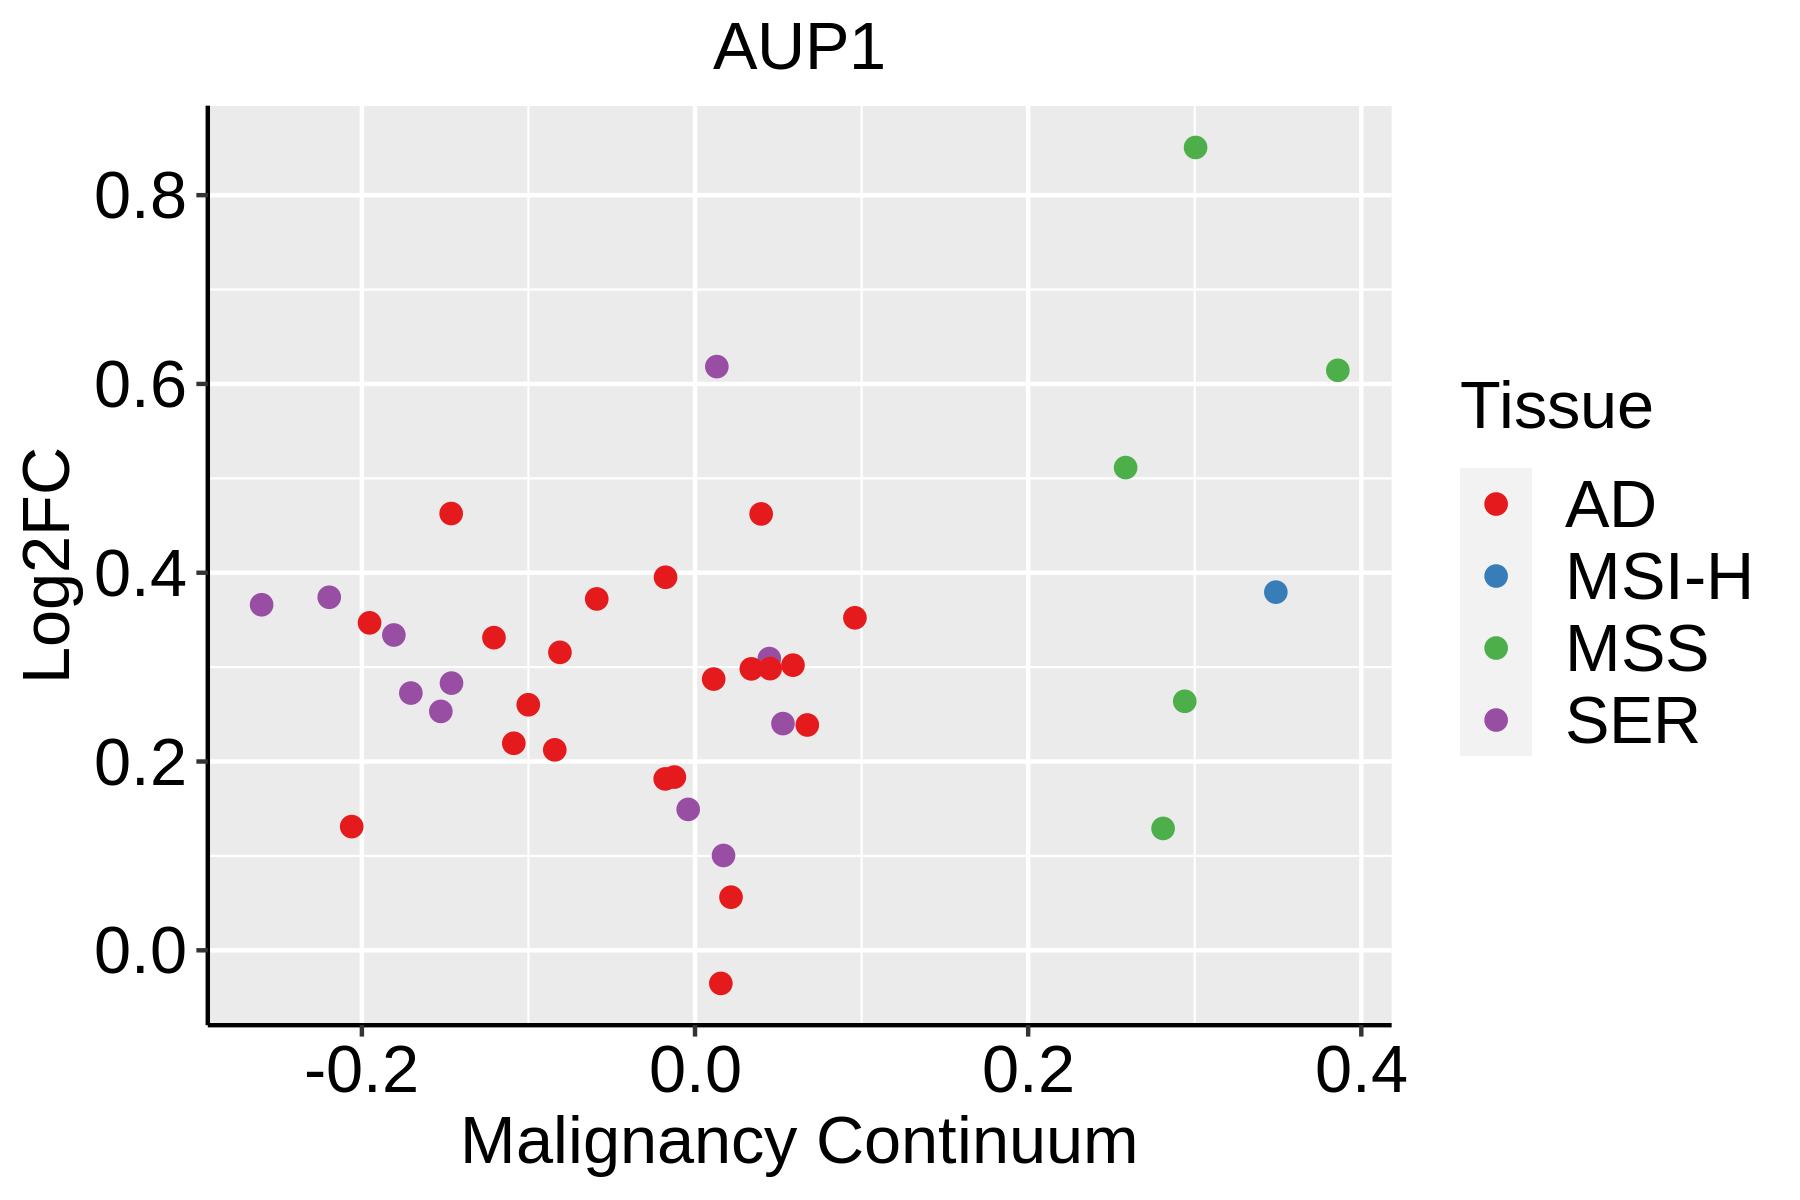 | AD: Adenomas |
| SER: Sessile serrated lesions |
| MSI-H: Microsatellite-high colorectal cancer |
| MSS: Microsatellite stable colorectal cancer |
| Esophagus | 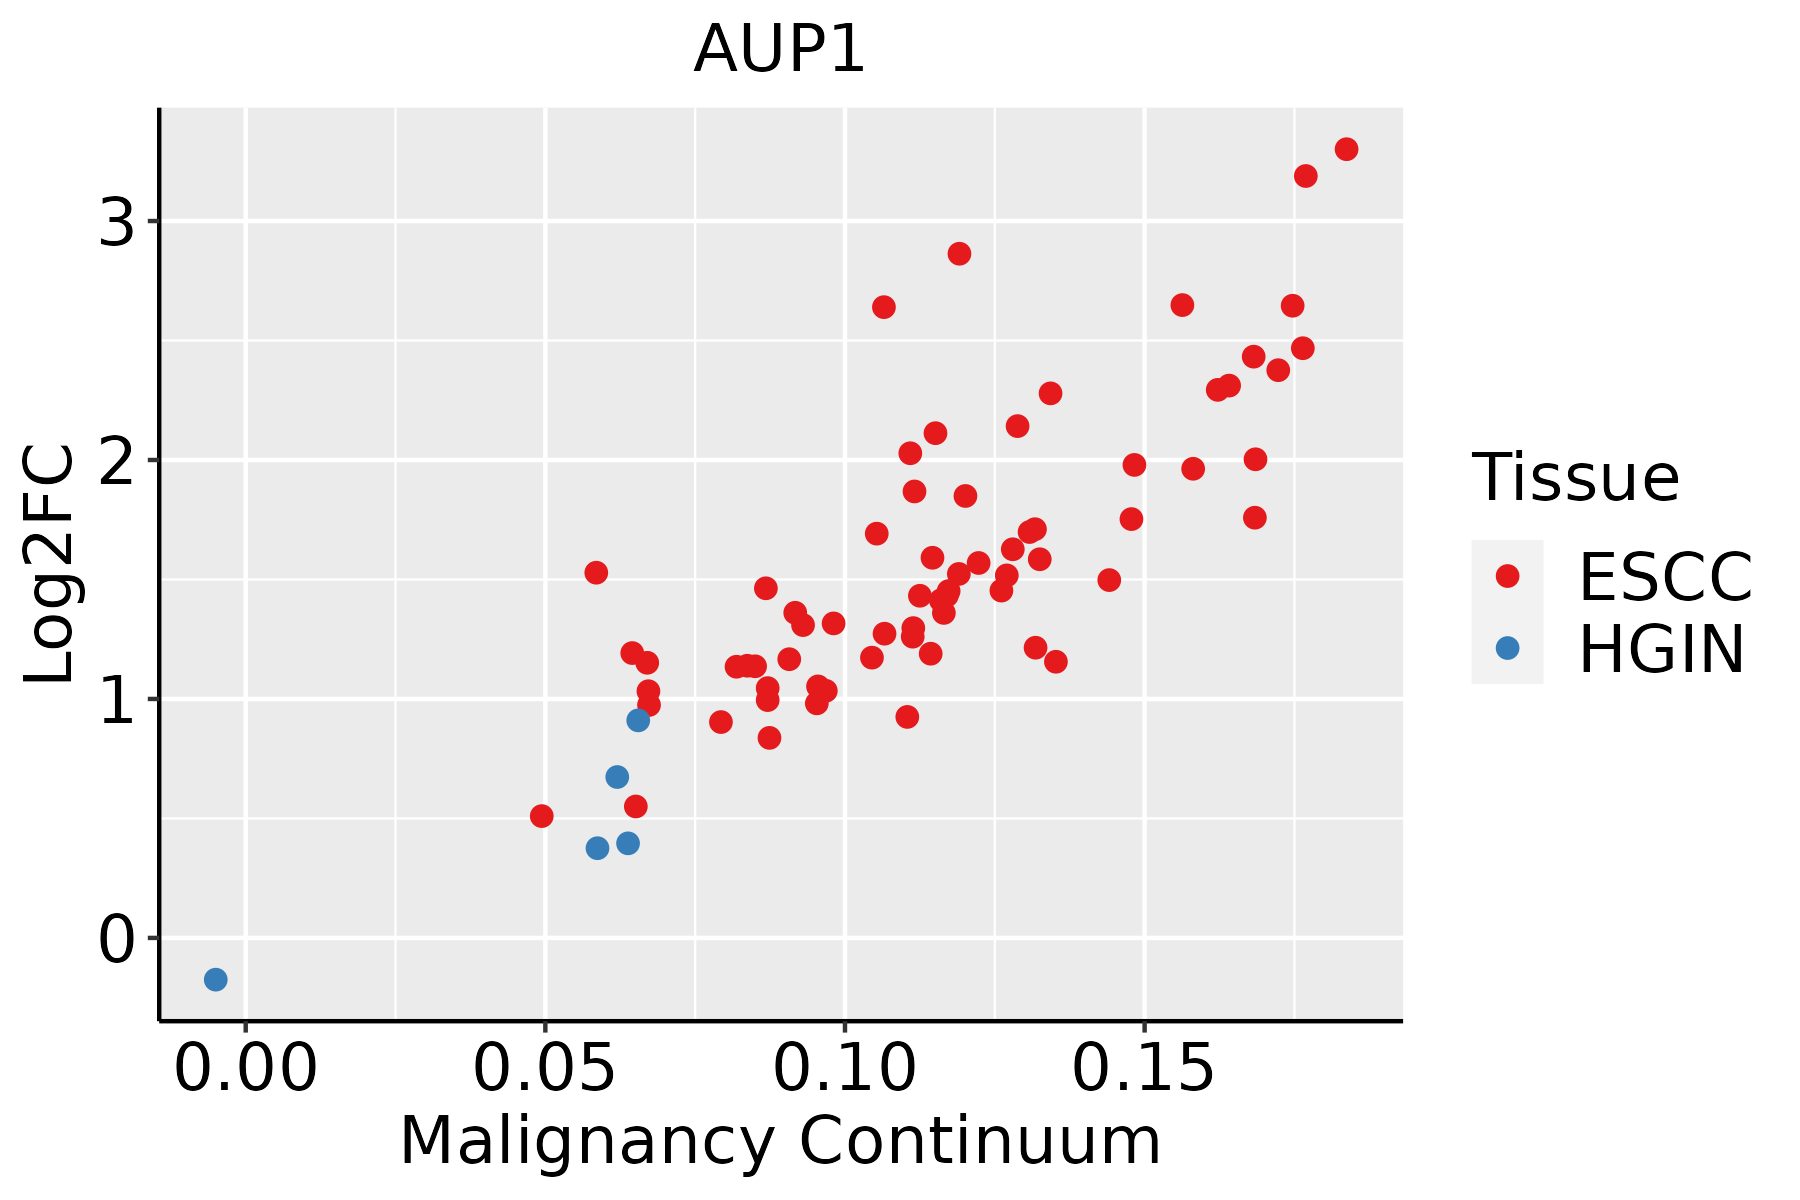 | ESCC: Esophageal squamous cell carcinoma |
| HGIN: High-grade intraepithelial neoplasias |
| LGIN: Low-grade intraepithelial neoplasias |
| Liver | 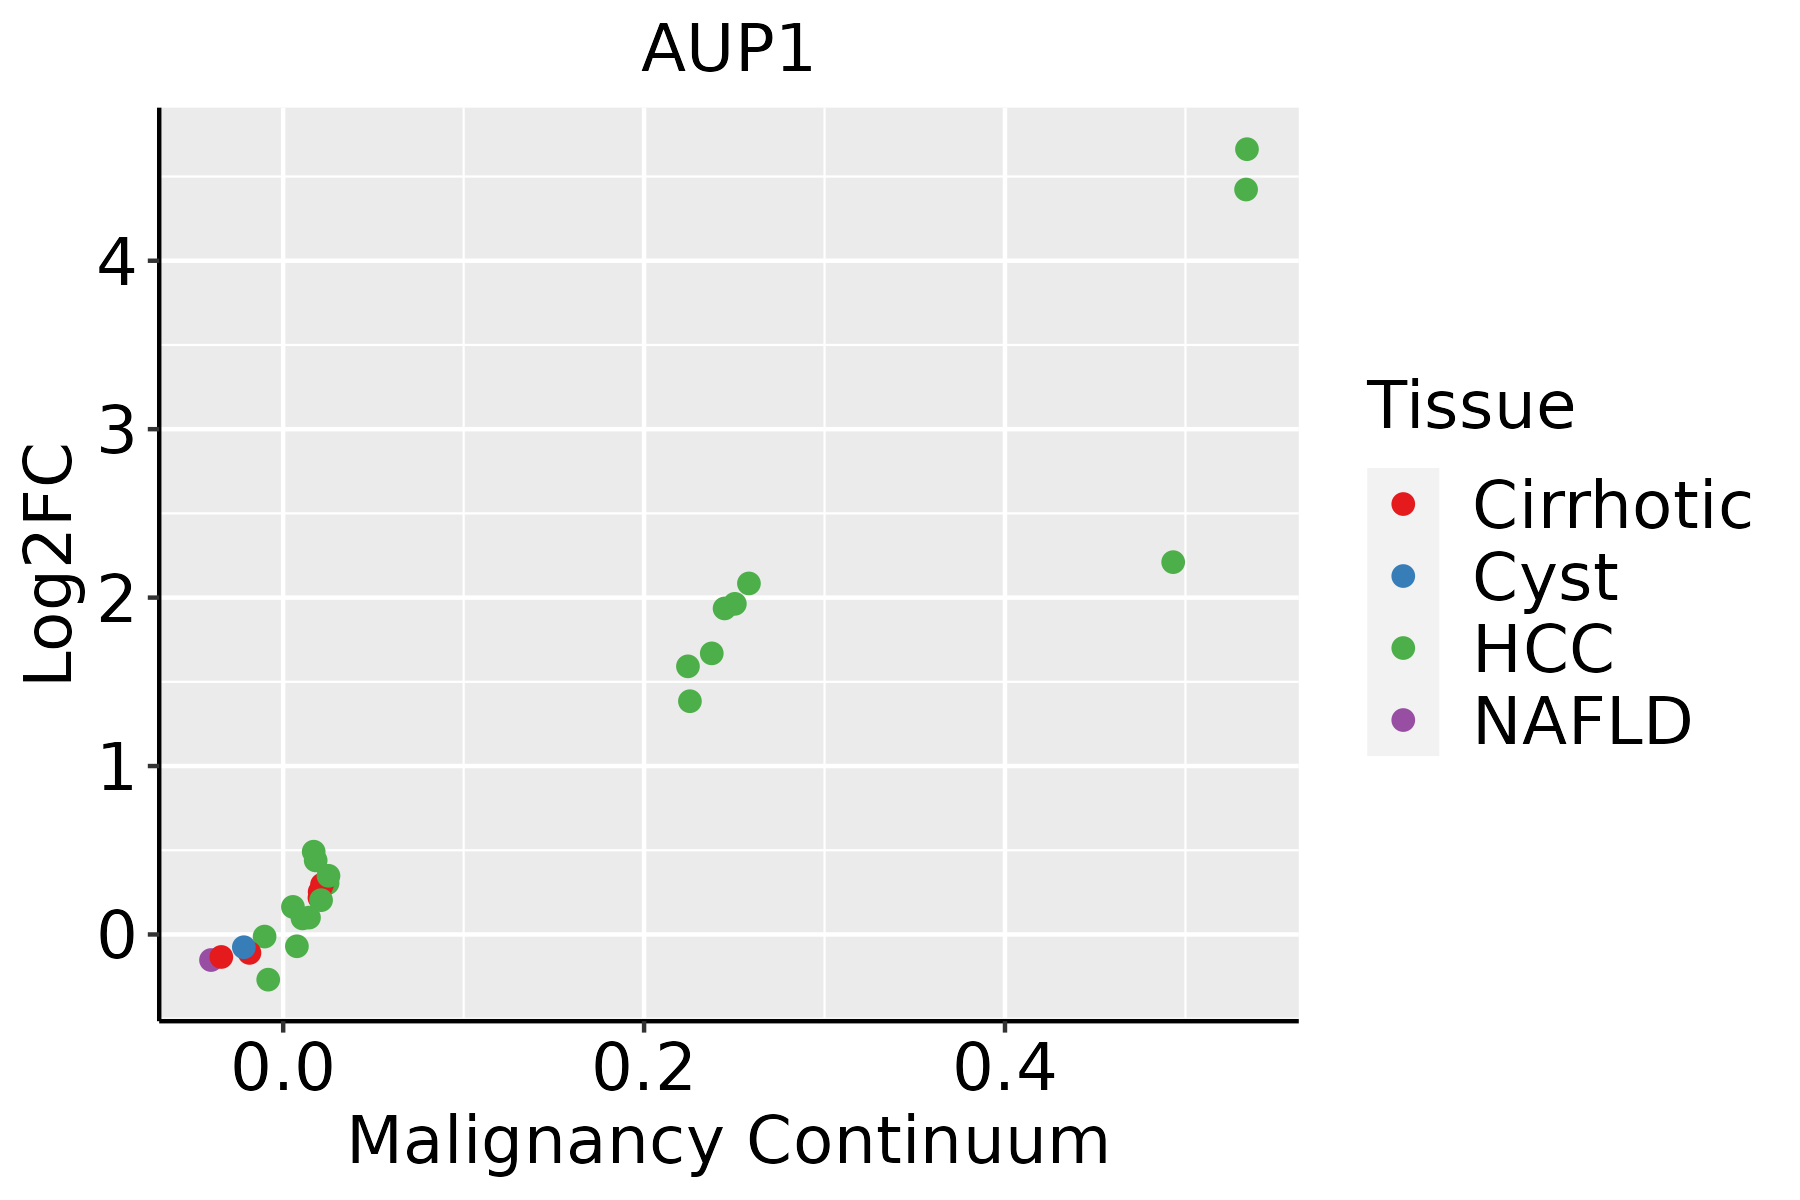 | HCC: Hepatocellular carcinoma |
| NAFLD: Non-alcoholic fatty liver disease |
| Oral Cavity | 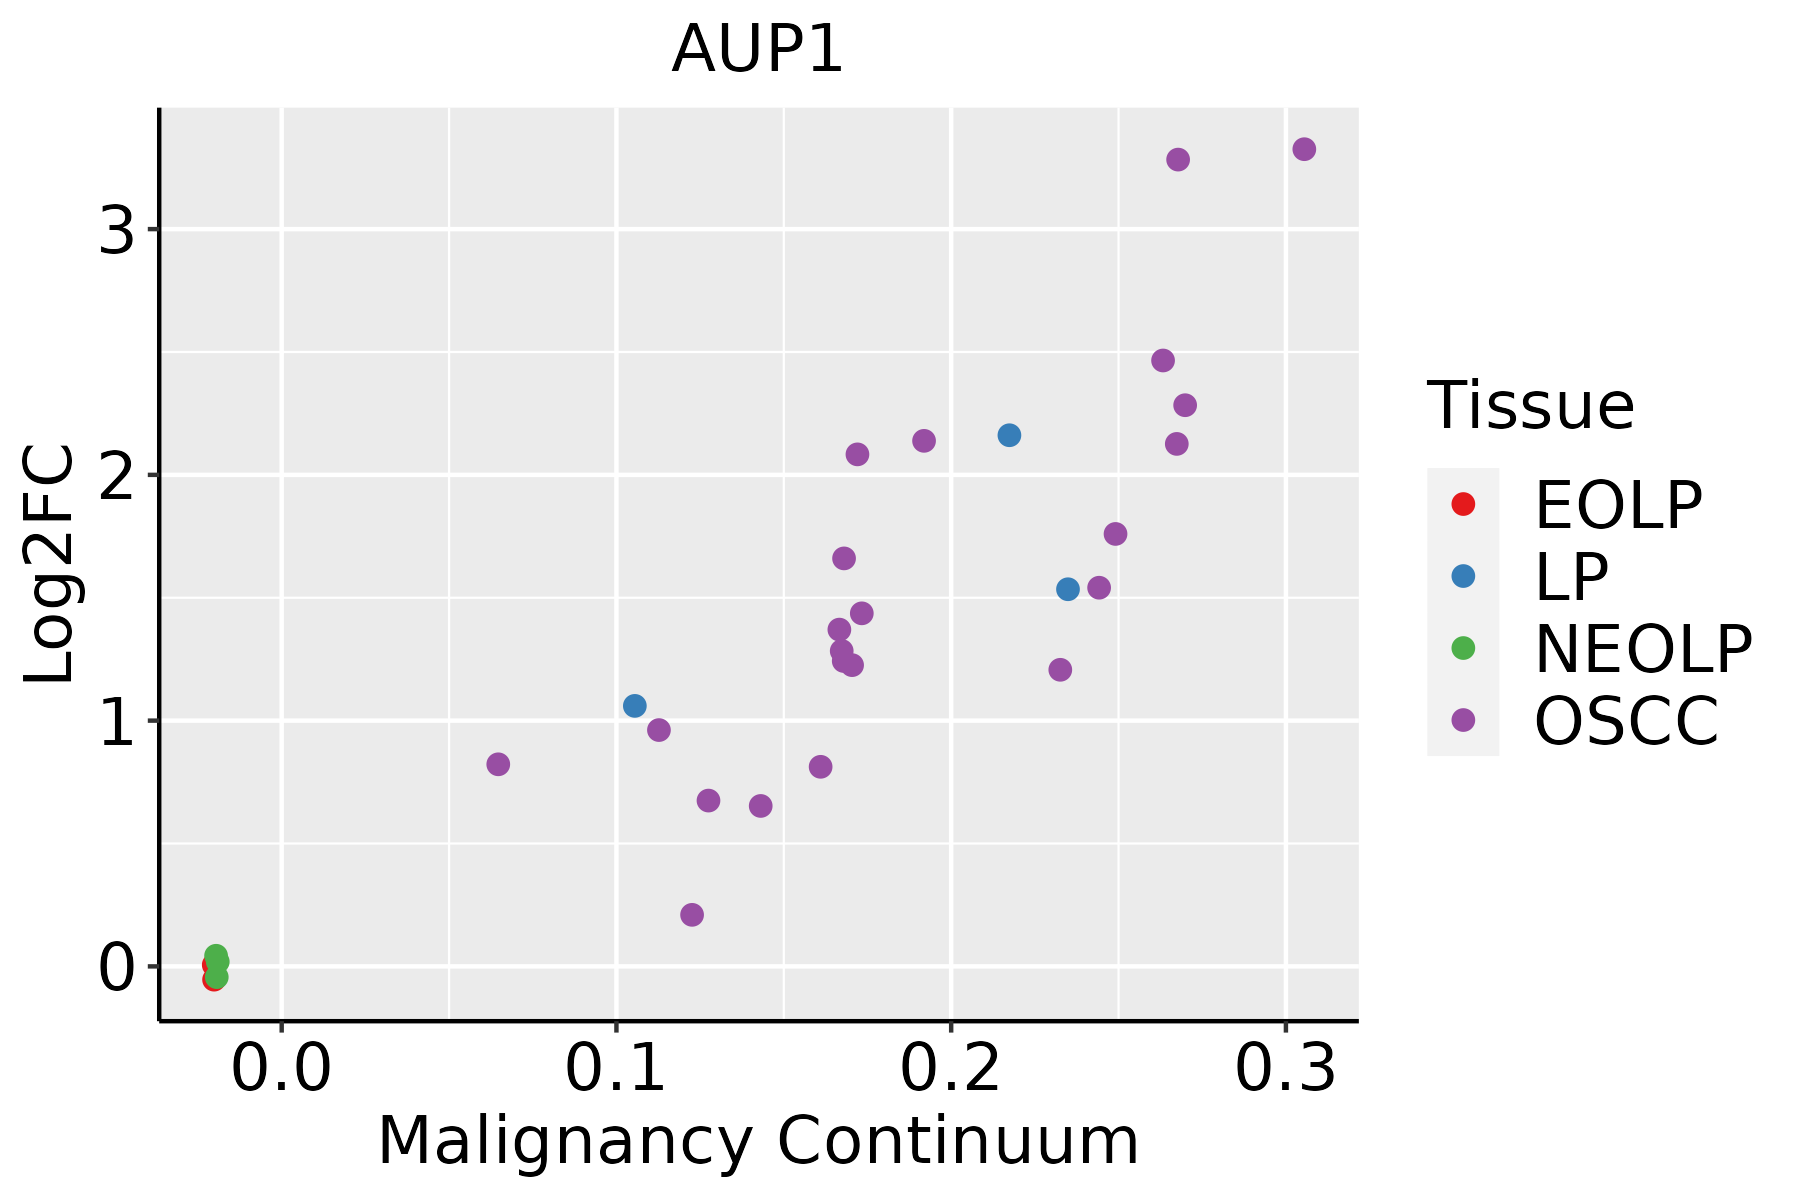 | EOLP: Erosive Oral lichen planus |
| LP: leukoplakia |
| NEOLP: Non-erosive oral lichen planus |
| OSCC: Oral squamous cell carcinoma |
| Skin | 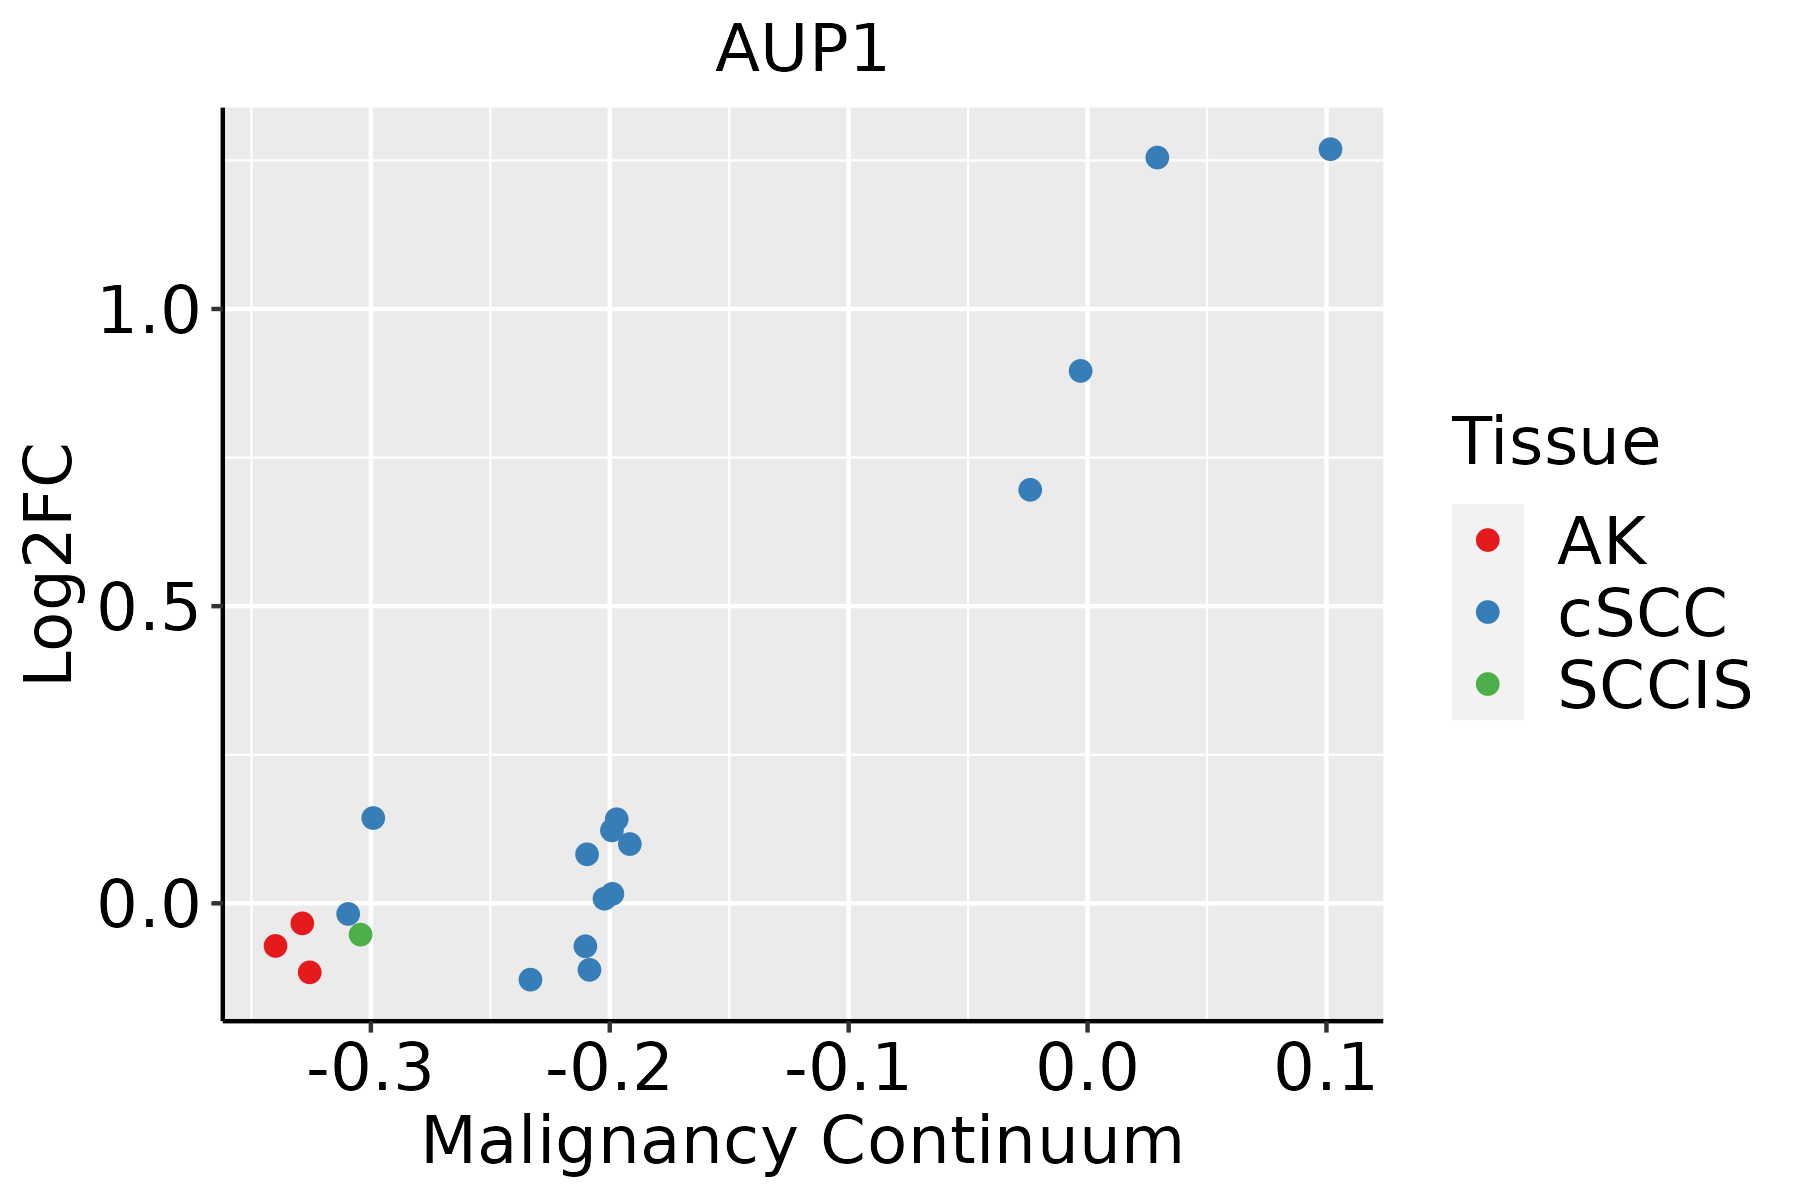 | AK: Actinic keratosis |
| cSCC: Cutaneous squamous cell carcinoma |
| SCCIS:squamous cell carcinoma in situ |
| Thyroid |  | ATC: Anaplastic thyroid cancer |
| HT: Hashimoto's thyroiditis |
| PTC: Papillary thyroid cancer |
| GO ID | Tissue | Disease Stage | Description | Gene Ratio | Bg Ratio | pvalue | p.adjust | Count |
| GO:0010498 | Colorectum | AD | proteasomal protein catabolic process | 174/3918 | 490/18723 | 3.18e-14 | 7.66e-12 | 174 |
| GO:0043161 | Colorectum | AD | proteasome-mediated ubiquitin-dependent protein catabolic process | 141/3918 | 412/18723 | 1.77e-10 | 1.68e-08 | 141 |
| GO:0016236 | Colorectum | AD | macroautophagy | 103/3918 | 291/18723 | 6.76e-09 | 4.15e-07 | 103 |
| GO:0034976 | Colorectum | AD | response to endoplasmic reticulum stress | 90/3918 | 256/18723 | 8.48e-08 | 4.28e-06 | 90 |
| GO:0061912 | Colorectum | AD | selective autophagy | 29/3918 | 68/18723 | 4.20e-05 | 7.39e-04 | 29 |
| GO:0035966 | Colorectum | AD | response to topologically incorrect protein | 54/3918 | 159/18723 | 8.85e-05 | 1.36e-03 | 54 |
| GO:0035967 | Colorectum | AD | cellular response to topologically incorrect protein | 42/3918 | 116/18723 | 1.04e-04 | 1.56e-03 | 42 |
| GO:0006515 | Colorectum | AD | protein quality control for misfolded or incompletely synthesized proteins | 14/3918 | 28/18723 | 6.01e-04 | 6.33e-03 | 14 |
| GO:0010876 | Colorectum | AD | lipid localization | 120/3918 | 448/18723 | 1.59e-03 | 1.33e-02 | 120 |
| GO:0071712 | Colorectum | AD | ER-associated misfolded protein catabolic process | 7/3918 | 12/18723 | 5.09e-03 | 3.38e-02 | 7 |
| GO:0036503 | Colorectum | AD | ERAD pathway | 34/3918 | 107/18723 | 5.57e-03 | 3.63e-02 | 34 |
| GO:00104981 | Colorectum | SER | proteasomal protein catabolic process | 132/2897 | 490/18723 | 3.08e-11 | 5.55e-09 | 132 |
| GO:00349761 | Colorectum | SER | response to endoplasmic reticulum stress | 74/2897 | 256/18723 | 3.01e-08 | 2.05e-06 | 74 |
| GO:00431611 | Colorectum | SER | proteasome-mediated ubiquitin-dependent protein catabolic process | 105/2897 | 412/18723 | 7.48e-08 | 4.70e-06 | 105 |
| GO:00162361 | Colorectum | SER | macroautophagy | 79/2897 | 291/18723 | 1.97e-07 | 1.10e-05 | 79 |
| GO:00359661 | Colorectum | SER | response to topologically incorrect protein | 46/2897 | 159/18723 | 1.14e-05 | 3.63e-04 | 46 |
| GO:00359671 | Colorectum | SER | cellular response to topologically incorrect protein | 36/2897 | 116/18723 | 1.88e-05 | 5.51e-04 | 36 |
| GO:00619121 | Colorectum | SER | selective autophagy | 24/2897 | 68/18723 | 4.60e-05 | 1.15e-03 | 24 |
| GO:00065151 | Colorectum | SER | protein quality control for misfolded or incompletely synthesized proteins | 12/2897 | 28/18723 | 4.92e-04 | 7.02e-03 | 12 |
| GO:0030970 | Colorectum | SER | retrograde protein transport, ER to cytosol | 12/2897 | 29/18723 | 7.22e-04 | 9.44e-03 | 12 |
| Hugo Symbol | Variant Class | Variant Classification | dbSNP RS | HGVSc | HGVSp | HGVSp Short | SWISSPROT | BIOTYPE | SIFT | PolyPhen | Tumor Sample Barcode | Tissue | Histology | Sex | Age | Stage | Therapy Types | Drugs | Outcome |
| AUP1 | SNV | Missense_Mutation | | c.1003N>C | p.Glu335Gln | p.E335Q | Q9Y679 | protein_coding | deleterious(0) | probably_damaging(0.998) | TCGA-A2-A0D0-01 | Breast | breast invasive carcinoma | Female | <65 | I/II | Chemotherapy | cytoxan | SD |
| AUP1 | SNV | Missense_Mutation | | c.340N>T | p.Pro114Ser | p.P114S | Q9Y679 | protein_coding | deleterious(0) | probably_damaging(0.999) | TCGA-A7-A13D-01 | Breast | breast invasive carcinoma | Female | <65 | I/II | Chemotherapy | cytoxan | SD |
| AUP1 | SNV | Missense_Mutation | novel | c.896C>T | p.Thr299Ile | p.T299I | Q9Y679 | protein_coding | tolerated(0.18) | benign(0) | TCGA-AO-A0JB-01 | Breast | breast invasive carcinoma | Female | <65 | III/IV | Chemotherapy | cyclophosphamide | SD |
| AUP1 | insertion | Frame_Shift_Ins | novel | c.704_705insGAATGGAATTATGGAGCTACTACGGCAAAGCCTGAATAATATC | p.Ala236AsnfsTer17 | p.A236Nfs*17 | Q9Y679 | protein_coding | | | TCGA-AN-A0FN-01 | Breast | breast invasive carcinoma | Female | <65 | I/II | Unknown | Unknown | SD |
| AUP1 | insertion | In_Frame_Ins | novel | c.897_898insTTTATATTTTTTGCCATGTTGCCC | p.Thr299_Leu300insPheIlePhePheAlaMetLeuPro | p.T299_L300insFIFFAMLP | Q9Y679 | protein_coding | | | TCGA-AO-A0JB-01 | Breast | breast invasive carcinoma | Female | <65 | III/IV | Chemotherapy | cyclophosphamide | SD |
| AUP1 | SNV | Missense_Mutation | novel | c.4G>A | p.Glu2Lys | p.E2K | Q9Y679 | protein_coding | deleterious_low_confidence(0.02) | benign(0.001) | TCGA-2W-A8YY-01 | Cervix | cervical & endocervical cancer | Female | <65 | I/II | Chemotherapy | cisplatin | CR |
| AUP1 | SNV | Missense_Mutation | rs755973491 | c.679N>T | p.Arg227Cys | p.R227C | Q9Y679 | protein_coding | deleterious(0) | benign(0.292) | TCGA-FU-A3HZ-01 | Cervix | cervical & endocervical cancer | Female | <65 | I/II | Chemotherapy | cisplatin | CR |
| AUP1 | SNV | Missense_Mutation | | c.40N>C | p.Asp14His | p.D14H | Q9Y679 | protein_coding | tolerated(0.14) | probably_damaging(0.971) | TCGA-JX-A3Q0-01 | Cervix | cervical & endocervical cancer | Female | <65 | III/IV | Unknown | Unknown | SD |
| AUP1 | SNV | Missense_Mutation | novel | c.43N>C | p.Ser15Pro | p.S15P | Q9Y679 | protein_coding | tolerated(0.21) | possibly_damaging(0.736) | TCGA-5M-AAT5-01 | Colorectum | colon adenocarcinoma | Unknown | Unknown | I/II | Unknown | Unknown | Unknown |
| AUP1 | SNV | Missense_Mutation | rs746000640 | c.1145N>A | p.Arg382Gln | p.R382Q | Q9Y679 | protein_coding | deleterious(0) | probably_damaging(0.997) | TCGA-AZ-6601-01 | Colorectum | colon adenocarcinoma | Male | >=65 | I/II | Unknown | Unknown | PD |


