
|
|||||
|
 | |
| |
| |
| |
| |
| |
|
Gene: ARL4A |
Gene summary for ARL4A |
| Gene information | Species | Human | Gene symbol | ARL4A | Gene ID | 10124 |
| Gene name | ADP ribosylation factor like GTPase 4A | |
| Gene Alias | ARL4 | |
| Cytomap | 7p21.3 | |
| Gene Type | protein-coding | GO ID | GO:0006810 | UniProtAcc | A0A024R9Z2 |
Top |
Malignant transformation analysis |
| Identification of the aberrant gene expression in precancerous and cancerous lesions by comparing the gene expression of stem-like cells in diseased tissues with normal stem cells |
| Entrez ID | Symbol | Replicates | Species | Organ | Tissue | Adj P-value | Log2FC | Malignancy |
| 10124 | ARL4A | LN46 | Human | Oral cavity | OSCC | 8.04e-07 | 9.18e-01 | 0.1666 |
| 10124 | ARL4A | LP15 | Human | Oral cavity | LP | 7.75e-05 | 1.33e+00 | 0.2174 |
| 10124 | ARL4A | LP17 | Human | Oral cavity | LP | 1.04e-03 | 7.73e-01 | 0.2349 |
| 10124 | ARL4A | SYSMH1 | Human | Oral cavity | OSCC | 1.11e-10 | 4.59e-01 | 0.1127 |
| 10124 | ARL4A | SYSMH2 | Human | Oral cavity | OSCC | 9.97e-05 | 4.98e-01 | 0.2326 |
| 10124 | ARL4A | SYSMH3 | Human | Oral cavity | OSCC | 1.15e-04 | 2.11e-01 | 0.2442 |
| 10124 | ARL4A | SYSMH4 | Human | Oral cavity | OSCC | 3.23e-04 | 4.33e-01 | 0.1226 |
| 10124 | ARL4A | SYSMH6 | Human | Oral cavity | OSCC | 4.76e-11 | 6.46e-01 | 0.1275 |
| 10124 | ARL4A | P4_S8_cSCC | Human | Skin | cSCC | 3.82e-03 | 1.94e-01 | -0.3095 |
| 10124 | ARL4A | P5_S10_cSCC | Human | Skin | cSCC | 2.86e-30 | 5.15e-01 | -0.299 |
| 10124 | ARL4A | P1_cSCC | Human | Skin | cSCC | 1.26e-06 | 5.74e-01 | 0.0292 |
| 10124 | ARL4A | P2_cSCC | Human | Skin | cSCC | 5.75e-15 | 7.09e-01 | -0.024 |
| 10124 | ARL4A | P4_cSCC | Human | Skin | cSCC | 4.93e-21 | 7.78e-01 | -0.00290000000000005 |
| 10124 | ARL4A | P10_cSCC | Human | Skin | cSCC | 6.32e-16 | 9.05e-01 | 0.1017 |
| 10124 | ARL4A | cSCC_p1 | Human | Skin | cSCC | 7.51e-11 | 4.60e-01 | -0.1916 |
| 10124 | ARL4A | cSCC_p10 | Human | Skin | cSCC | 3.68e-06 | 3.29e-01 | -0.2095 |
| 10124 | ARL4A | cSCC_p4 | Human | Skin | cSCC | 2.55e-04 | 1.95e-02 | -0.2022 |
| 10124 | ARL4A | cSCC_p7 | Human | Skin | cSCC | 6.77e-05 | -3.09e-01 | -0.2332 |
| 10124 | ARL4A | cSCC_p8 | Human | Skin | cSCC | 1.86e-07 | 2.08e-01 | -0.1971 |
| 10124 | ARL4A | cSCC_p9 | Human | Skin | cSCC | 1.75e-13 | 2.97e-01 | -0.1991 |
| Page: 1 2 3 4 5 6 7 8 |
| Tissue | Expression Dynamics | Abbreviation |
| Breast |  | IDC: Invasive ductal carcinoma |
| DCIS: Ductal carcinoma in situ | ||
| Precancer(BRCA1-mut): Precancerous lesion from BRCA1 mutation carriers | ||
| Cervix | 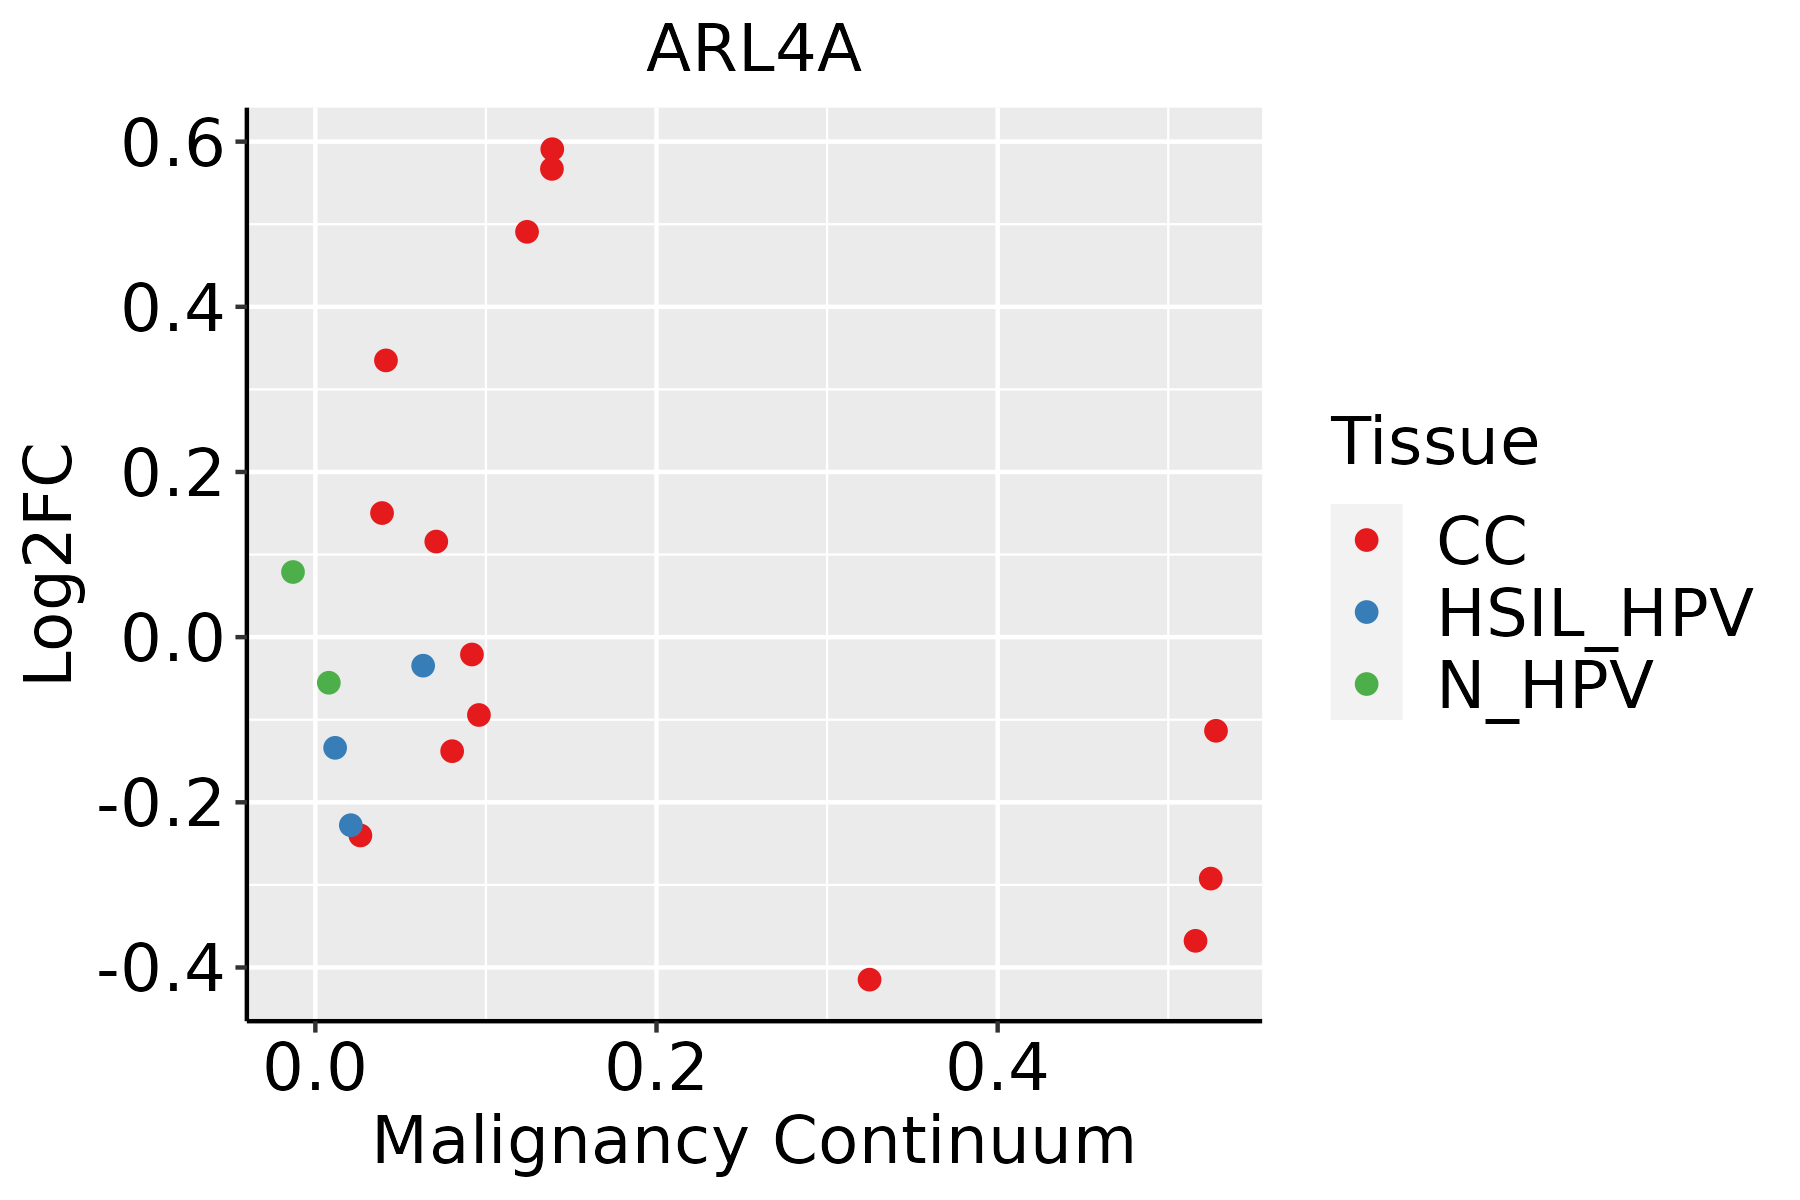 | CC: Cervix cancer |
| HSIL_HPV: HPV-infected high-grade squamous intraepithelial lesions | ||
| N_HPV: HPV-infected normal cervix | ||
| Esophagus | 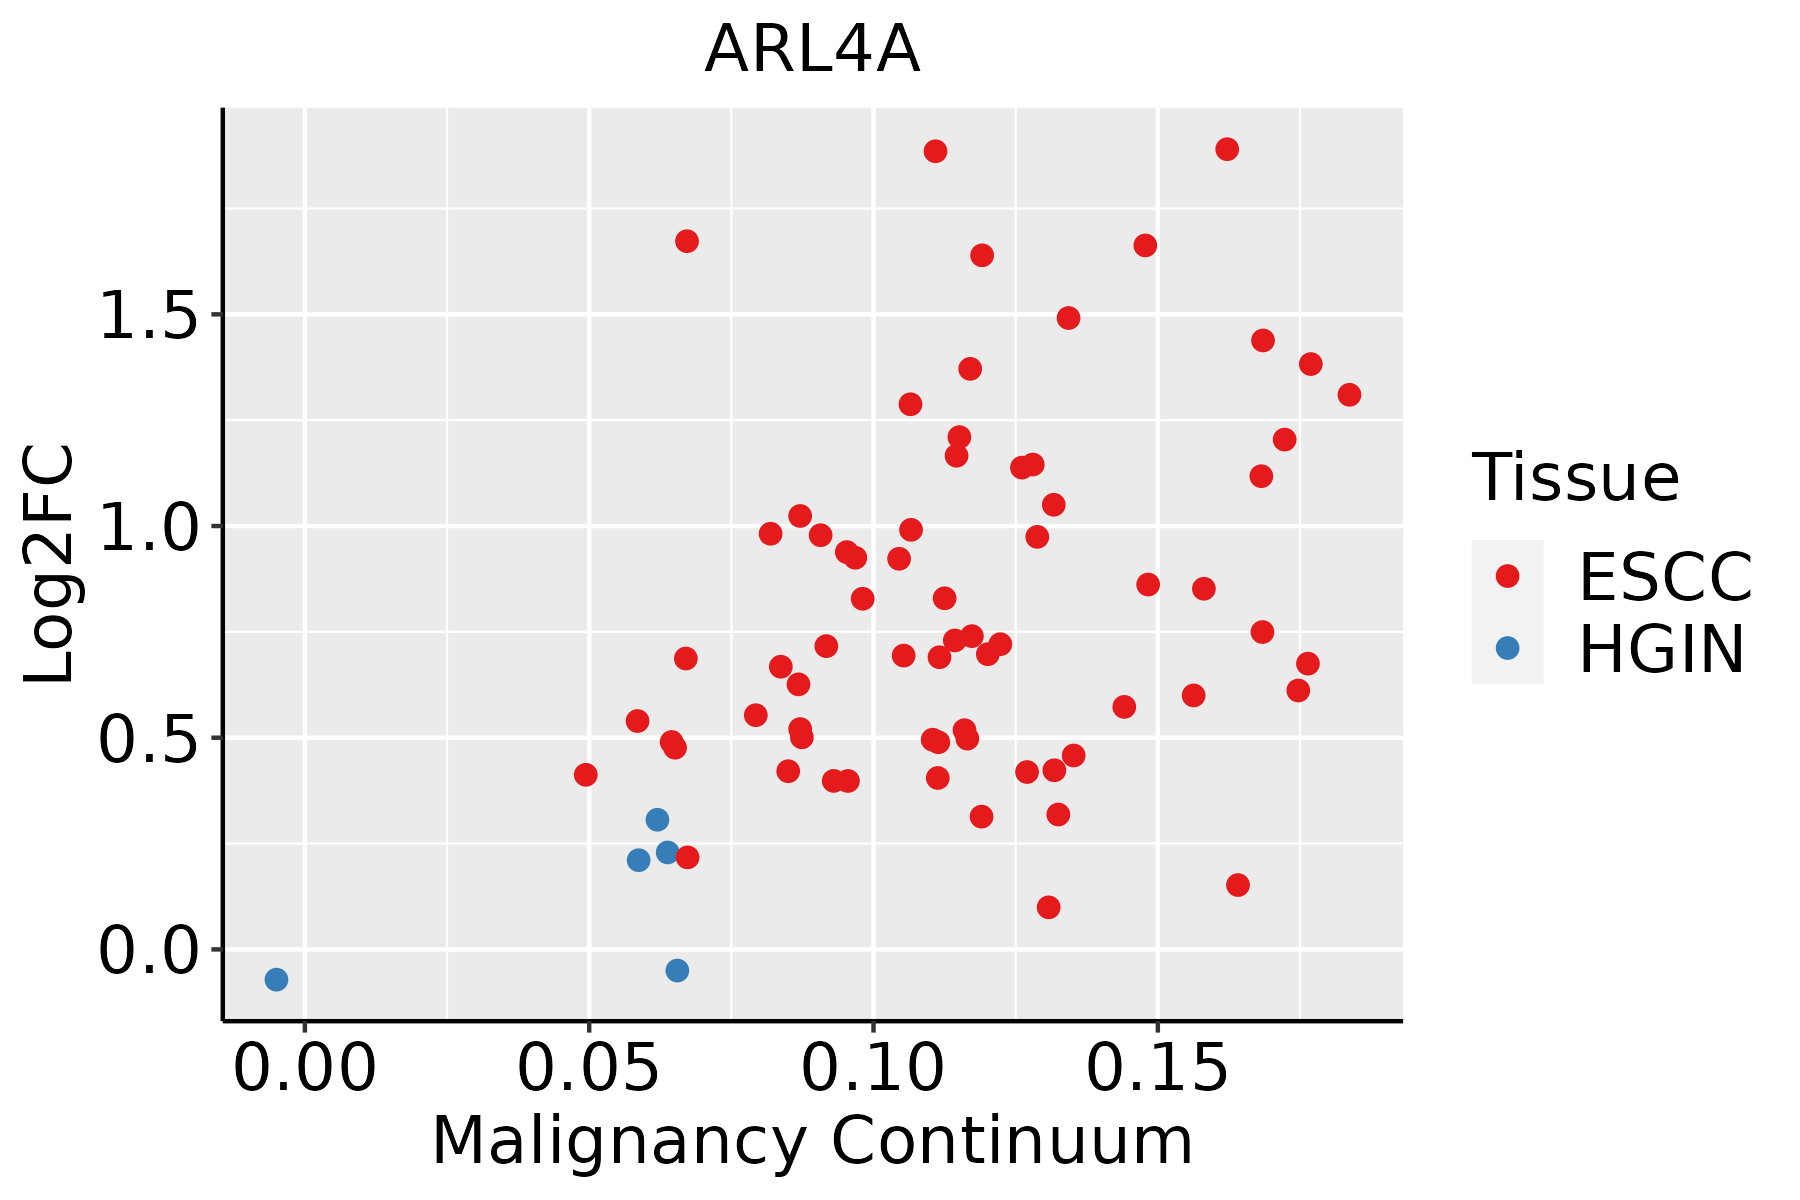 | ESCC: Esophageal squamous cell carcinoma |
| HGIN: High-grade intraepithelial neoplasias | ||
| LGIN: Low-grade intraepithelial neoplasias | ||
| Liver | 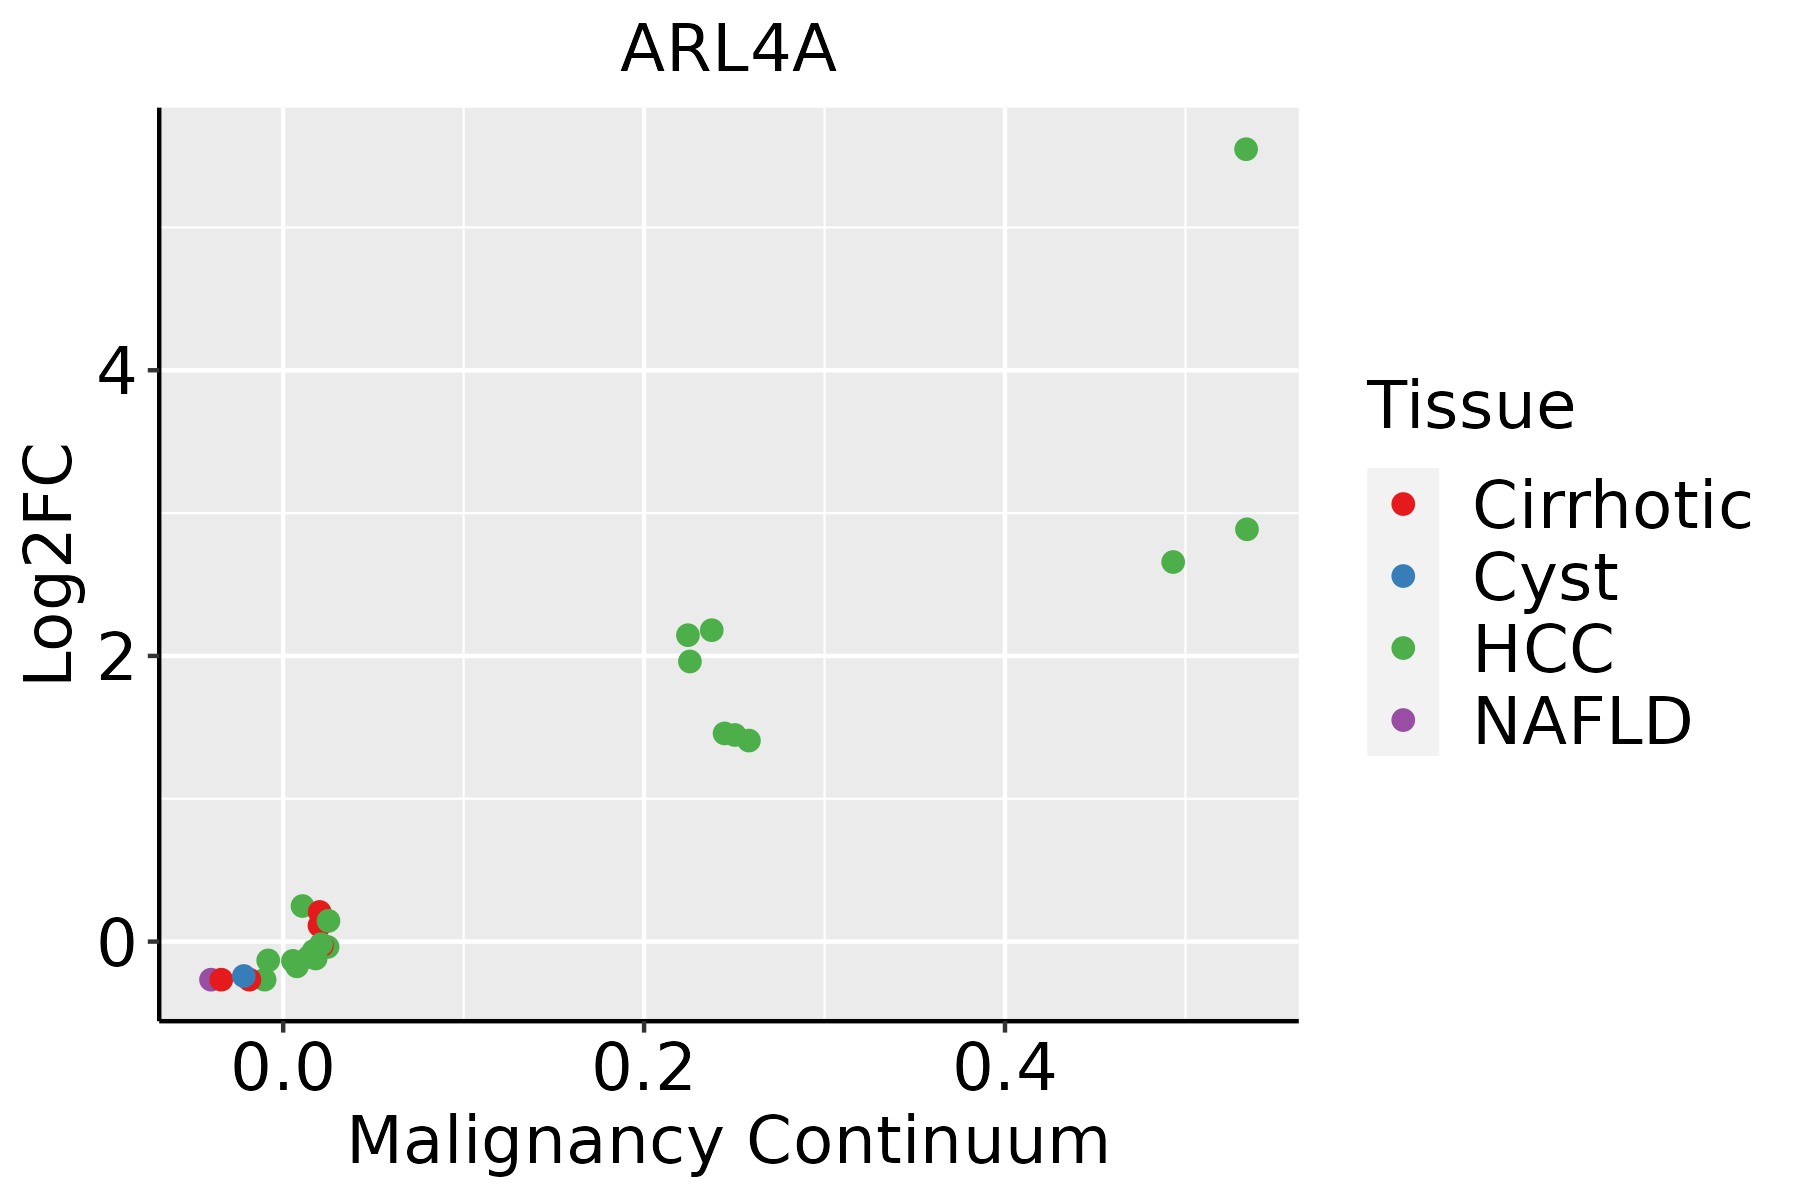 | HCC: Hepatocellular carcinoma |
| NAFLD: Non-alcoholic fatty liver disease | ||
| Oral Cavity | 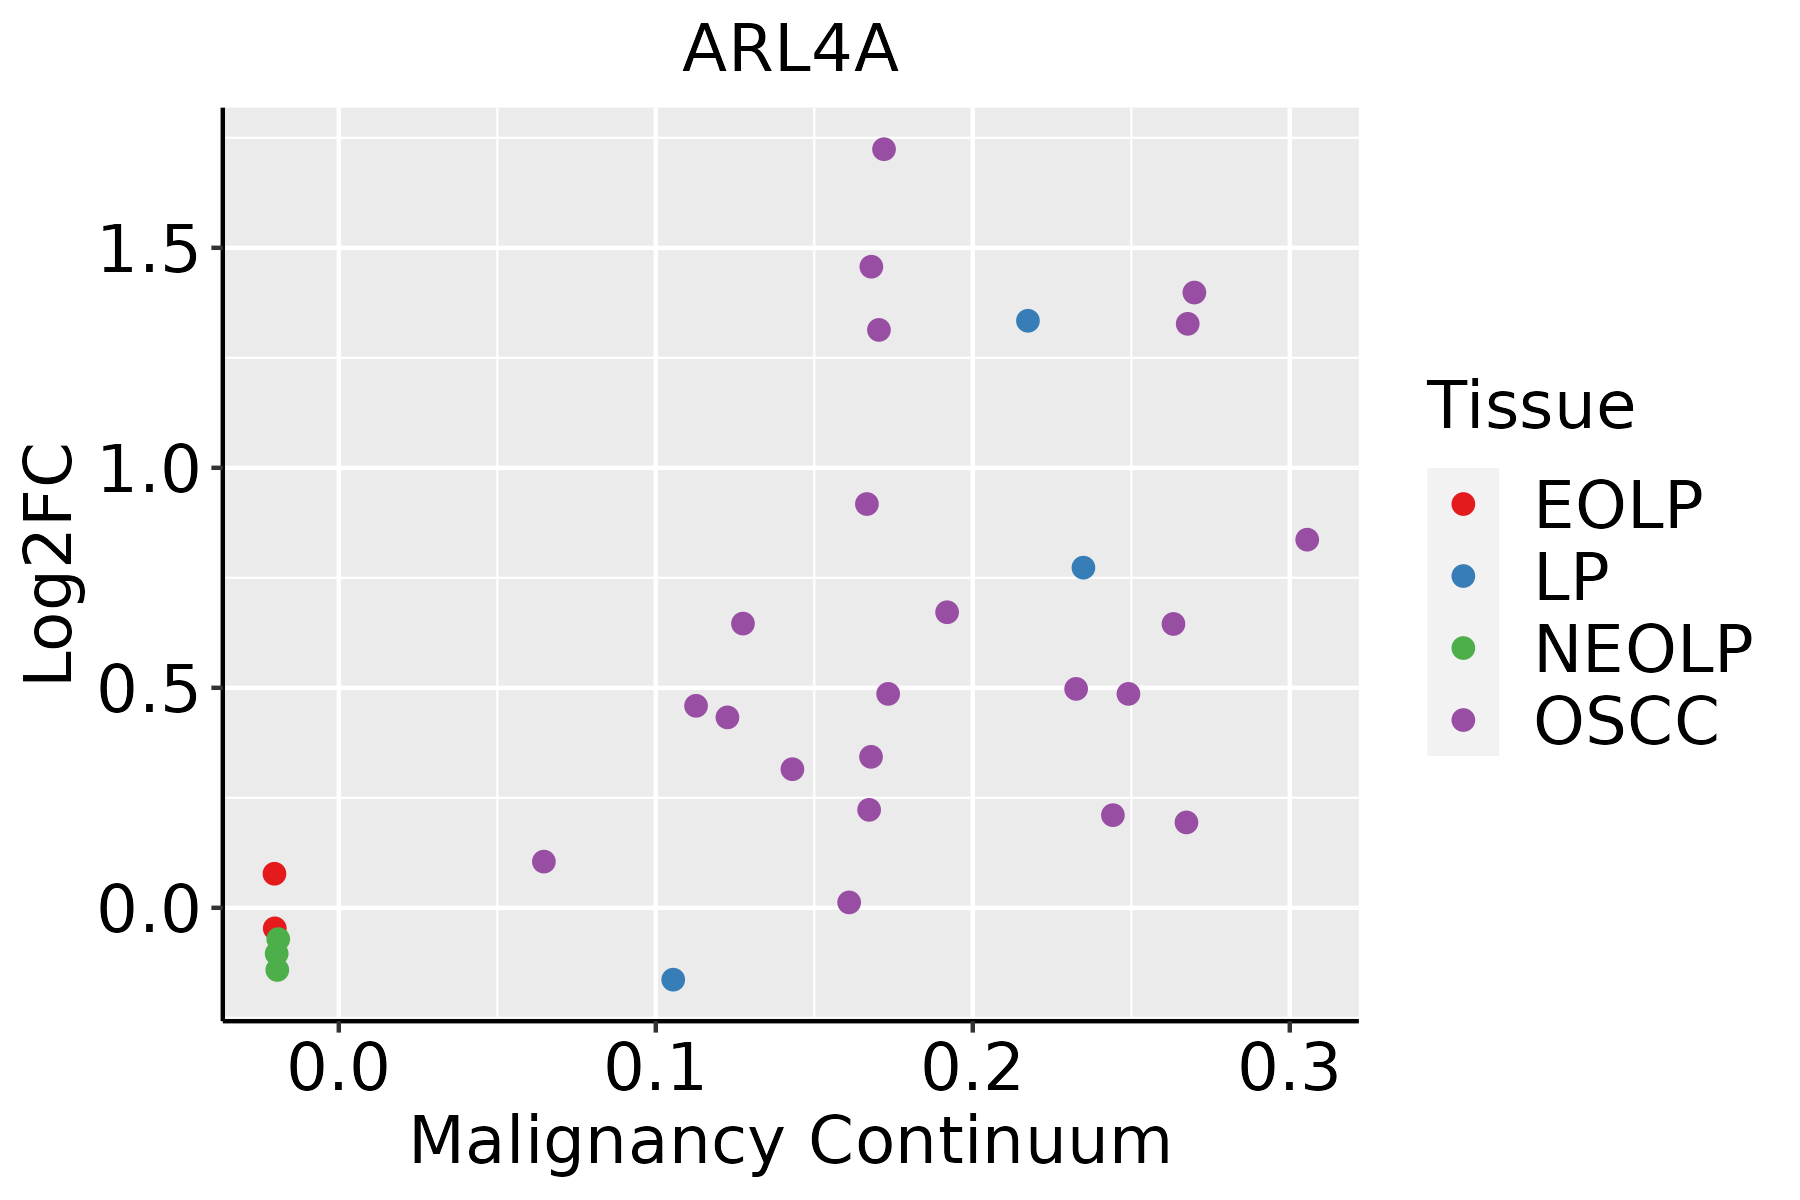 | EOLP: Erosive Oral lichen planus |
| LP: leukoplakia | ||
| NEOLP: Non-erosive oral lichen planus | ||
| OSCC: Oral squamous cell carcinoma | ||
| Skin | 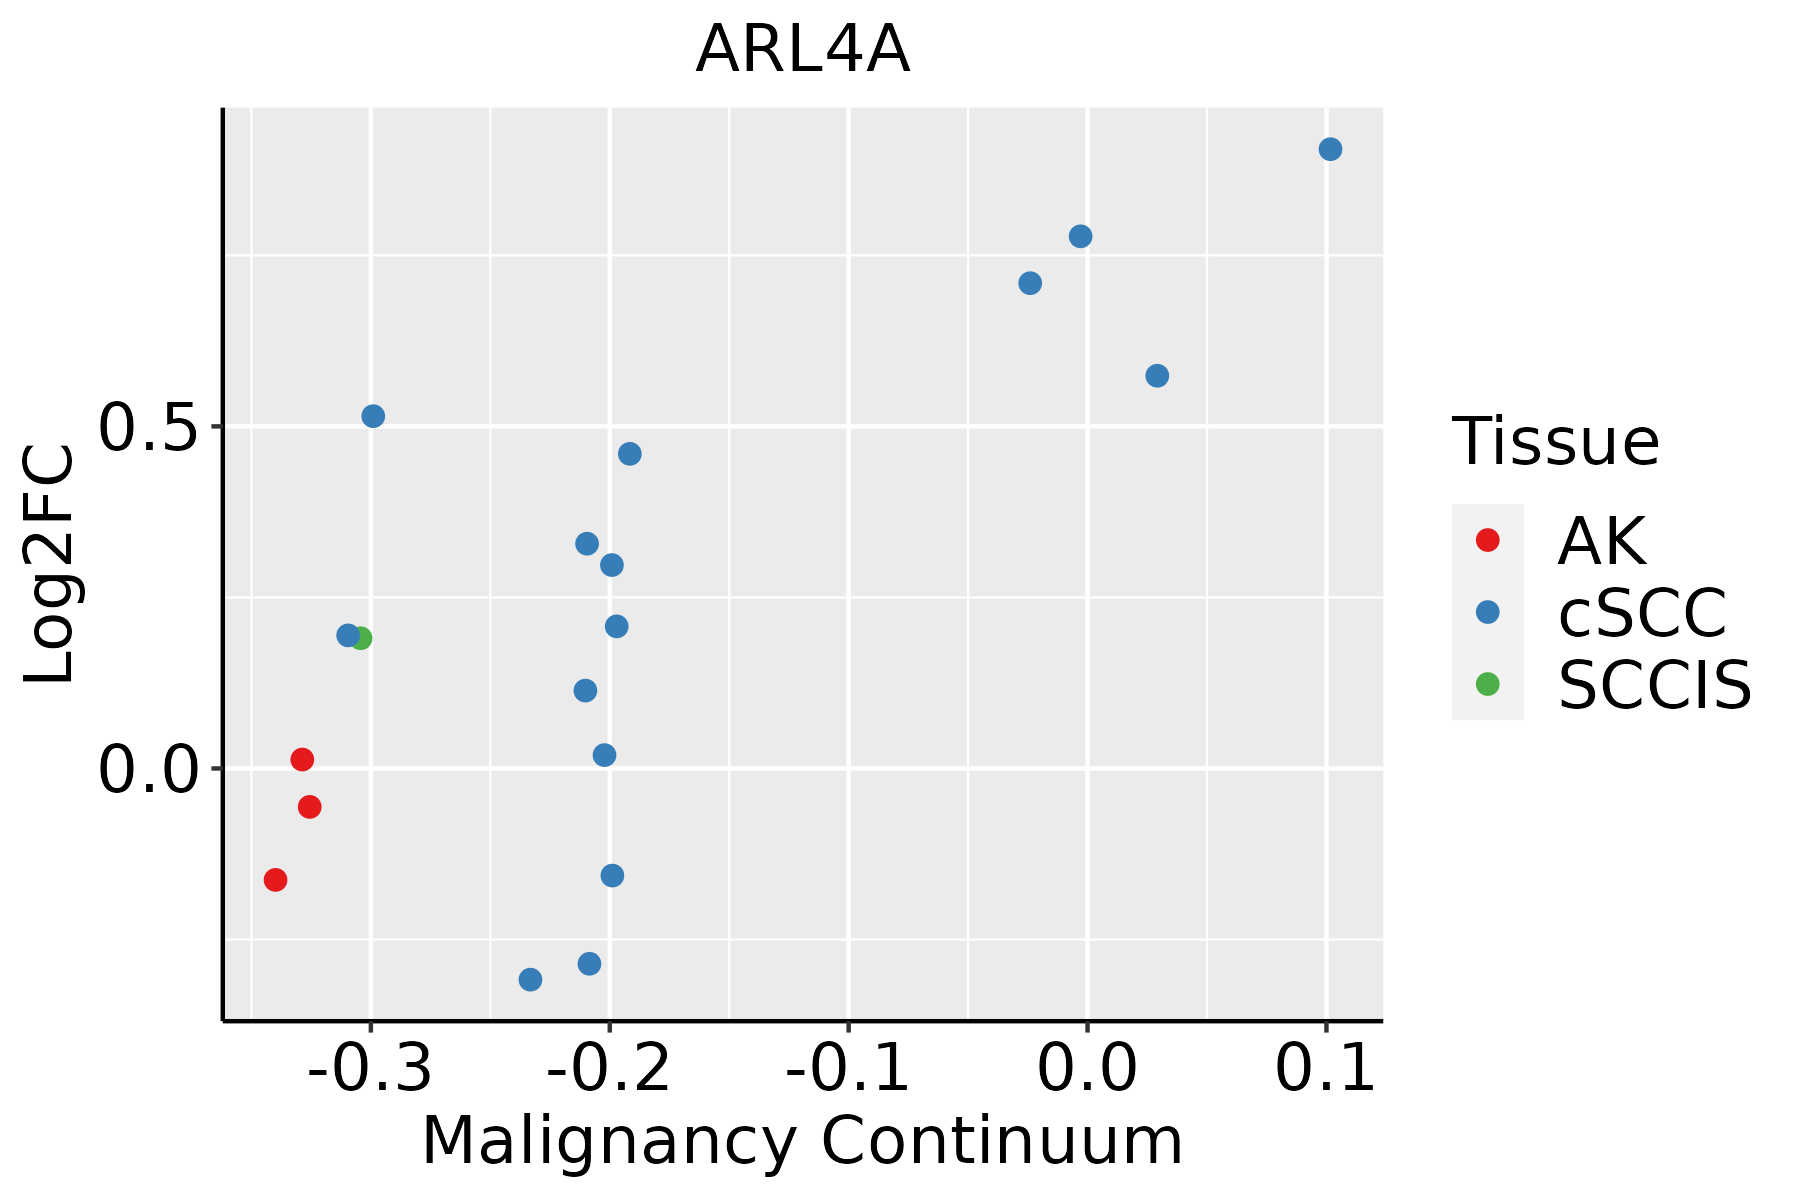 | AK: Actinic keratosis |
| cSCC: Cutaneous squamous cell carcinoma | ||
| SCCIS:squamous cell carcinoma in situ | ||
| Thyroid |  | ATC: Anaplastic thyroid cancer |
| HT: Hashimoto's thyroiditis | ||
| PTC: Papillary thyroid cancer |
| ∗log2FC in expression of this searched gene in stem-like cells from each diseased tissue sample relative to stem-like cells in normal samples in each tissue plotted against the malignancy continuum. Samples are colored based on if they are from different disease stage. |
Top |
Malignant transformation related pathway analysis |
| Find out the enriched GO biological processes and KEGG pathways involved in transition from healthy to precancer to cancer |
| Tissue | Disease Stage | Enriched GO biological Processes |
| Colorectum | AD |  |
| Colorectum | SER |  |
| Colorectum | MSS |  |
| Colorectum | MSI-H |  |
| Colorectum | FAP |  |
| ∗Top 15 enriched GO BP terms are showed in the bar plot of each disease state in each tissue. Each row represents a significant GO biological process which is colored according to the -log10(p.adjust). |
| Page: 1 2 3 4 5 6 7 8 9 |
| GO ID | Tissue | Disease Stage | Description | Gene Ratio | Bg Ratio | pvalue | p.adjust | Count |
| GO:00454444 | Breast | Precancer | fat cell differentiation | 26/1080 | 229/18723 | 7.60e-04 | 9.04e-03 | 26 |
| GO:004544412 | Breast | IDC | fat cell differentiation | 30/1434 | 229/18723 | 2.72e-03 | 2.41e-02 | 30 |
| GO:004544421 | Breast | DCIS | fat cell differentiation | 30/1390 | 229/18723 | 1.70e-03 | 1.68e-02 | 30 |
| GO:00454445 | Cervix | CC | fat cell differentiation | 53/2311 | 229/18723 | 3.72e-06 | 9.75e-05 | 53 |
| GO:0050873 | Cervix | CC | brown fat cell differentiation | 13/2311 | 50/18723 | 6.42e-03 | 3.58e-02 | 13 |
| GO:00454449 | Esophagus | ESCC | fat cell differentiation | 135/8552 | 229/18723 | 3.38e-05 | 2.78e-04 | 135 |
| GO:00454442 | Liver | Cirrhotic | fat cell differentiation | 73/4634 | 229/18723 | 8.57e-03 | 3.97e-02 | 73 |
| GO:00454441 | Liver | HCC | fat cell differentiation | 120/7958 | 229/18723 | 1.52e-03 | 8.05e-03 | 120 |
| GO:00454448 | Oral cavity | OSCC | fat cell differentiation | 120/7305 | 229/18723 | 2.48e-05 | 2.32e-04 | 120 |
| GO:004544418 | Thyroid | PTC | fat cell differentiation | 102/5968 | 229/18723 | 3.66e-05 | 3.40e-04 | 102 |
| GO:004544423 | Thyroid | ATC | fat cell differentiation | 105/6293 | 229/18723 | 7.42e-05 | 5.62e-04 | 105 |
| Page: 1 |
| Pathway ID | Tissue | Disease Stage | Description | Gene Ratio | Bg Ratio | pvalue | p.adjust | qvalue | Count |
| Page: 1 |
Top |
Cell-cell communication analysis |
| Identification of potential cell-cell interactions between two cell types and their ligand-receptor pairs for different disease states |
| Ligand | Receptor | LRpair | Pathway | Tissue | Disease Stage |
| Page: 1 |
Top |
Single-cell gene regulatory network inference analysis |
| Find out the significant the regulons (TFs) and the target genes of each regulon across cell types for different disease states |
| TF | Cell Type | Tissue | Disease Stage | Target Gene | RSS | Regulon Activity |
| ∗The dot plots of a searched regulon are shown for all cell subpopulations in each disease state of each tissue based on the regulon specific score inferred using pySCENIC and by calculating the average expression. |
| Page: 1 |
Top |
Somatic mutation of malignant transformation related genes |
| Annotation of somatic variants for genes involved in malignant transformation |
| Hugo Symbol | Variant Class | Variant Classification | dbSNP RS | HGVSc | HGVSp | HGVSp Short | SWISSPROT | BIOTYPE | SIFT | PolyPhen | Tumor Sample Barcode | Tissue | Histology | Sex | Age | Stage | Therapy Types | Drugs | Outcome |
| ARL4A | SNV | Missense_Mutation | c.415N>G | p.Arg139Gly | p.R139G | P40617 | protein_coding | tolerated(0.05) | benign(0.383) | TCGA-A2-A1G0-01 | Breast | breast invasive carcinoma | Female | <65 | I/II | Chemotherapy | taxotere | SD | |
| ARL4A | SNV | Missense_Mutation | novel | c.340G>A | p.Glu114Lys | p.E114K | P40617 | protein_coding | deleterious(0) | probably_damaging(0.998) | TCGA-MA-AA41-01 | Cervix | cervical & endocervical cancer | Female | <65 | I/II | Unknown | Unknown | SD |
| ARL4A | SNV | Missense_Mutation | novel | c.368A>C | p.Glu123Ala | p.E123A | P40617 | protein_coding | deleterious(0.05) | benign(0.083) | TCGA-CA-6717-01 | Colorectum | colon adenocarcinoma | Male | <65 | I/II | Chemotherapy | oxaliplatin | CR |
| ARL4A | SNV | Missense_Mutation | novel | c.99G>T | p.Lys33Asn | p.K33N | P40617 | protein_coding | deleterious(0) | probably_damaging(0.999) | TCGA-F5-6814-01 | Colorectum | rectum adenocarcinoma | Male | <65 | I/II | Unknown | Unknown | SD |
| ARL4A | SNV | Missense_Mutation | novel | c.414G>C | p.Leu138Phe | p.L138F | P40617 | protein_coding | deleterious(0) | probably_damaging(0.961) | TCGA-AJ-A3QS-01 | Endometrium | uterine corpus endometrioid carcinoma | Female | <65 | III/IV | Chemotherapy | cisplatin | CR |
| ARL4A | SNV | Missense_Mutation | rs749392270 | c.316N>A | p.Glu106Lys | p.E106K | P40617 | protein_coding | deleterious(0.01) | probably_damaging(0.918) | TCGA-AJ-A5DW-01 | Endometrium | uterine corpus endometrioid carcinoma | Female | <65 | I/II | Unknown | Unknown | SD |
| ARL4A | SNV | Missense_Mutation | novel | c.104N>T | p.Thr35Ile | p.T35I | P40617 | protein_coding | deleterious(0) | probably_damaging(0.975) | TCGA-AP-A1DO-01 | Endometrium | uterine corpus endometrioid carcinoma | Female | <65 | I/II | Unknown | Unknown | SD |
| ARL4A | SNV | Missense_Mutation | c.71T>C | p.Val24Ala | p.V24A | P40617 | protein_coding | tolerated(0.21) | benign(0.031) | TCGA-AX-A0J0-01 | Endometrium | uterine corpus endometrioid carcinoma | Female | <65 | I/II | Unknown | Unknown | SD | |
| ARL4A | SNV | Missense_Mutation | novel | c.542A>G | p.Lys181Arg | p.K181R | P40617 | protein_coding | tolerated(0.42) | benign(0.021) | TCGA-BK-A6W3-01 | Endometrium | uterine corpus endometrioid carcinoma | Female | <65 | I/II | Unknown | Unknown | SD |
| ARL4A | SNV | Missense_Mutation | novel | c.377G>A | p.Gly126Glu | p.G126E | P40617 | protein_coding | deleterious(0.03) | probably_damaging(0.993) | TCGA-D1-A1NS-01 | Endometrium | uterine corpus endometrioid carcinoma | Female | <65 | I/II | Unknown | Unknown | SD |
| Page: 1 2 3 |
Top |
Related drugs of malignant transformation related genes |
| Identification of chemicals and drugs interact with genes involved in malignant transfromation |
| (DGIdb 4.0) |
| Entrez ID | Symbol | Category | Interaction Types | Drug Claim Name | Drug Name | PMIDs |
| Page: 1 |

Copyright 2023-Present -The University of Texas Health Science Center at Houston |