
|
|||||
|
 | |
| |
| |
| |
| |
| |
|
Gene: ARIH1 |
Gene summary for ARIH1 |
| Gene information | Species | Human | Gene symbol | ARIH1 | Gene ID | 25820 |
| Gene name | ariadne RBR E3 ubiquitin protein ligase 1 | |
| Gene Alias | ARI | |
| Cytomap | 15q24.1 | |
| Gene Type | protein-coding | GO ID | GO:0000209 | UniProtAcc | Q9Y4X5 |
Top |
Malignant transformation analysis |
| Identification of the aberrant gene expression in precancerous and cancerous lesions by comparing the gene expression of stem-like cells in diseased tissues with normal stem cells |
| Entrez ID | Symbol | Replicates | Species | Organ | Tissue | Adj P-value | Log2FC | Malignancy |
| 25820 | ARIH1 | P127T-E | Human | Esophagus | ESCC | 1.91e-18 | 3.73e-01 | 0.0826 |
| 25820 | ARIH1 | P128T-E | Human | Esophagus | ESCC | 2.75e-35 | 1.27e+00 | 0.1241 |
| 25820 | ARIH1 | P130T-E | Human | Esophagus | ESCC | 5.25e-55 | 1.19e+00 | 0.1676 |
| 25820 | ARIH1 | NAFLD1 | Human | Liver | NAFLD | 2.81e-06 | 6.64e-01 | -0.04 |
| 25820 | ARIH1 | S41 | Human | Liver | Cirrhotic | 4.73e-02 | 4.77e-01 | -0.0343 |
| 25820 | ARIH1 | S43 | Human | Liver | Cirrhotic | 1.41e-03 | -6.14e-02 | -0.0187 |
| 25820 | ARIH1 | HCC1_Meng | Human | Liver | HCC | 2.19e-61 | -7.18e-02 | 0.0246 |
| 25820 | ARIH1 | HCC2_Meng | Human | Liver | HCC | 1.77e-20 | -1.74e-02 | 0.0107 |
| 25820 | ARIH1 | HCC1 | Human | Liver | HCC | 1.92e-02 | 2.81e+00 | 0.5336 |
| 25820 | ARIH1 | HCC2 | Human | Liver | HCC | 4.76e-11 | 3.04e+00 | 0.5341 |
| 25820 | ARIH1 | Pt13.b | Human | Liver | HCC | 6.10e-03 | -7.98e-02 | 0.0251 |
| 25820 | ARIH1 | S014 | Human | Liver | HCC | 1.20e-05 | 4.74e-01 | 0.2254 |
| 25820 | ARIH1 | S015 | Human | Liver | HCC | 2.76e-04 | 5.54e-01 | 0.2375 |
| 25820 | ARIH1 | S016 | Human | Liver | HCC | 6.23e-09 | 5.90e-01 | 0.2243 |
| 25820 | ARIH1 | S027 | Human | Liver | HCC | 2.24e-11 | 1.27e+00 | 0.2446 |
| 25820 | ARIH1 | S028 | Human | Liver | HCC | 1.90e-23 | 1.38e+00 | 0.2503 |
| 25820 | ARIH1 | S029 | Human | Liver | HCC | 9.47e-21 | 1.29e+00 | 0.2581 |
| 25820 | ARIH1 | TD9 | Human | Lung | IAC | 3.81e-09 | 1.47e+00 | 0.088 |
| 25820 | ARIH1 | RNA-P10T2-P10T2-3 | Human | Lung | AAH | 1.04e-03 | 8.64e-01 | -0.1408 |
| 25820 | ARIH1 | RNA-P17T-P17T-2 | Human | Lung | IAC | 2.58e-09 | 1.18e+00 | 0.3371 |
| Page: 1 2 3 4 5 6 7 8 9 10 11 12 |
| Tissue | Expression Dynamics | Abbreviation |
| Cervix | 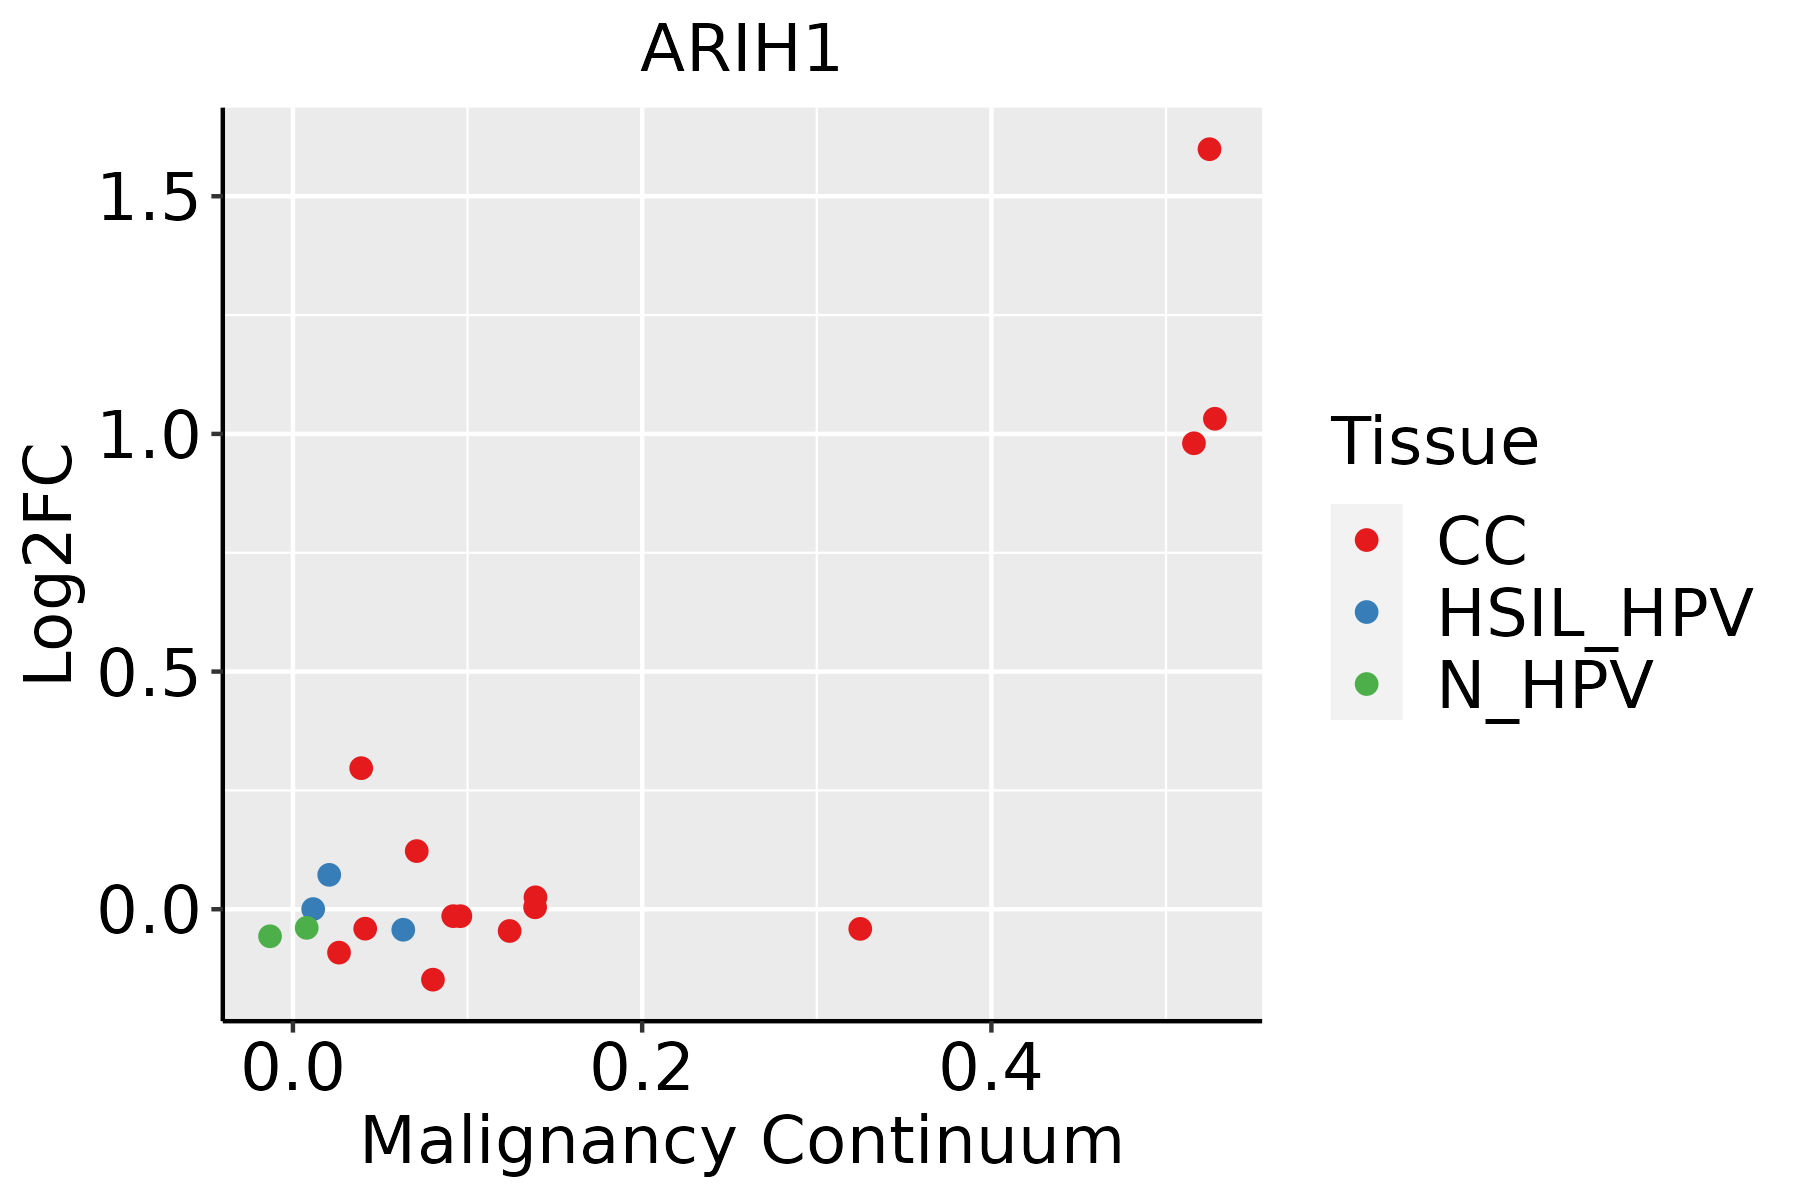 | CC: Cervix cancer |
| HSIL_HPV: HPV-infected high-grade squamous intraepithelial lesions | ||
| N_HPV: HPV-infected normal cervix | ||
| Colorectum (GSE201348) | 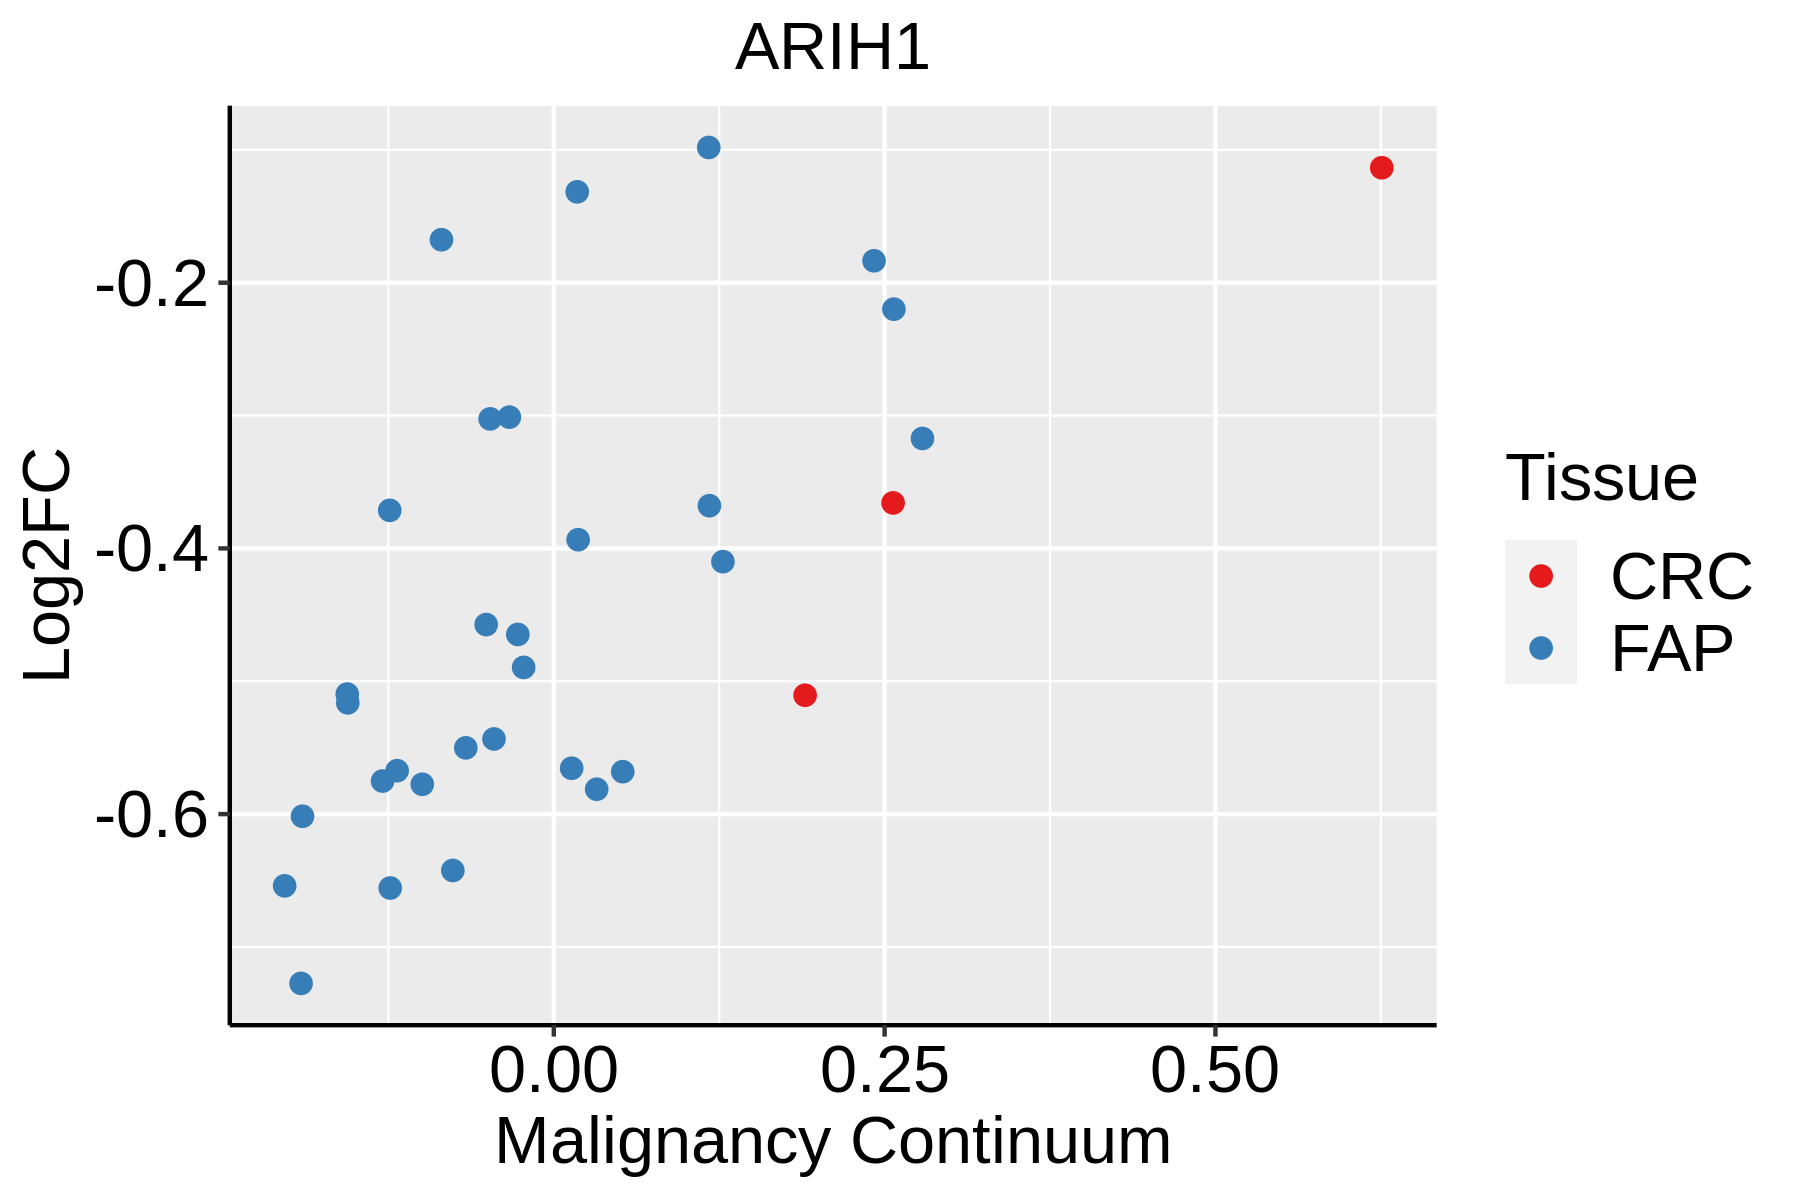 | FAP: Familial adenomatous polyposis |
| CRC: Colorectal cancer | ||
| Colorectum (HTA11) |  | AD: Adenomas |
| SER: Sessile serrated lesions | ||
| MSI-H: Microsatellite-high colorectal cancer | ||
| MSS: Microsatellite stable colorectal cancer | ||
| Endometrium |  | AEH: Atypical endometrial hyperplasia |
| EEC: Endometrioid Cancer | ||
| Esophagus | 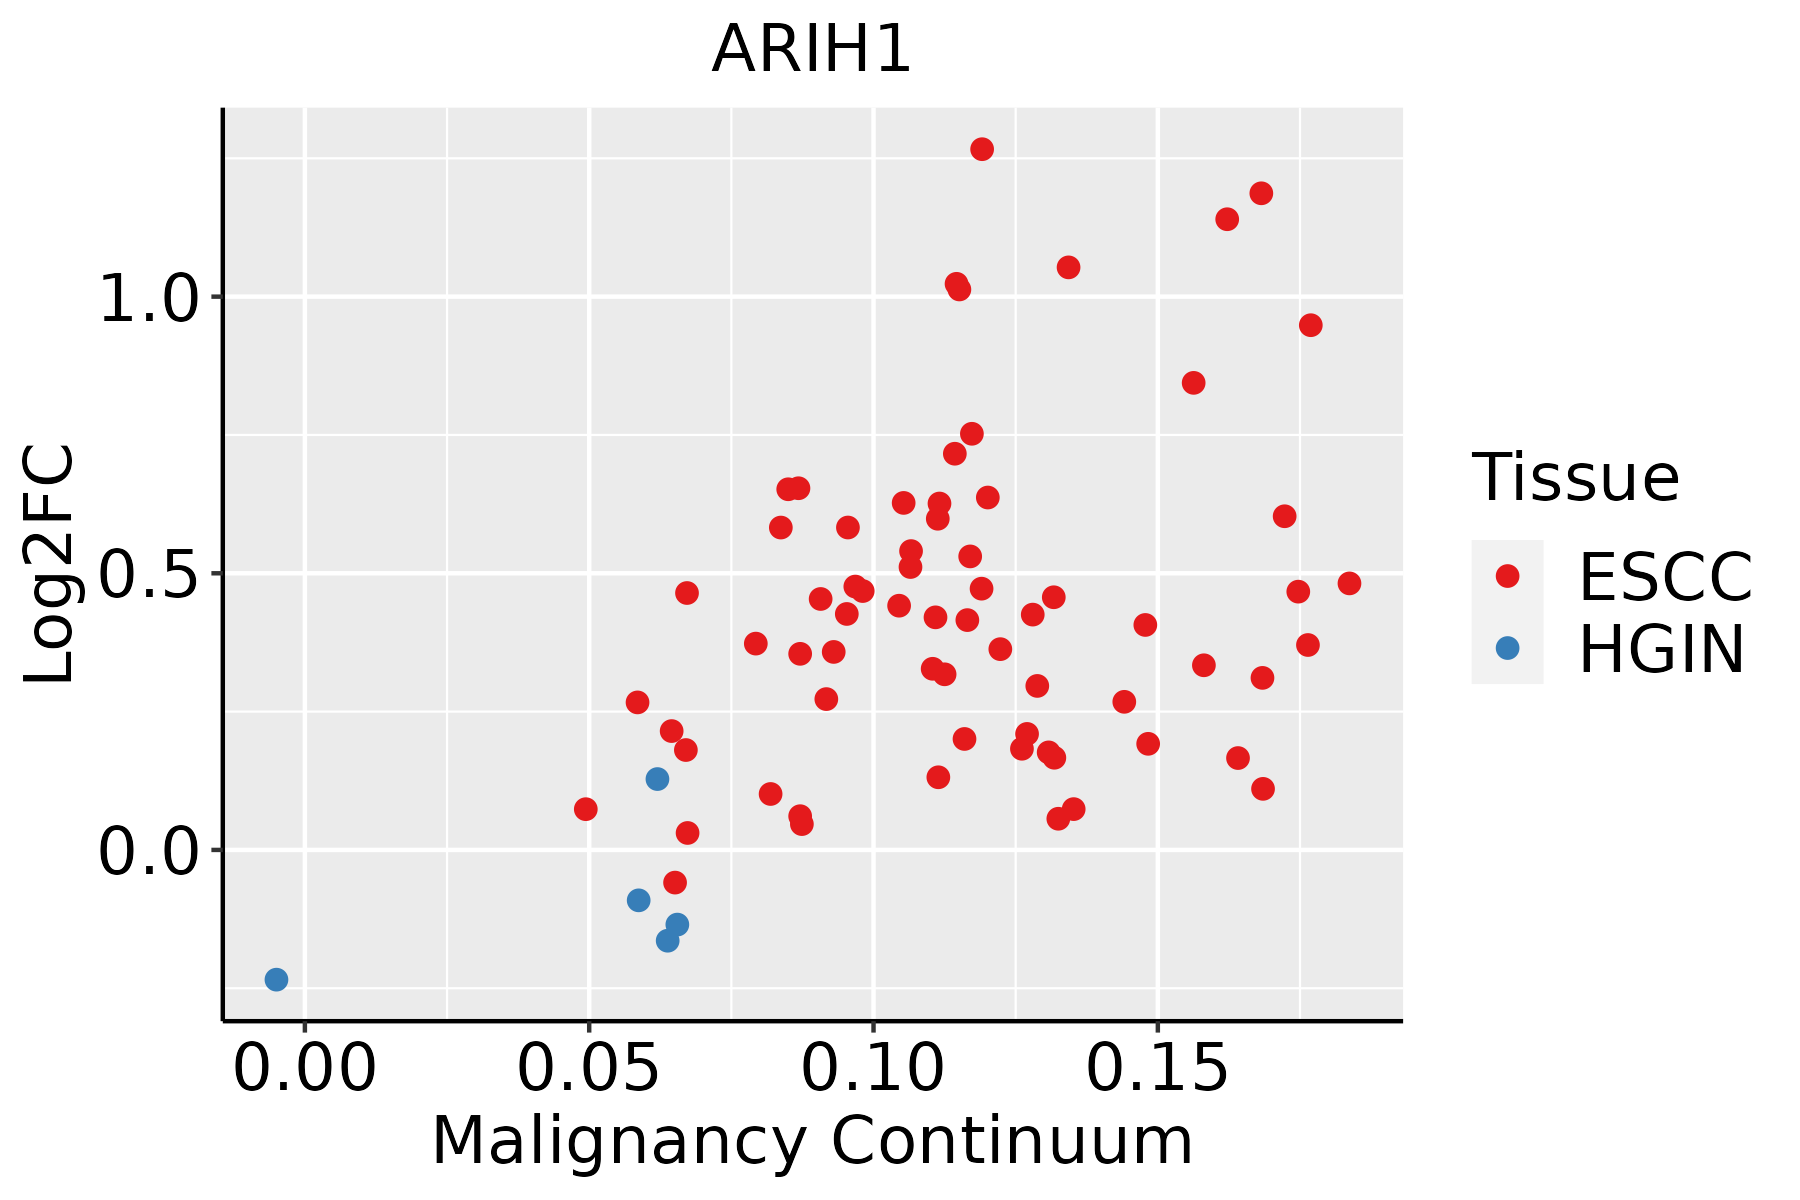 | ESCC: Esophageal squamous cell carcinoma |
| HGIN: High-grade intraepithelial neoplasias | ||
| LGIN: Low-grade intraepithelial neoplasias | ||
| Liver | 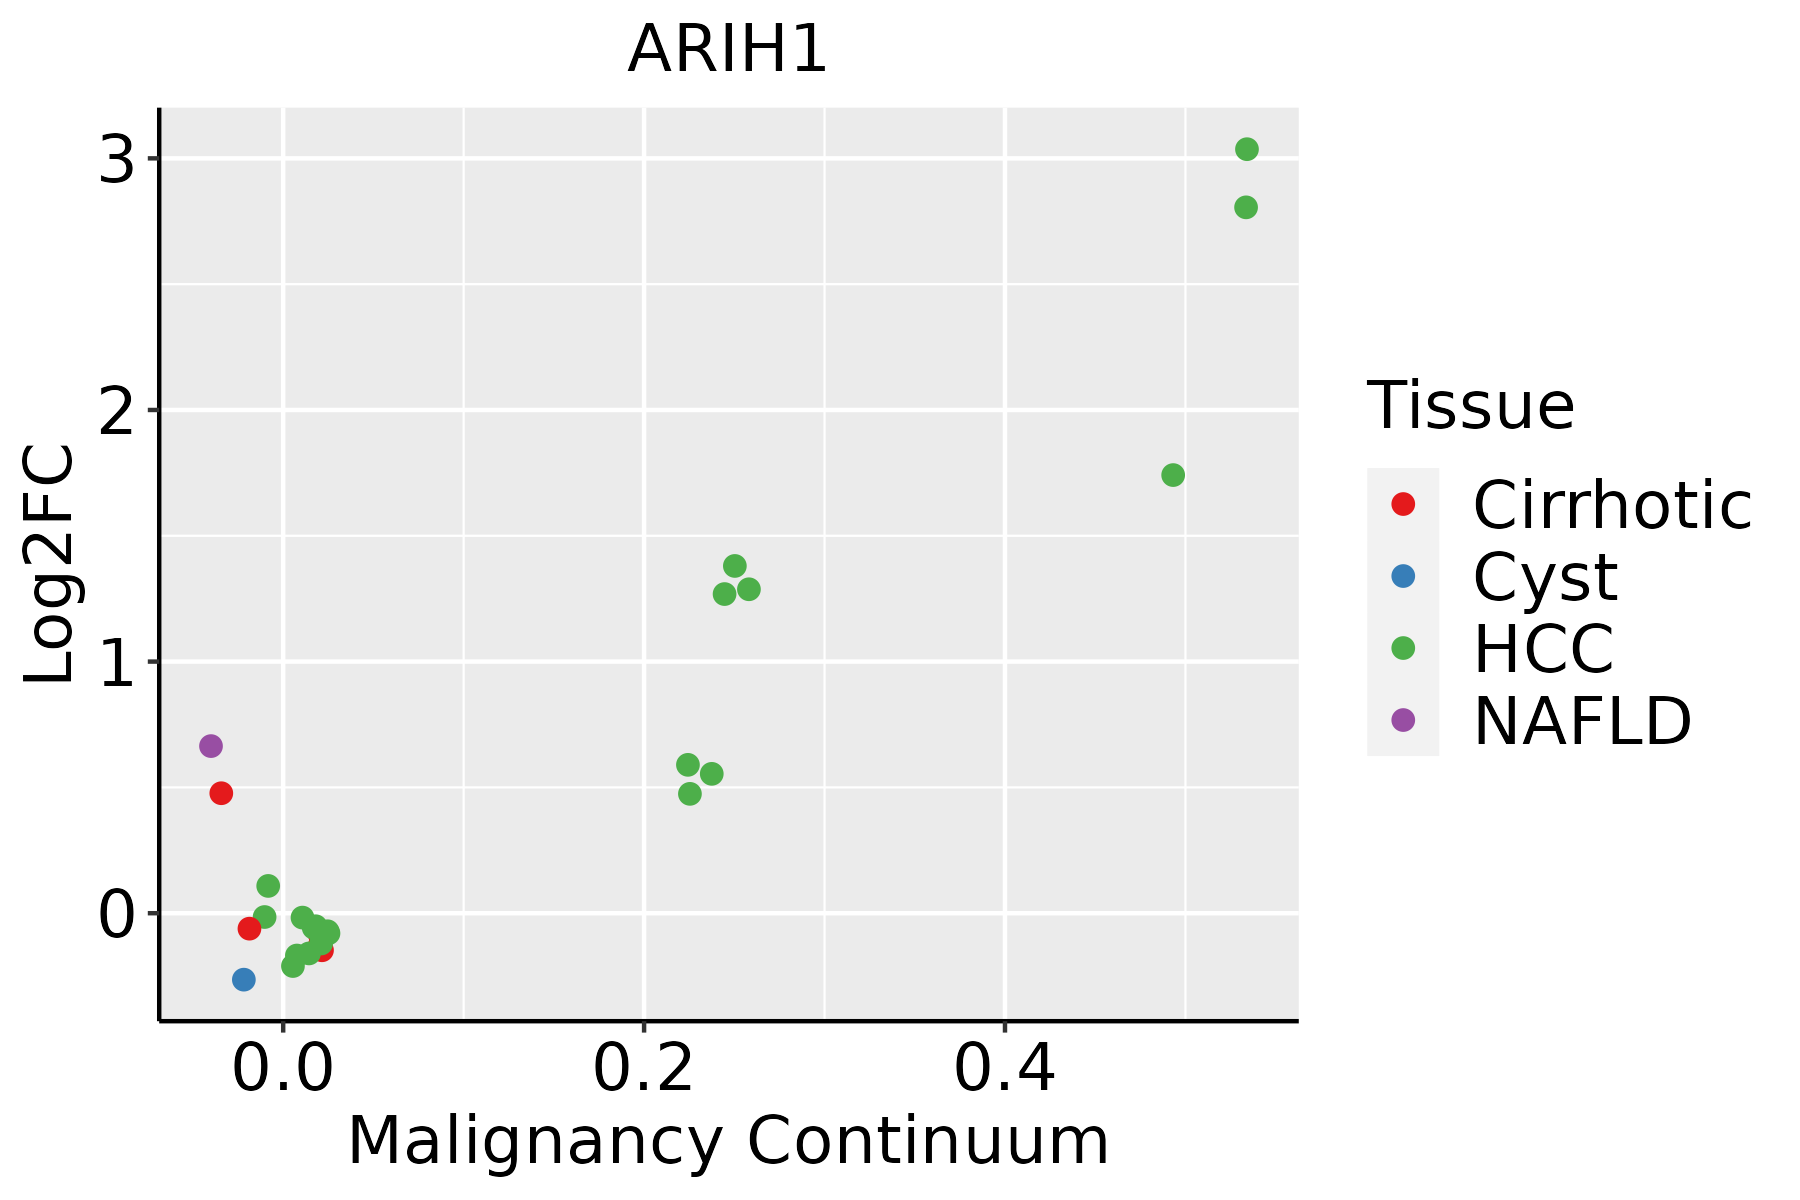 | HCC: Hepatocellular carcinoma |
| NAFLD: Non-alcoholic fatty liver disease | ||
| Lung | 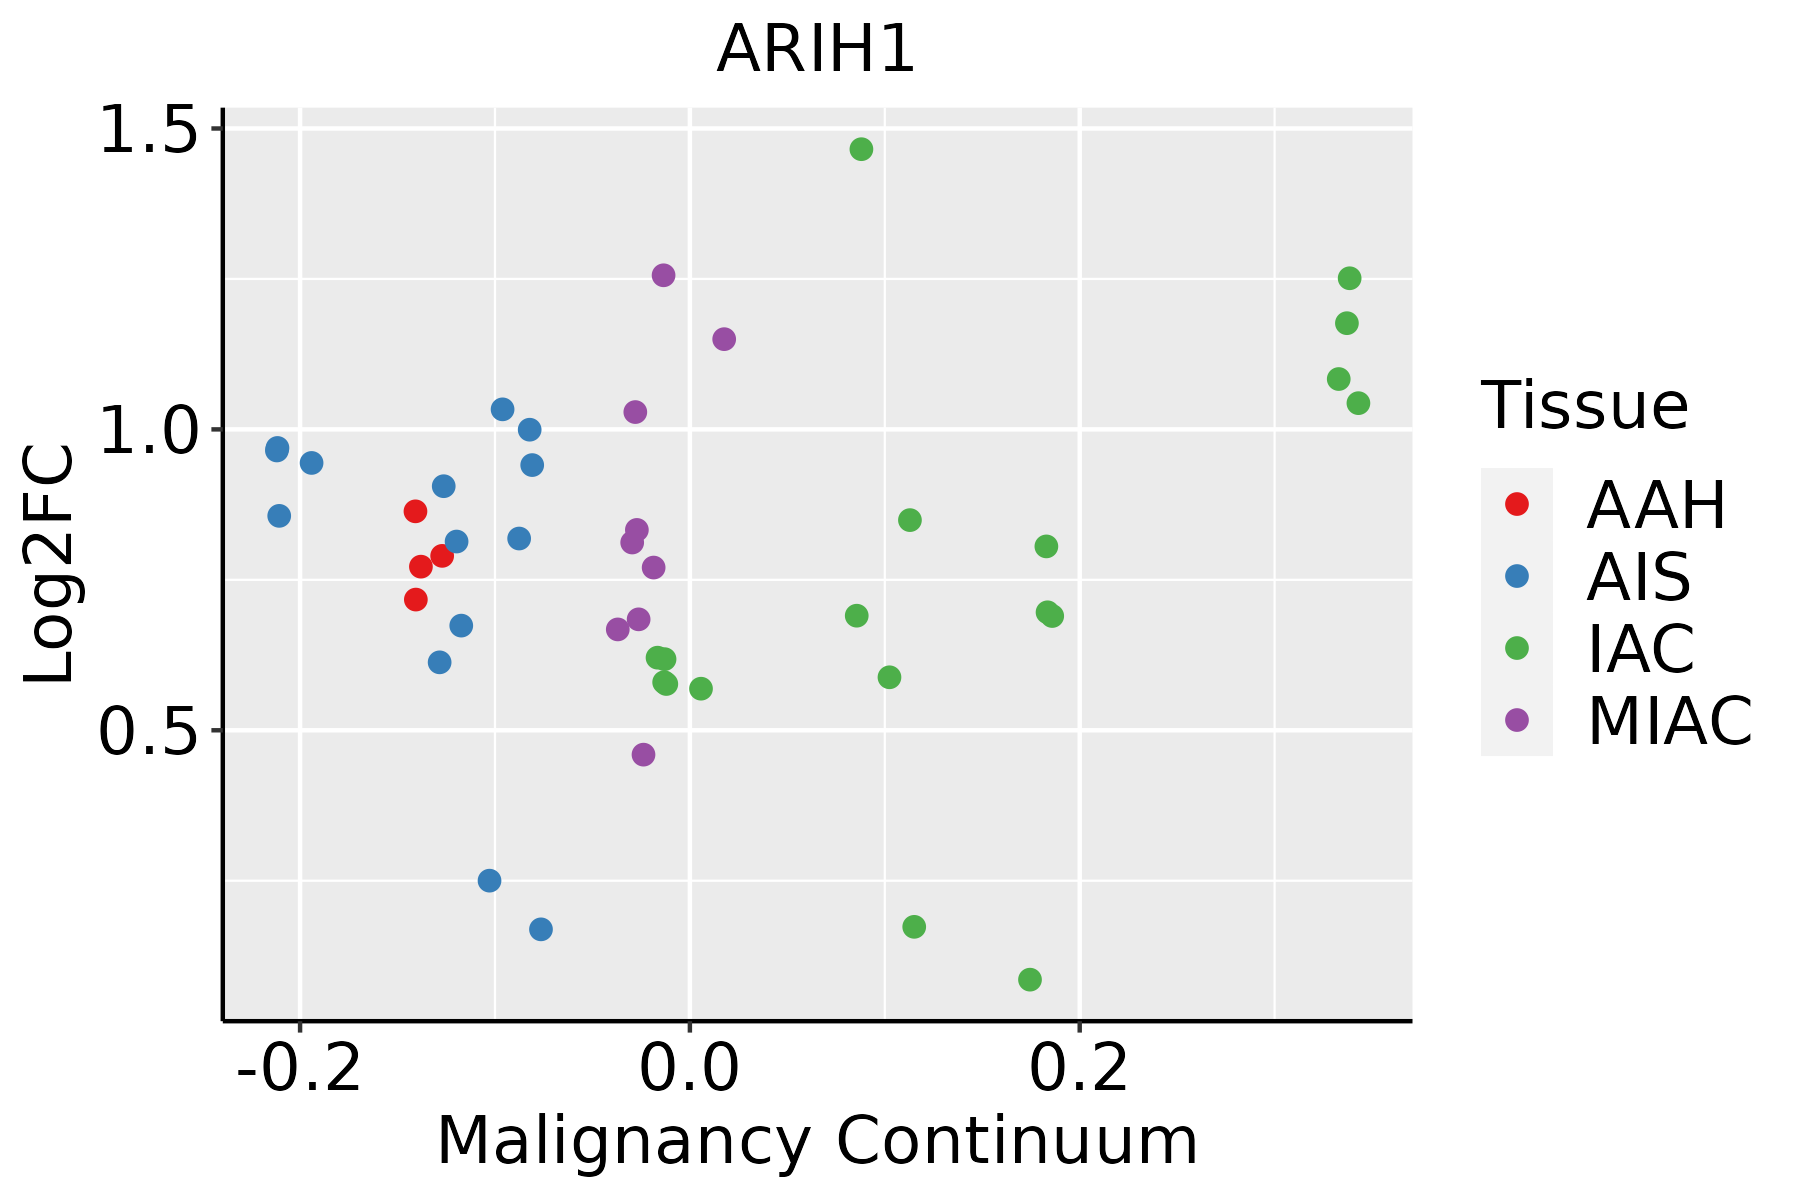 | AAH: Atypical adenomatous hyperplasia |
| AIS: Adenocarcinoma in situ | ||
| IAC: Invasive lung adenocarcinoma | ||
| MIA: Minimally invasive adenocarcinoma | ||
| Oral Cavity | 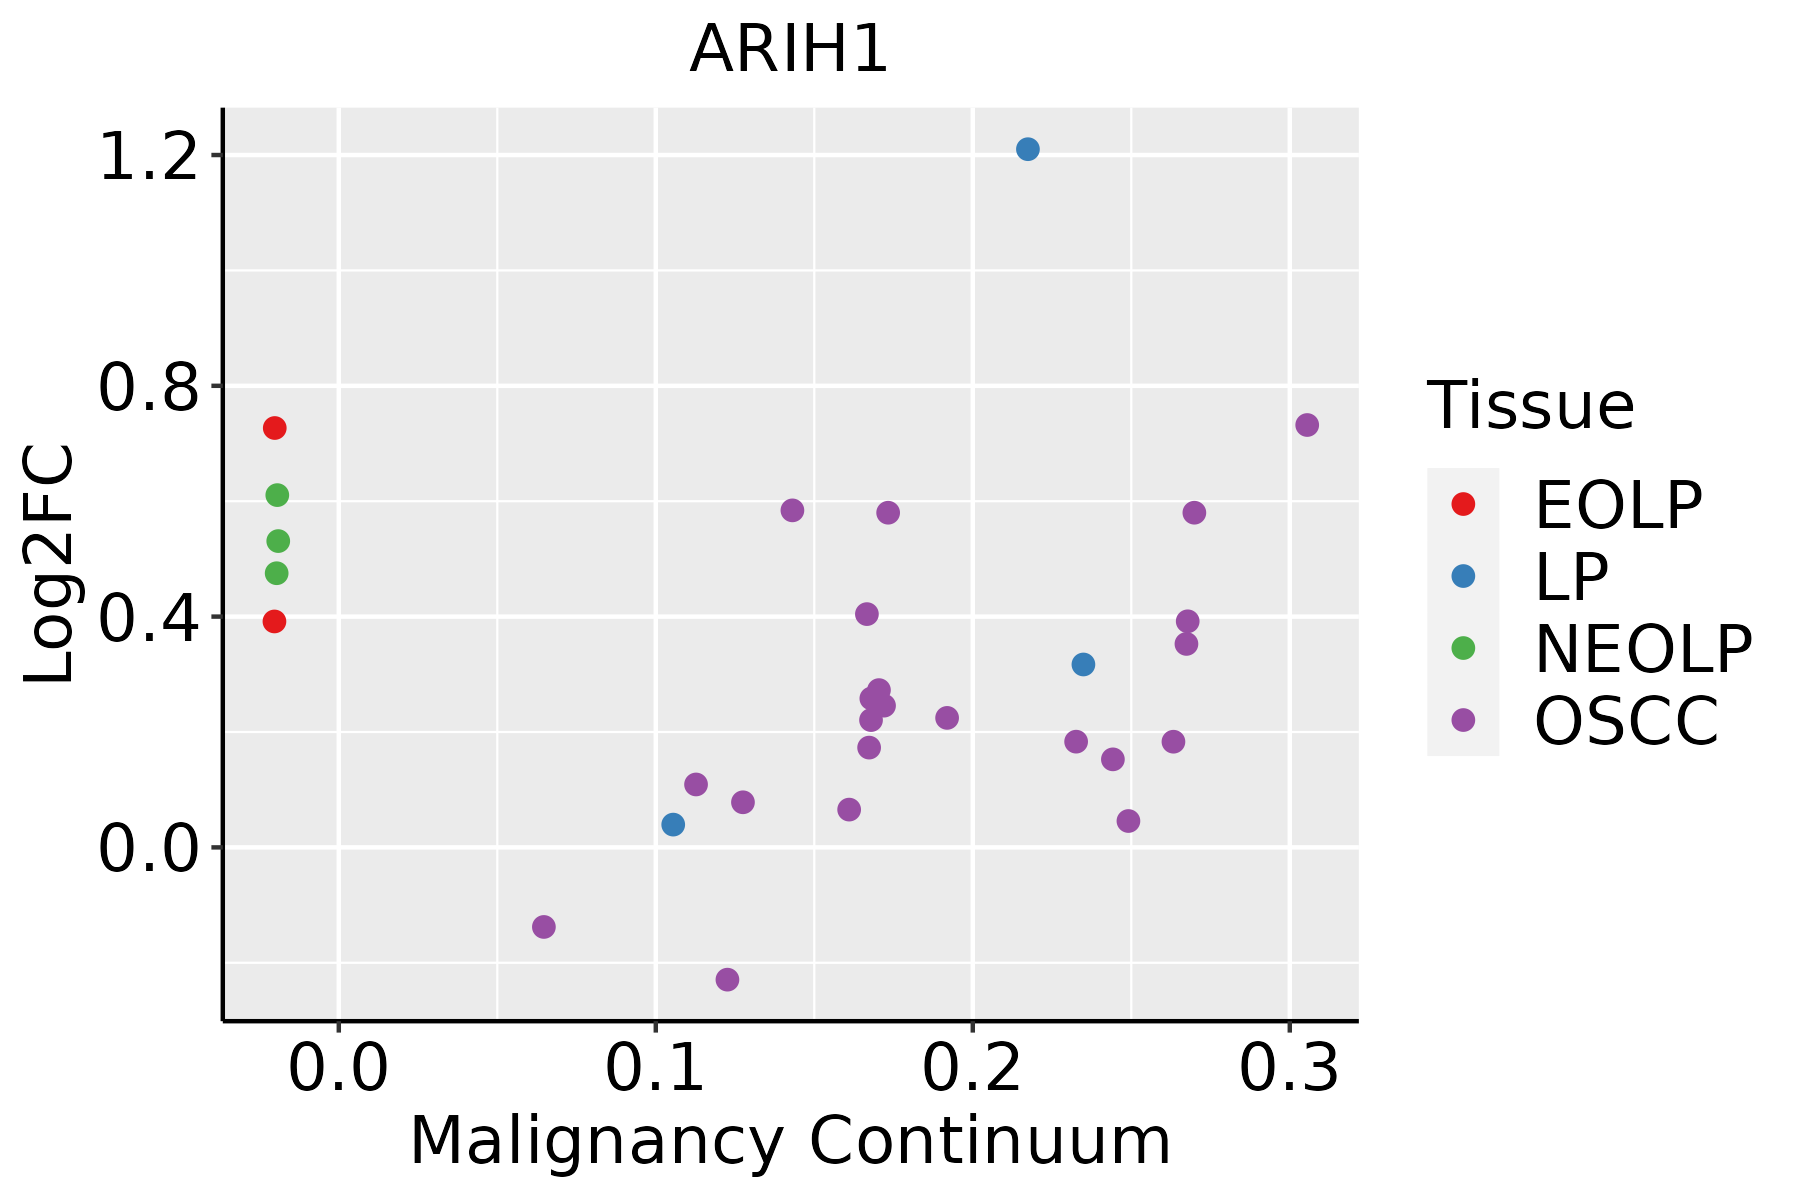 | EOLP: Erosive Oral lichen planus |
| LP: leukoplakia | ||
| NEOLP: Non-erosive oral lichen planus | ||
| OSCC: Oral squamous cell carcinoma | ||
| Prostate |  | BPH: Benign Prostatic Hyperplasia |
| Skin | 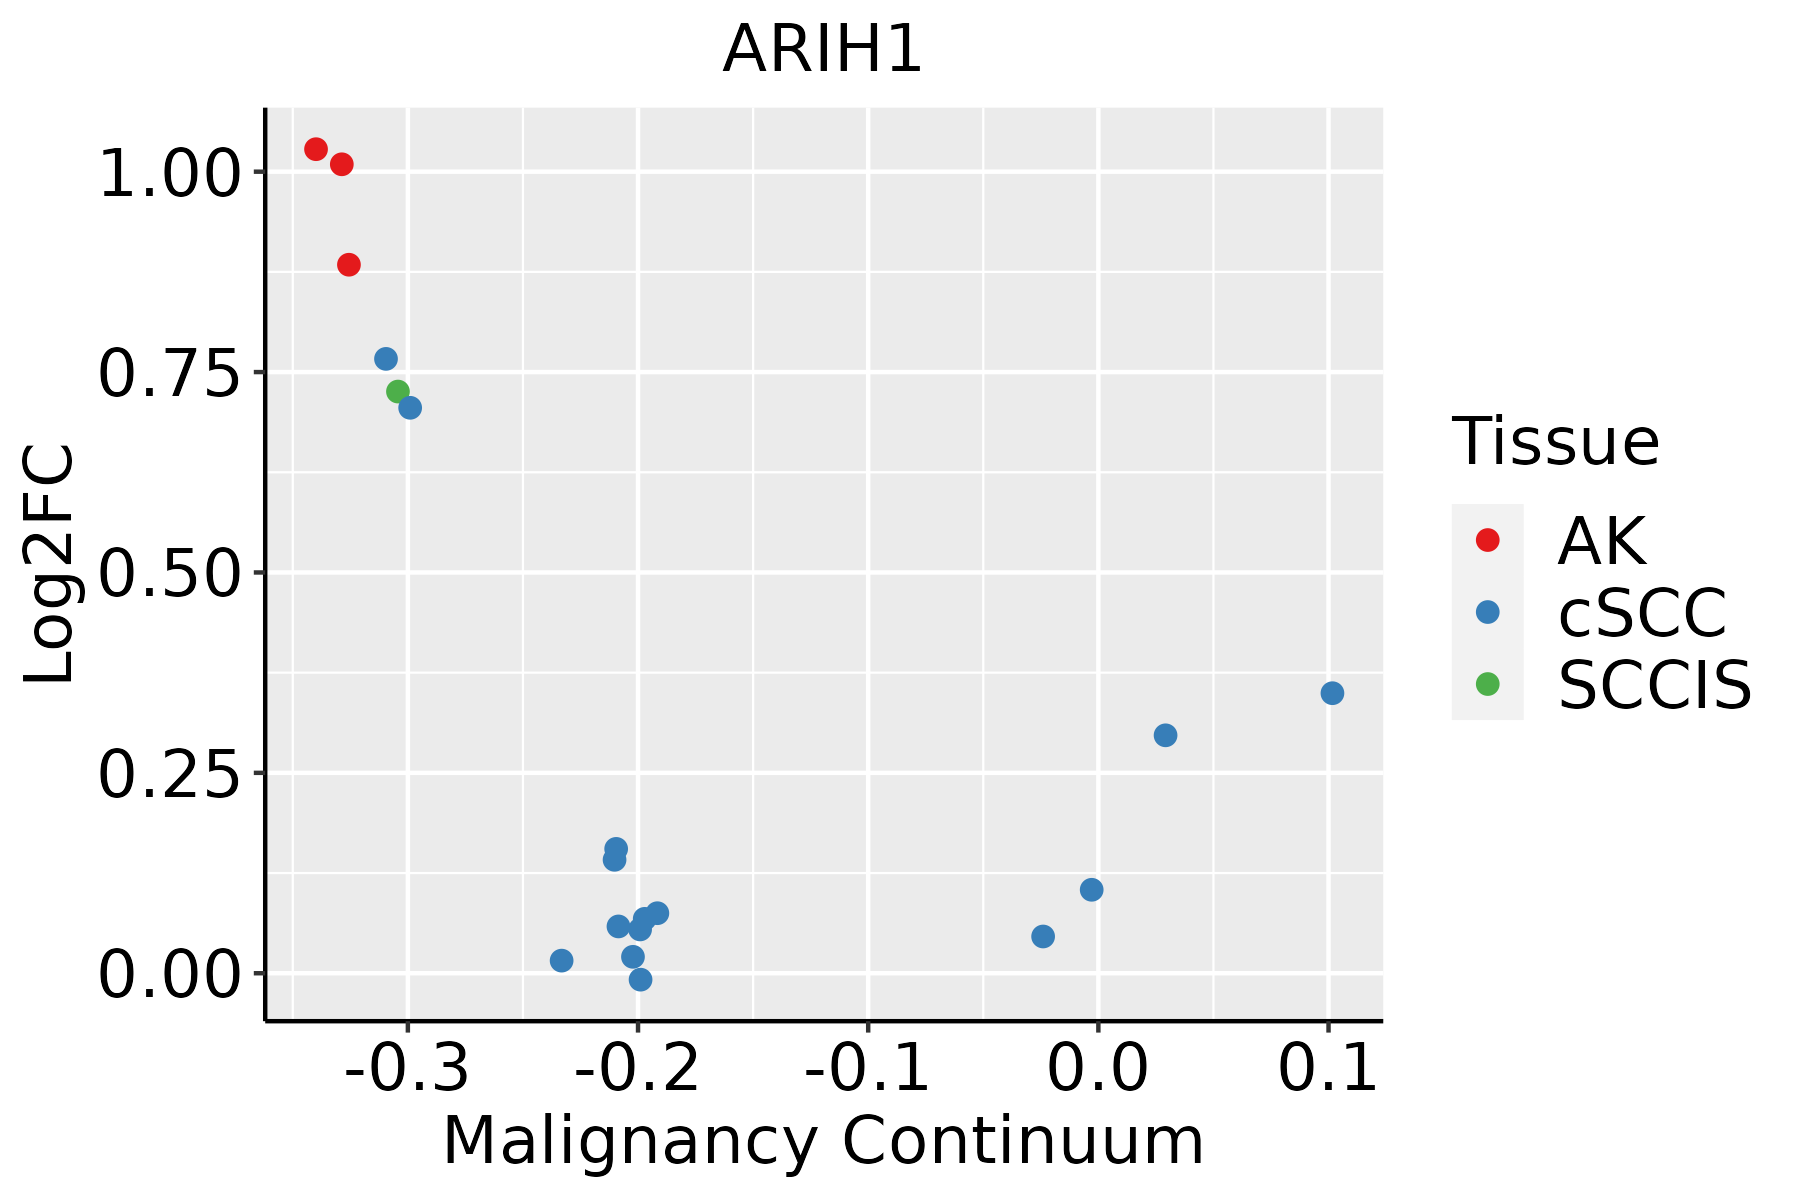 | AK: Actinic keratosis |
| cSCC: Cutaneous squamous cell carcinoma | ||
| SCCIS:squamous cell carcinoma in situ | ||
| Thyroid | 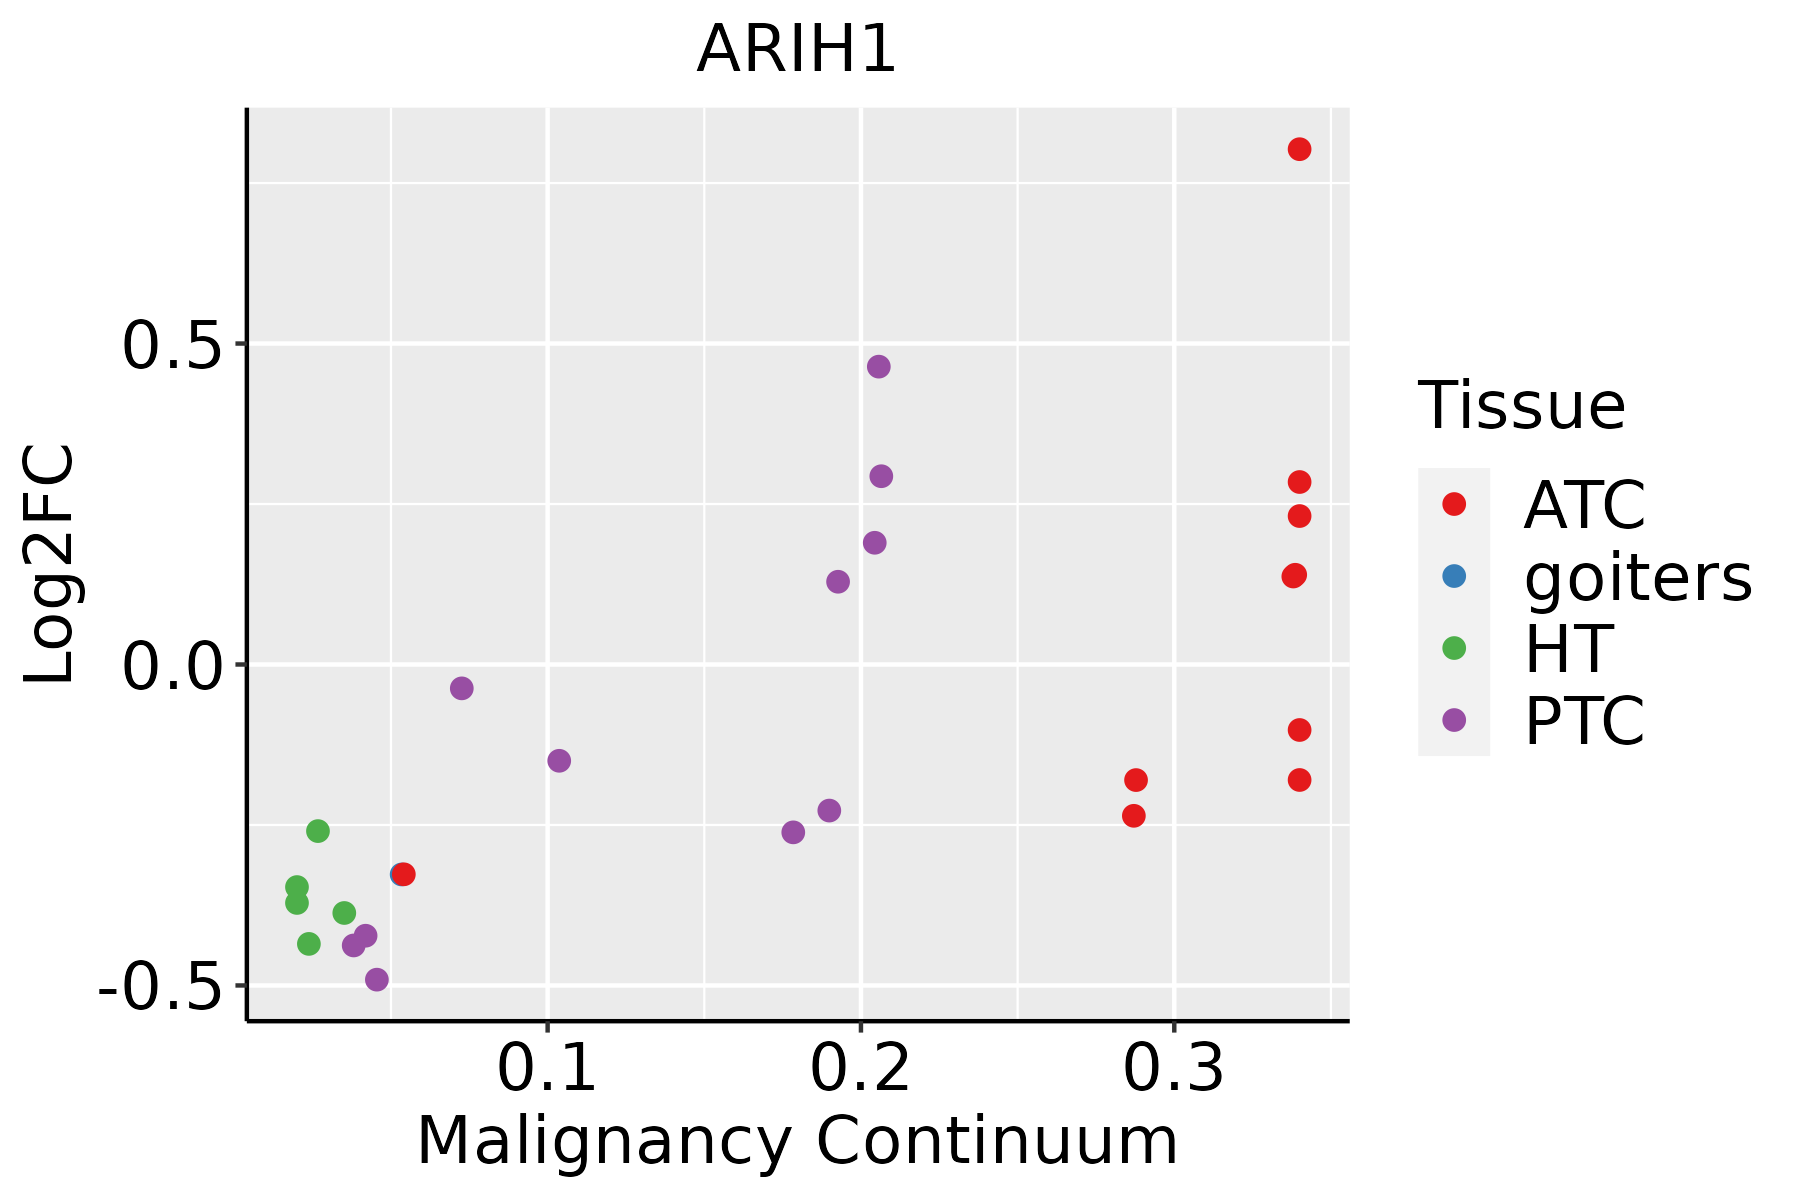 | ATC: Anaplastic thyroid cancer |
| HT: Hashimoto's thyroiditis | ||
| PTC: Papillary thyroid cancer |
| ∗log2FC in expression of this searched gene in stem-like cells from each diseased tissue sample relative to stem-like cells in normal samples in each tissue plotted against the malignancy continuum. Samples are colored based on if they are from different disease stage. |
Top |
Malignant transformation related pathway analysis |
| Find out the enriched GO biological processes and KEGG pathways involved in transition from healthy to precancer to cancer |
| Tissue | Disease Stage | Enriched GO biological Processes |
| Colorectum | AD |  |
| Colorectum | SER |  |
| Colorectum | MSS |  |
| Colorectum | MSI-H |  |
| Colorectum | FAP |  |
| ∗Top 15 enriched GO BP terms are showed in the bar plot of each disease state in each tissue. Each row represents a significant GO biological process which is colored according to the -log10(p.adjust). |
| Page: 1 2 3 4 5 6 7 8 9 |
| GO ID | Tissue | Disease Stage | Description | Gene Ratio | Bg Ratio | pvalue | p.adjust | Count |
| GO:004217610 | Cervix | CC | regulation of protein catabolic process | 104/2311 | 391/18723 | 9.39e-15 | 9.36e-12 | 104 |
| GO:004586210 | Cervix | CC | positive regulation of proteolysis | 95/2311 | 372/18723 | 1.84e-12 | 6.86e-10 | 95 |
| GO:190336210 | Cervix | CC | regulation of cellular protein catabolic process | 72/2311 | 255/18723 | 5.98e-12 | 2.10e-09 | 72 |
| GO:004573210 | Cervix | CC | positive regulation of protein catabolic process | 65/2311 | 231/18723 | 7.44e-11 | 1.39e-08 | 65 |
| GO:001049810 | Cervix | CC | proteasomal protein catabolic process | 111/2311 | 490/18723 | 8.98e-11 | 1.58e-08 | 111 |
| GO:000989610 | Cervix | CC | positive regulation of catabolic process | 109/2311 | 492/18723 | 5.26e-10 | 6.99e-08 | 109 |
| GO:190305010 | Cervix | CC | regulation of proteolysis involved in cellular protein catabolic process | 60/2311 | 221/18723 | 1.82e-09 | 1.98e-07 | 60 |
| GO:200005810 | Cervix | CC | regulation of ubiquitin-dependent protein catabolic process | 47/2311 | 164/18723 | 1.63e-08 | 1.25e-06 | 47 |
| GO:004316110 | Cervix | CC | proteasome-mediated ubiquitin-dependent protein catabolic process | 91/2311 | 412/18723 | 1.65e-08 | 1.25e-06 | 91 |
| GO:003133110 | Cervix | CC | positive regulation of cellular catabolic process | 91/2311 | 427/18723 | 9.64e-08 | 5.25e-06 | 91 |
| GO:00002097 | Cervix | CC | protein polyubiquitination | 58/2311 | 236/18723 | 1.57e-07 | 7.41e-06 | 58 |
| GO:190336410 | Cervix | CC | positive regulation of cellular protein catabolic process | 43/2311 | 155/18723 | 1.80e-07 | 8.28e-06 | 43 |
| GO:006113610 | Cervix | CC | regulation of proteasomal protein catabolic process | 48/2311 | 187/18723 | 4.63e-07 | 1.77e-05 | 48 |
| GO:003243410 | Cervix | CC | regulation of proteasomal ubiquitin-dependent protein catabolic process | 38/2311 | 134/18723 | 4.99e-07 | 1.88e-05 | 38 |
| GO:19030528 | Cervix | CC | positive regulation of proteolysis involved in cellular protein catabolic process | 34/2311 | 133/18723 | 2.28e-05 | 4.01e-04 | 34 |
| GO:200006010 | Cervix | CC | positive regulation of ubiquitin-dependent protein catabolic process | 29/2311 | 107/18723 | 2.77e-05 | 4.62e-04 | 29 |
| GO:00324369 | Cervix | CC | positive regulation of proteasomal ubiquitin-dependent protein catabolic process | 25/2311 | 90/18723 | 6.22e-05 | 8.90e-04 | 25 |
| GO:19018008 | Cervix | CC | positive regulation of proteasomal protein catabolic process | 29/2311 | 114/18723 | 9.71e-05 | 1.27e-03 | 29 |
| GO:0042176 | Colorectum | AD | regulation of protein catabolic process | 160/3918 | 391/18723 | 1.06e-19 | 7.34e-17 | 160 |
| GO:0009896 | Colorectum | AD | positive regulation of catabolic process | 180/3918 | 492/18723 | 4.33e-16 | 1.94e-13 | 180 |
| Page: 1 2 3 4 5 6 7 8 9 10 11 12 13 14 15 16 17 18 19 20 21 22 23 24 25 26 |
| Pathway ID | Tissue | Disease Stage | Description | Gene Ratio | Bg Ratio | pvalue | p.adjust | qvalue | Count |
| Page: 1 |
Top |
Cell-cell communication analysis |
| Identification of potential cell-cell interactions between two cell types and their ligand-receptor pairs for different disease states |
| Ligand | Receptor | LRpair | Pathway | Tissue | Disease Stage |
| Page: 1 |
Top |
Single-cell gene regulatory network inference analysis |
| Find out the significant the regulons (TFs) and the target genes of each regulon across cell types for different disease states |
| TF | Cell Type | Tissue | Disease Stage | Target Gene | RSS | Regulon Activity |
| ∗The dot plots of a searched regulon are shown for all cell subpopulations in each disease state of each tissue based on the regulon specific score inferred using pySCENIC and by calculating the average expression. |
| Page: 1 |
Top |
Somatic mutation of malignant transformation related genes |
| Annotation of somatic variants for genes involved in malignant transformation |
| Hugo Symbol | Variant Class | Variant Classification | dbSNP RS | HGVSc | HGVSp | HGVSp Short | SWISSPROT | BIOTYPE | SIFT | PolyPhen | Tumor Sample Barcode | Tissue | Histology | Sex | Age | Stage | Therapy Types | Drugs | Outcome |
| ARIH1 | SNV | Missense_Mutation | rs767859277 | c.1226N>A | p.Ala409Glu | p.A409E | Q9Y4X5 | protein_coding | tolerated(0.06) | benign(0.043) | TCGA-A2-A25C-01 | Breast | breast invasive carcinoma | Female | <65 | I/II | Chemotherapy | taxotere | SD |
| ARIH1 | SNV | Missense_Mutation | novel | c.1552N>A | p.Leu518Met | p.L518M | Q9Y4X5 | protein_coding | deleterious(0.02) | probably_damaging(0.974) | TCGA-BH-A2L8-01 | Breast | breast invasive carcinoma | Female | <65 | I/II | Chemotherapy | cytoxan | CR |
| ARIH1 | SNV | Missense_Mutation | rs767859277 | c.1226N>A | p.Ala409Glu | p.A409E | Q9Y4X5 | protein_coding | tolerated(0.06) | benign(0.043) | TCGA-D8-A1JN-01 | Breast | breast invasive carcinoma | Female | >=65 | III/IV | Hormone Therapy | anastrozolum | SD |
| ARIH1 | SNV | Missense_Mutation | rs767859277 | c.1226N>A | p.Ala409Glu | p.A409E | Q9Y4X5 | protein_coding | tolerated(0.06) | benign(0.043) | TCGA-D8-A27G-01 | Breast | breast invasive carcinoma | Female | >=65 | I/II | Unknown | Unknown | SD |
| ARIH1 | SNV | Missense_Mutation | c.1532N>T | p.Arg511Leu | p.R511L | Q9Y4X5 | protein_coding | deleterious(0) | probably_damaging(0.986) | TCGA-E2-A15S-01 | Breast | breast invasive carcinoma | Female | <65 | I/II | Chemotherapy | doxorubicin | SD | |
| ARIH1 | SNV | Missense_Mutation | rs767859277 | c.1226N>A | p.Ala409Glu | p.A409E | Q9Y4X5 | protein_coding | tolerated(0.06) | benign(0.043) | TCGA-E2-A1L6-01 | Breast | breast invasive carcinoma | Female | <65 | I/II | Chemotherapy | cyclophosphamide | SD |
| ARIH1 | SNV | Missense_Mutation | c.1532N>A | p.Arg511Gln | p.R511Q | Q9Y4X5 | protein_coding | tolerated(0.18) | benign(0.41) | TCGA-2W-A8YY-01 | Cervix | cervical & endocervical cancer | Female | <65 | I/II | Chemotherapy | cisplatin | CR | |
| ARIH1 | SNV | Missense_Mutation | c.1342C>T | p.His448Tyr | p.H448Y | Q9Y4X5 | protein_coding | tolerated(0.05) | possibly_damaging(0.759) | TCGA-AA-3864-01 | Colorectum | colon adenocarcinoma | Male | >=65 | I/II | Unknown | Unknown | SD | |
| ARIH1 | SNV | Missense_Mutation | novel | c.906N>C | p.Gln302His | p.Q302H | Q9Y4X5 | protein_coding | tolerated(0.12) | possibly_damaging(0.814) | TCGA-CA-6717-01 | Colorectum | colon adenocarcinoma | Male | <65 | I/II | Chemotherapy | oxaliplatin | CR |
| ARIH1 | SNV | Missense_Mutation | novel | c.1202N>A | p.Arg401Lys | p.R401K | Q9Y4X5 | protein_coding | tolerated(0.06) | possibly_damaging(0.553) | TCGA-CA-6717-01 | Colorectum | colon adenocarcinoma | Male | <65 | I/II | Chemotherapy | oxaliplatin | CR |
| Page: 1 2 3 4 5 |
Top |
Related drugs of malignant transformation related genes |
| Identification of chemicals and drugs interact with genes involved in malignant transfromation |
| (DGIdb 4.0) |
| Entrez ID | Symbol | Category | Interaction Types | Drug Claim Name | Drug Name | PMIDs |
| Page: 1 |

Copyright 2023-Present -The University of Texas Health Science Center at Houston |