Schematic overview of the cellular and molecular mechanisms involved in the cancer progression, including the proposed cellular and molecular mechanisms in cancer cells trajectory. AT1: alveolar type 1 cells; AT2: alveolar type 2 cells; AAH: atypical adenomatous hyperplasia; AIS: adenocarcinoma in situ; MIA: minimally invasive adenocarcinoma; IA: invasive adenocarcinoma; EMT: epithelial-mesenchymal transition

Home

Download

Statistics

Help

Contact

Center for Computational Systems Medicine
leaf

Gene summary

leaf

Malignant transformation analysis

leaf

Malignant transformation related pathway analysis

leaf

Cell-cell communication analysis

leaf

Single-cell gene regulatory network inference analysis

leaf

Somatic mutation of malignant transformation related genes

leaf

Related drugs of malignant transformation related genes

Gene: ANP32A

Gene summary for ANP32A

check button Gene summary.

Gene informationSpeciesHuman
Gene symbol

ANP32A

Gene ID

8125

Gene nameacidic nuclear phosphoprotein 32 family member A
Gene AliasC15orf1
Cytomap15q23
Gene Typeprotein-coding
GO ID

GO:0006810

UniProtAcc

P39687


Top

Malignant transformation analysis

check button Identification of the aberrant gene expression in precancerous and cancerous lesions by comparing the gene expression of stem-like cells in diseased tissues with normal stem cells
check button Malignant transformation involving gene list.
Entrez IDSymbolReplicatesSpeciesOrganTissueAdj P-valueLog2FCMalignancy
8125ANP32APt14.dHumanLiverHCC1.57e-021.37e-010.0143
8125ANP32AS014HumanLiverHCC1.62e-461.53e+000.2254
8125ANP32AS015HumanLiverHCC4.78e-331.96e+000.2375
8125ANP32AS016HumanLiverHCC5.75e-441.63e+000.2243
8125ANP32AS027HumanLiverHCC6.69e-191.84e+000.2446
8125ANP32AS028HumanLiverHCC8.71e-391.69e+000.2503
8125ANP32AS029HumanLiverHCC7.97e-291.76e+000.2581
8125ANP32AC04HumanOral cavityOSCC7.03e-221.35e+000.2633
8125ANP32AC21HumanOral cavityOSCC3.51e-572.15e+000.2678
8125ANP32AC30HumanOral cavityOSCC2.05e-382.21e+000.3055
8125ANP32AC38HumanOral cavityOSCC2.94e-049.78e-010.172
8125ANP32AC43HumanOral cavityOSCC6.12e-471.06e+000.1704
8125ANP32AC46HumanOral cavityOSCC1.88e-196.54e-010.1673
8125ANP32AC51HumanOral cavityOSCC4.94e-211.36e+000.2674
8125ANP32AC57HumanOral cavityOSCC1.13e-045.11e-010.1679
8125ANP32AC06HumanOral cavityOSCC5.49e-081.52e+000.2699
8125ANP32AC07HumanOral cavityOSCC1.32e-021.18e+000.2491
8125ANP32AC08HumanOral cavityOSCC1.49e-531.30e+000.1919
8125ANP32AC09HumanOral cavityOSCC2.45e-064.64e-010.1431
8125ANP32ALN22HumanOral cavityOSCC7.43e-101.34e+000.1733
Page: 1 2 3 4 5 6 7 8 9 

check button Transcriptomic changes along malignancy continuum.
TissueExpression DynamicsAbbreviation
Colorectum (GSE201348)The image shows the transcriptomic changes along malignancy continuum.log2FC in expression of this searched gene in stem-like cells from each diseased tissue sample relative to stem-like cells in normal samples in each tissue plotted against the malignancy continuum. Samples are colored based on if they are from different disease stage.
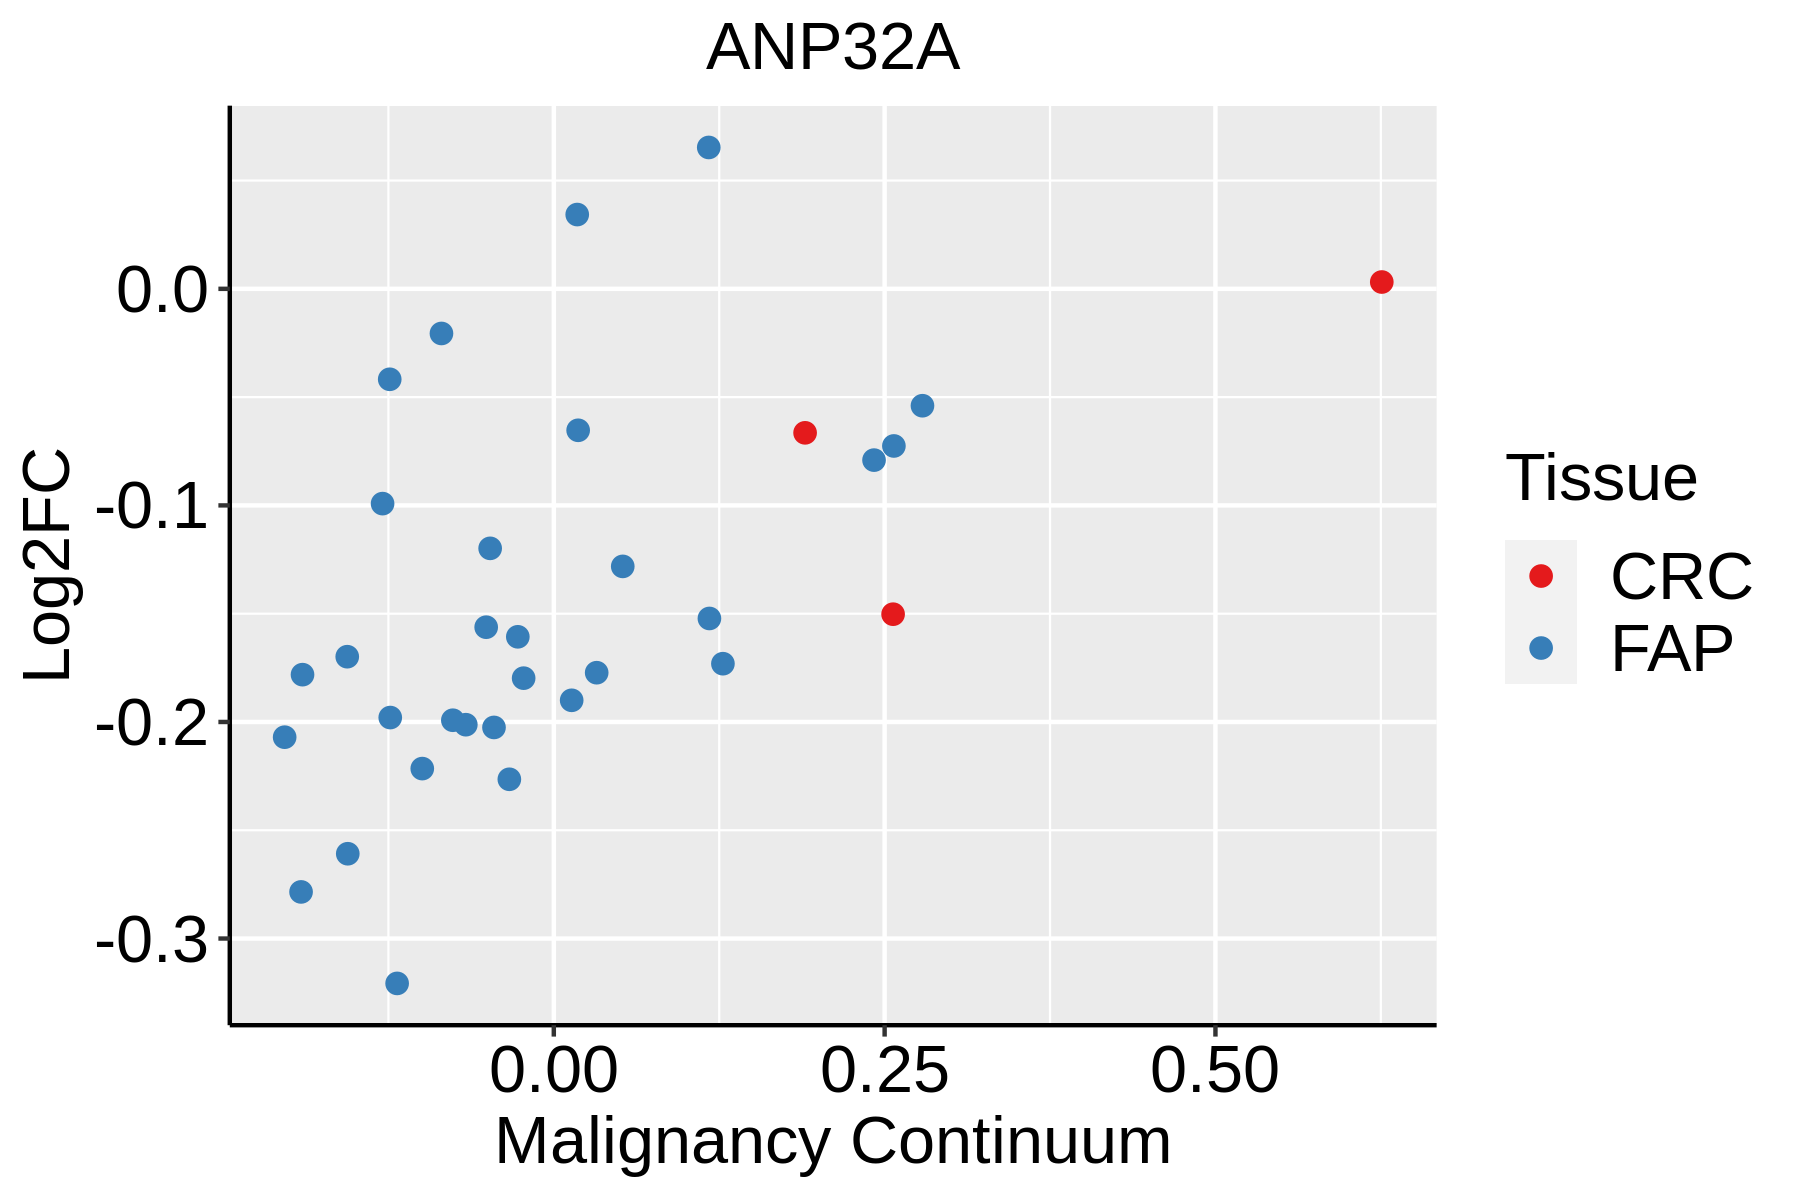
FAP: Familial adenomatous polyposis
CRC: Colorectal cancer
Colorectum (HTA11)The image shows the transcriptomic changes along malignancy continuum.log2FC in expression of this searched gene in stem-like cells from each diseased tissue sample relative to stem-like cells in normal samples in each tissue plotted against the malignancy continuum. Samples are colored based on if they are from different disease stage.AD: Adenomas
SER: Sessile serrated lesions
MSI-H: Microsatellite-high colorectal cancer
MSS: Microsatellite stable colorectal cancer
EndometriumThe image shows the transcriptomic changes along malignancy continuum.log2FC in expression of this searched gene in stem-like cells from each diseased tissue sample relative to stem-like cells in normal samples in each tissue plotted against the malignancy continuum. Samples are colored based on if they are from different disease stage.
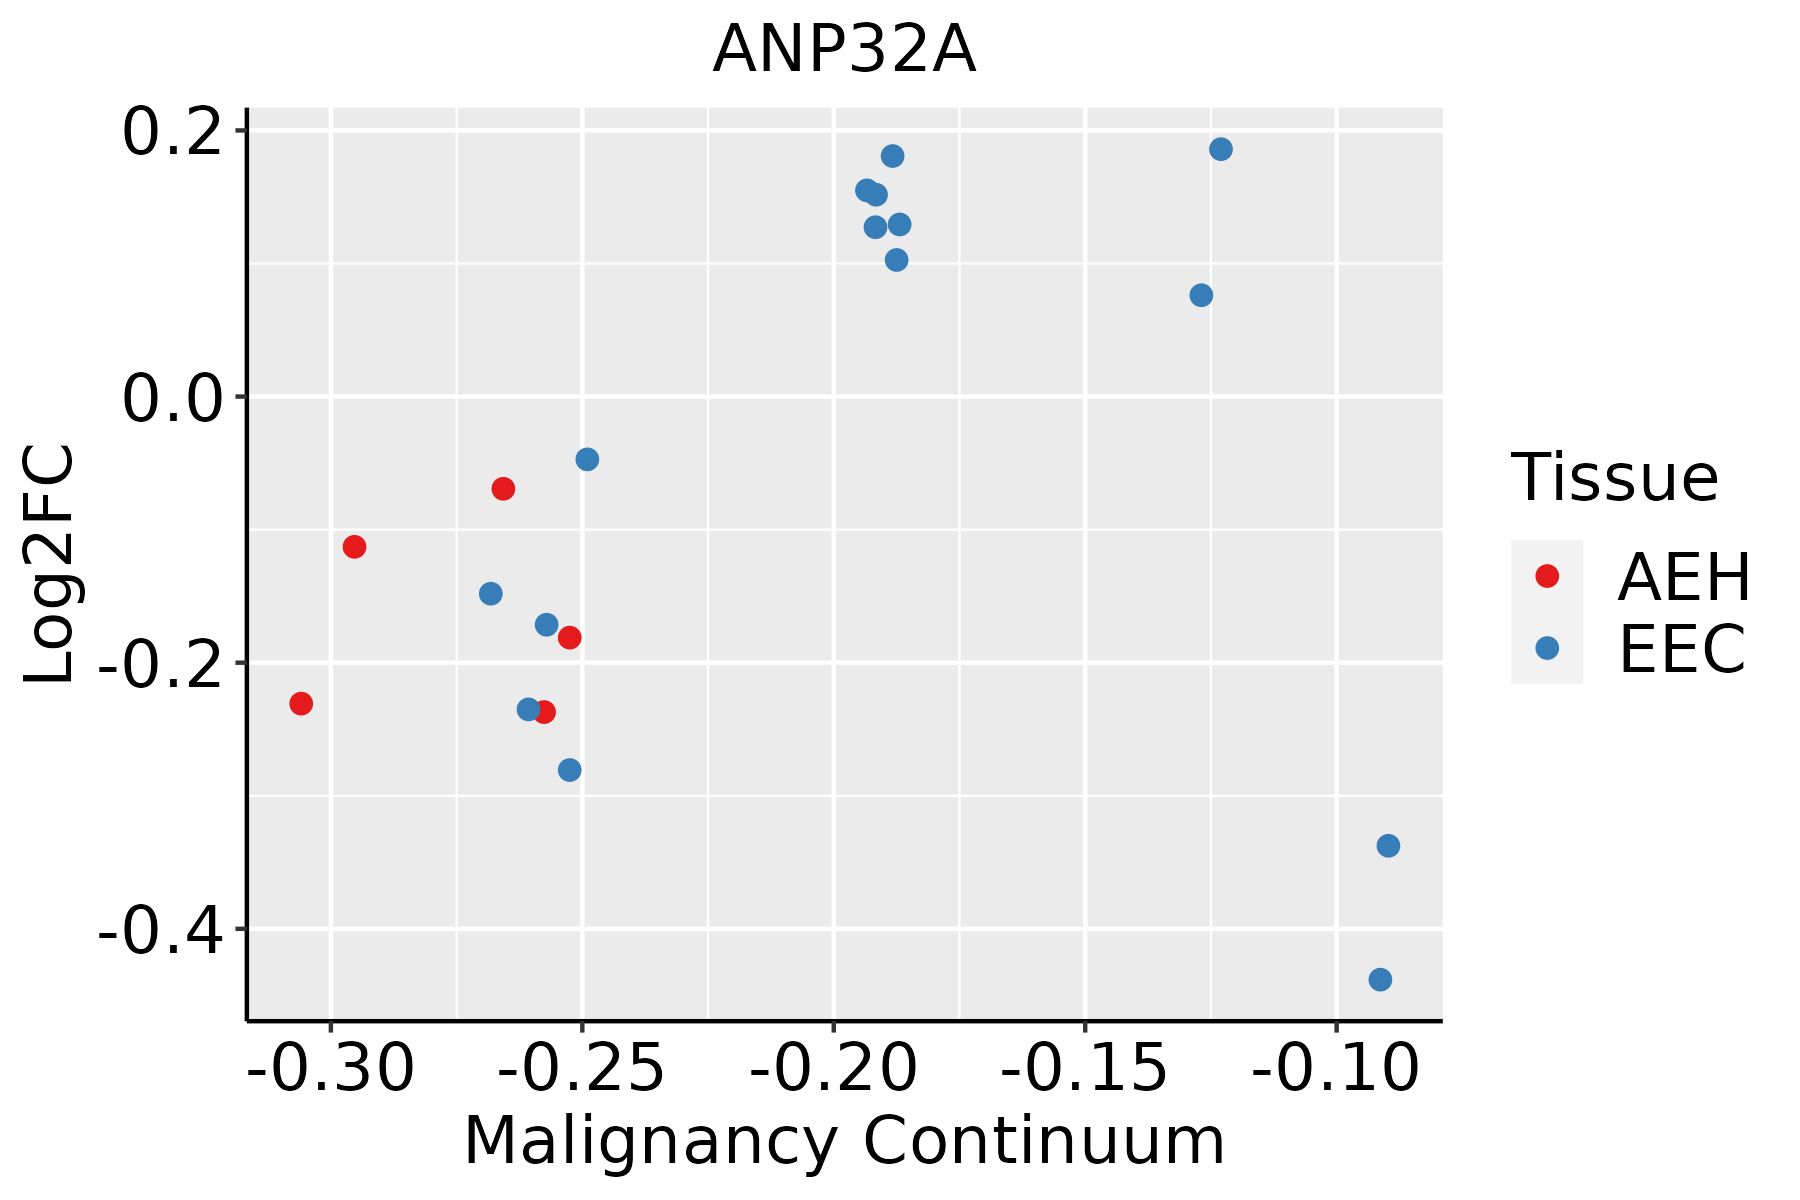
AEH: Atypical endometrial hyperplasia
EEC: Endometrioid Cancer
EsophagusThe image shows the transcriptomic changes along malignancy continuum.log2FC in expression of this searched gene in stem-like cells from each diseased tissue sample relative to stem-like cells in normal samples in each tissue plotted against the malignancy continuum. Samples are colored based on if they are from different disease stage.
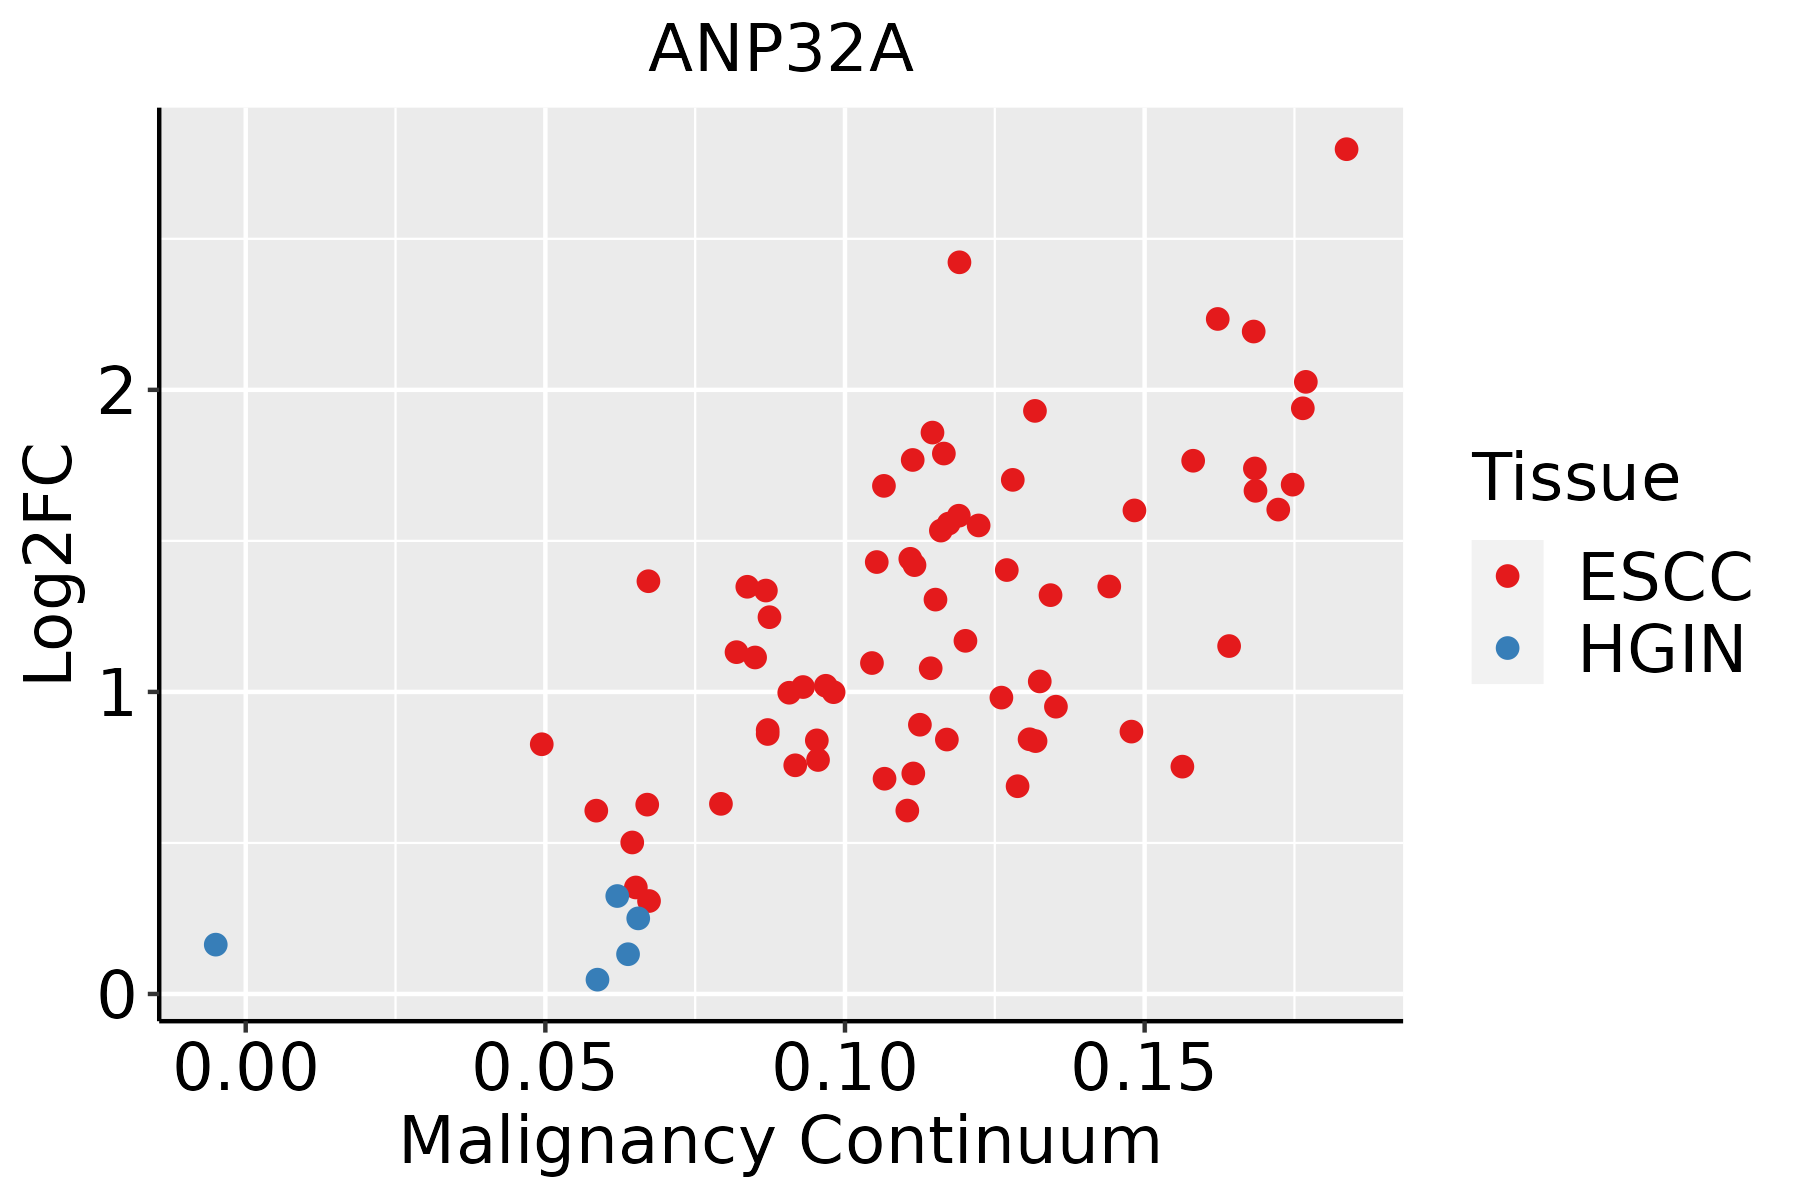
ESCC: Esophageal squamous cell carcinoma
HGIN: High-grade intraepithelial neoplasias
LGIN: Low-grade intraepithelial neoplasias
LiverThe image shows the transcriptomic changes along malignancy continuum.log2FC in expression of this searched gene in stem-like cells from each diseased tissue sample relative to stem-like cells in normal samples in each tissue plotted against the malignancy continuum. Samples are colored based on if they are from different disease stage.
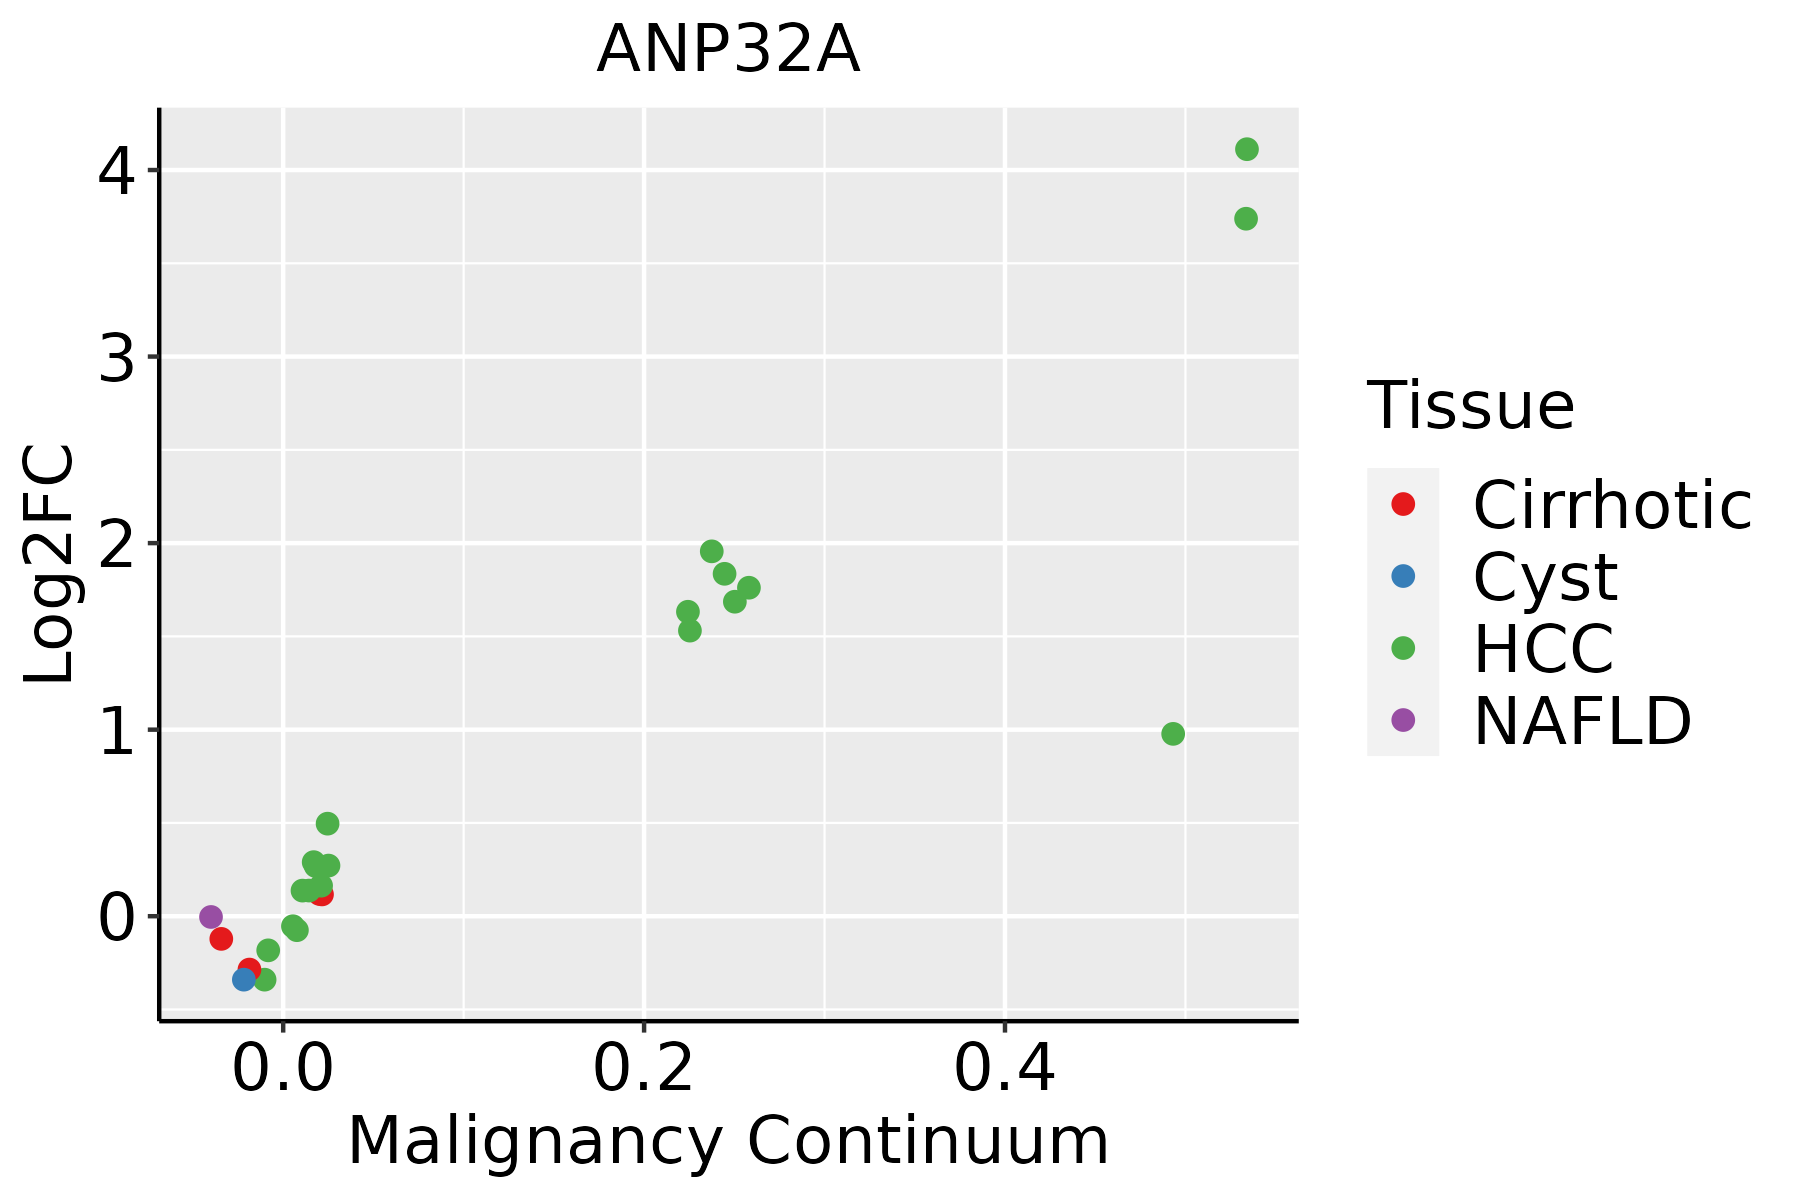
HCC: Hepatocellular carcinoma
NAFLD: Non-alcoholic fatty liver disease
Oral CavityThe image shows the transcriptomic changes along malignancy continuum.log2FC in expression of this searched gene in stem-like cells from each diseased tissue sample relative to stem-like cells in normal samples in each tissue plotted against the malignancy continuum. Samples are colored based on if they are from different disease stage.EOLP: Erosive Oral lichen planus
LP: leukoplakia
NEOLP: Non-erosive oral lichen planus
OSCC: Oral squamous cell carcinoma
ProstateThe image shows the transcriptomic changes along malignancy continuum.log2FC in expression of this searched gene in stem-like cells from each diseased tissue sample relative to stem-like cells in normal samples in each tissue plotted against the malignancy continuum. Samples are colored based on if they are from different disease stage.BPH: Benign Prostatic Hyperplasia
SkinThe image shows the transcriptomic changes along malignancy continuum.log2FC in expression of this searched gene in stem-like cells from each diseased tissue sample relative to stem-like cells in normal samples in each tissue plotted against the malignancy continuum. Samples are colored based on if they are from different disease stage.
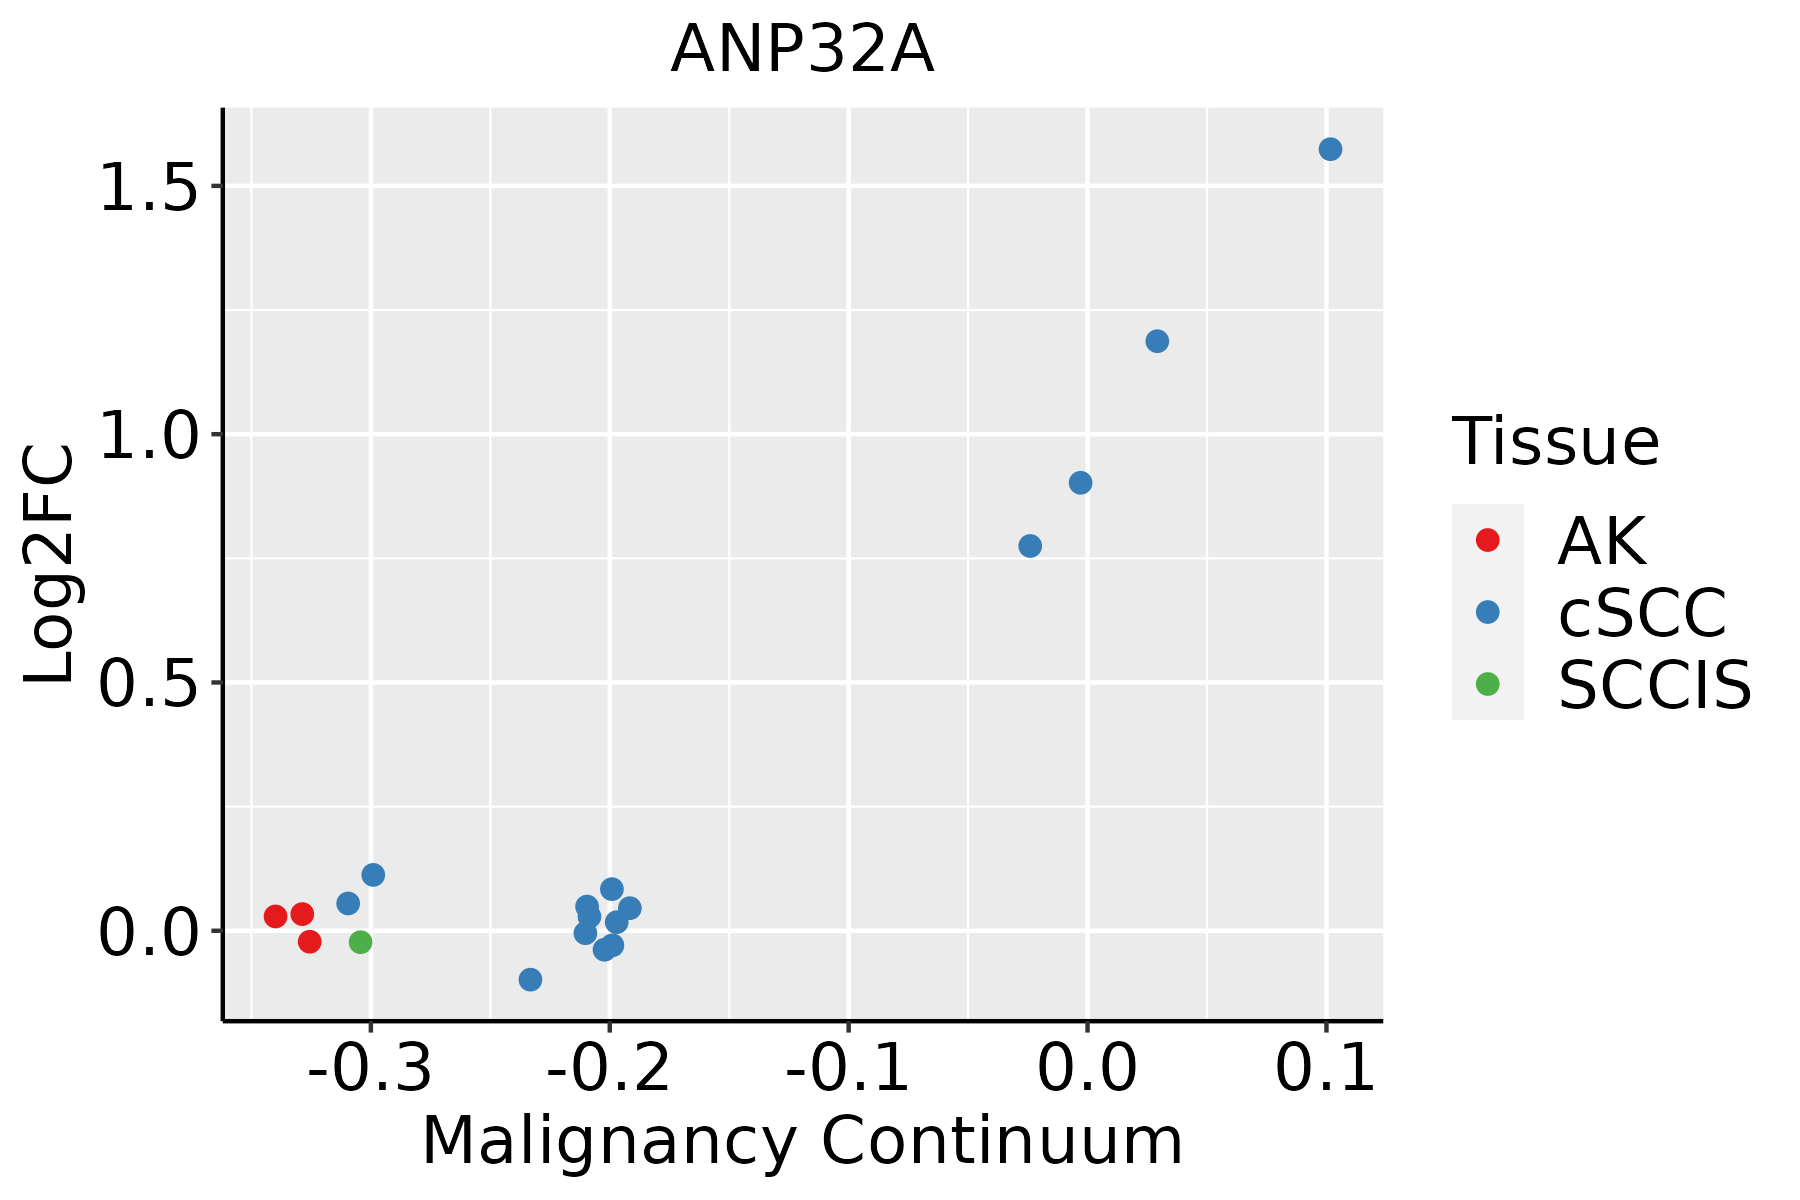
AK: Actinic keratosis
cSCC: Cutaneous squamous cell carcinoma
SCCIS:squamous cell carcinoma in situ
ThyroidThe image shows the transcriptomic changes along malignancy continuum.log2FC in expression of this searched gene in stem-like cells from each diseased tissue sample relative to stem-like cells in normal samples in each tissue plotted against the malignancy continuum. Samples are colored based on if they are from different disease stage.
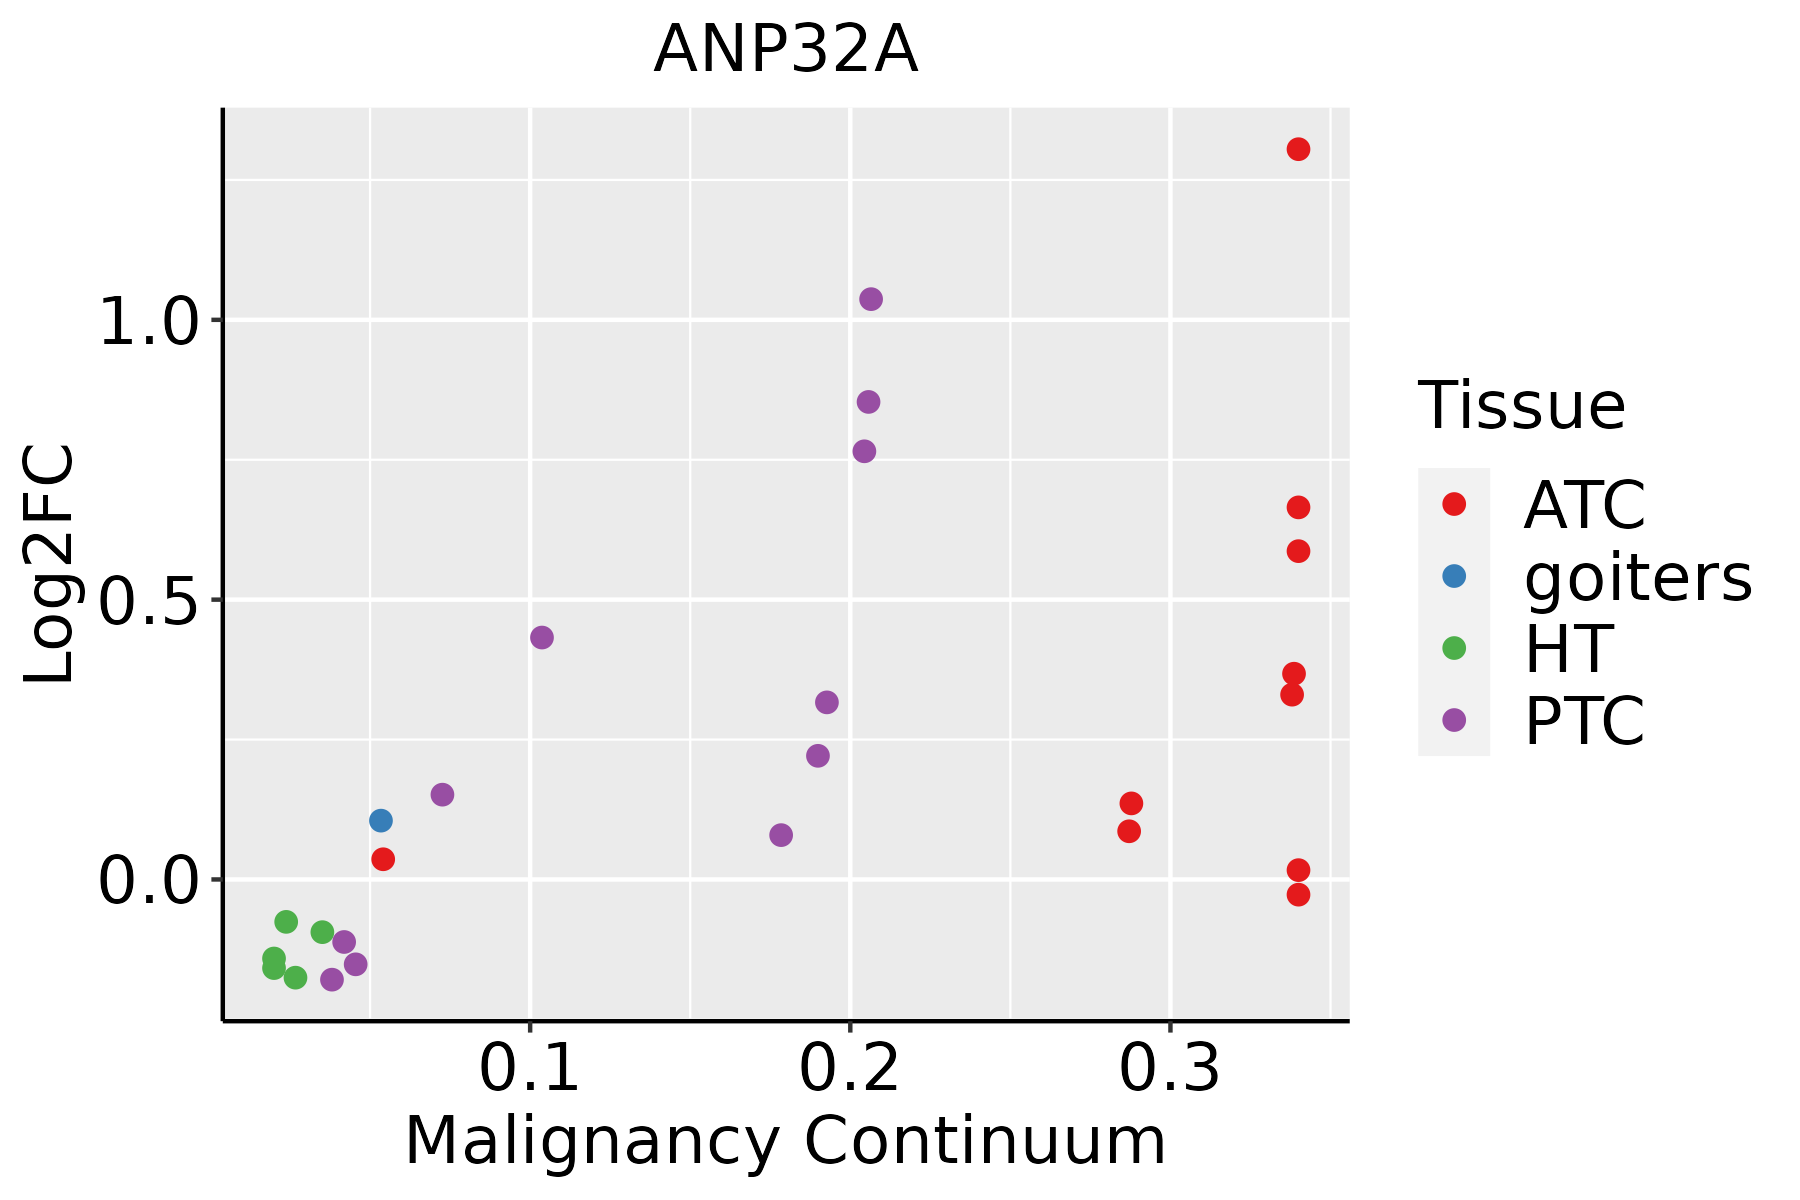
ATC: Anaplastic thyroid cancer
HT: Hashimoto's thyroiditis
PTC: Papillary thyroid cancer
∗log2FC in expression of this searched gene in stem-like cells from each diseased tissue sample relative to stem-like cells in normal samples in each tissue plotted against the malignancy continuum. Samples are colored based on if they are from different disease stage.

Top

Malignant transformation related pathway analysis

check buttonFind out the enriched GO biological processes and KEGG pathways involved in transition from healthy to precancer to cancer
check button Figure of enriched GO biological processes.
TissueDisease StageEnriched GO biological Processes
ColorectumADGO analysis - Figure of enriched GO biological processes: Top 15 enriched GO BP terms are showed in the bar plot of each disease state in each tissue. Each row represents a significant GO biological process which is colored according to the -log10(p.adjust).
ColorectumSERGO analysis - Figure of enriched GO biological processes: Top 15 enriched GO BP terms are showed in the bar plot of each disease state in each tissue. Each row represents a significant GO biological process which is colored according to the -log10(p.adjust).
ColorectumMSSGO analysis - Figure of enriched GO biological processes: Top 15 enriched GO BP terms are showed in the bar plot of each disease state in each tissue. Each row represents a significant GO biological process which is colored according to the -log10(p.adjust).
ColorectumMSI-HGO analysis - Figure of enriched GO biological processes: Top 15 enriched GO BP terms are showed in the bar plot of each disease state in each tissue. Each row represents a significant GO biological process which is colored according to the -log10(p.adjust).
ColorectumFAPGO analysis - Figure of enriched GO biological processes: Top 15 enriched GO BP terms are showed in the bar plot of each disease state in each tissue. Each row represents a significant GO biological process which is colored according to the -log10(p.adjust).
∗Top 15 enriched GO BP terms are showed in the bar plot of each disease state in each tissue. Each row represents a significant GO biological process which is colored according to the -log10(p.adjust).
Page: 1 2 3 4 5 6 7 8 9 

check button Enriched GO biological processes.
GO IDTissueDisease StageDescriptionGene RatioBg Ratiopvaluep.adjustCount
GO:0006913ColorectumADnucleocytoplasmic transport102/3918301/187231.00e-074.85e-06102
GO:0051169ColorectumADnuclear transport102/3918301/187231.00e-074.85e-06102
GO:00069131ColorectumSERnucleocytoplasmic transport77/2897301/187233.39e-061.32e-0477
GO:00511691ColorectumSERnuclear transport77/2897301/187233.39e-061.32e-0477
GO:00069132ColorectumMSSnucleocytoplasmic transport99/3467301/187231.35e-091.03e-0799
GO:00511692ColorectumMSSnuclear transport99/3467301/187231.35e-091.03e-0799
GO:00069134ColorectumFAPnucleocytoplasmic transport77/2622301/187236.15e-084.54e-0677
GO:00511694ColorectumFAPnuclear transport77/2622301/187236.15e-084.54e-0677
GO:00069135ColorectumCRCnucleocytoplasmic transport57/2078301/187233.71e-059.18e-0457
GO:00511695ColorectumCRCnuclear transport57/2078301/187233.71e-059.18e-0457
GO:000691310EndometriumAEHnucleocytoplasmic transport54/2100301/187233.24e-043.62e-0354
GO:005116910EndometriumAEHnuclear transport54/2100301/187233.24e-043.62e-0354
GO:000691314EndometriumEECnucleocytoplasmic transport59/2168301/187233.31e-055.65e-0459
GO:005116914EndometriumEECnuclear transport59/2168301/187233.31e-055.65e-0459
GO:0006913110EsophagusESCCnucleocytoplasmic transport230/8552301/187236.04e-282.02e-25230
GO:0051169110EsophagusESCCnuclear transport230/8552301/187236.04e-282.02e-25230
GO:000691312LiverCirrhoticnucleocytoplasmic transport118/4634301/187231.71e-086.27e-07118
GO:005116912LiverCirrhoticnuclear transport118/4634301/187231.71e-086.27e-07118
GO:000691322LiverHCCnucleocytoplasmic transport208/7958301/187235.51e-218.12e-19208
GO:005116922LiverHCCnuclear transport208/7958301/187235.51e-218.12e-19208
Page: 1 2 

check button Enriched KEGG pathways.
Pathway IDTissueDisease StageDescriptionGene RatioBg Ratiopvaluep.adjustqvalueCount
Page: 1 

Top

Cell-cell communication analysis

check buttonIdentification of potential cell-cell interactions between two cell types and their ligand-receptor pairs for different disease states
LigandReceptorLRpairPathwayTissueDisease Stage
Page: 1 

Top

Single-cell gene regulatory network inference analysis

check buttonFind out the significant the regulons (TFs) and the target genes of each regulon across cell types for different disease states
TFCell TypeTissueDisease StageTarget GeneRSSRegulon Activity
∗The dot plots of a searched regulon are shown for all cell subpopulations in each disease state of each tissue based on the regulon specific score inferred using pySCENIC and by calculating the average expression.
Page: 1 

Top

Somatic mutation of malignant transformation related genes

check buttonAnnotation of somatic variants for genes involved in malignant transformation
Hugo SymbolVariant ClassVariant ClassificationdbSNP RSHGVScHGVSpHGVSp ShortSWISSPROTBIOTYPESIFTPolyPhenTumor Sample BarcodeTissueHistologySexAgeStageTherapy TypesDrugsOutcome
ANP32ASNVMissense_Mutationnovelc.206N>Gp.Leu69Argp.L69RP39687protein_codingdeleterious(0)probably_damaging(1)TCGA-AQ-A54O-01Breastbreast invasive carcinomaMale<65I/IIChemotherapyadriamycinCR
ANP32AinsertionFrame_Shift_Insnovelc.412_413insATAAp.Leu138HisfsTer13p.L138Hfs*13P39687protein_codingTCGA-A2-A0D1-01Breastbreast invasive carcinomaFemale>=65I/IIChemotherapytaxotereSD
ANP32AinsertionFrame_Shift_Insnovelc.411_412insTCCCATGCTCATGGAAATATCCTGAGATTCTCCAACTGp.Leu138SerfsTer61p.L138Sfs*61P39687protein_codingTCGA-A2-A0D1-01Breastbreast invasive carcinomaFemale>=65I/IIChemotherapytaxotereSD
ANP32ASNVMissense_Mutationnovelc.739N>Ap.Asp247Asnp.D247NP39687protein_codingdeleterious_low_confidence(0.02)benign(0.048)TCGA-VS-A8EL-01Cervixcervical & endocervical cancerFemale<65I/IIChemotherapycisplatinCR
ANP32ASNVMissense_Mutationc.311G>Ap.Ser104Asnp.S104NP39687protein_codingtolerated(0.1)benign(0.014)TCGA-AA-3864-01Colorectumcolon adenocarcinomaMale>=65I/IIUnknownUnknownSD
ANP32ASNVMissense_Mutationc.646N>Ap.Asp216Asnp.D216NP39687protein_codingtolerated_low_confidence(0.14)benign(0.01)TCGA-EI-6882-01Colorectumrectum adenocarcinomaMale<65I/IIUnknownUnknownSD
ANP32ASNVMissense_Mutationnovelc.638N>Ap.Gly213Aspp.G213DP39687protein_codingtolerated(0.28)benign(0.001)TCGA-A5-A0G2-01Endometriumuterine corpus endometrioid carcinomaFemale<65III/IVUnknownUnknownSD
ANP32ASNVMissense_Mutationnovelc.348N>Tp.Lys116Asnp.K116NP39687protein_codingdeleterious(0)possibly_damaging(0.891)TCGA-A5-A0G2-01Endometriumuterine corpus endometrioid carcinomaFemale<65III/IVUnknownUnknownSD
ANP32ASNVMissense_Mutationnovelc.731N>Gp.Glu244Glyp.E244GP39687protein_codingtolerated_low_confidence(0.06)benign(0)TCGA-AP-A0LS-01Endometriumuterine corpus endometrioid carcinomaFemale<65I/IIUnknownUnknownSD
ANP32ASNVMissense_Mutationnovelc.113N>Tp.Thr38Ilep.T38IP39687protein_codingdeleterious(0.02)possibly_damaging(0.879)TCGA-AX-A3G8-01Endometriumuterine corpus endometrioid carcinomaFemale>=65I/IIUnknownUnknownSD
Page: 1 2 3 

Top

Related drugs of malignant transformation related genes

check buttonIdentification of chemicals and drugs interact with genes involved in malignant transfromation
(DGIdb 4.0)
Entrez IDSymbolCategoryInteraction TypesDrug Claim NameDrug NamePMIDs
Page: 1