
|
|||||
|
 | |
| |
| |
| |
| |
| |
|
Gene: AKT1S1 |
Gene summary for AKT1S1 |
| Gene information | Species | Human | Gene symbol | AKT1S1 | Gene ID | 84335 |
| Gene name | AKT1 substrate 1 | |
| Gene Alias | Lobe | |
| Cytomap | 19q13.33 | |
| Gene Type | protein-coding | GO ID | GO:0001932 | UniProtAcc | A0A024QZF6 |
Top |
Malignant transformation analysis |
| Identification of the aberrant gene expression in precancerous and cancerous lesions by comparing the gene expression of stem-like cells in diseased tissues with normal stem cells |
| Entrez ID | Symbol | Replicates | Species | Organ | Tissue | Adj P-value | Log2FC | Malignancy |
| 84335 | AKT1S1 | P4_S8_cSCC | Human | Skin | cSCC | 3.41e-02 | 2.06e-02 | -0.3095 |
| 84335 | AKT1S1 | P5_S10_cSCC | Human | Skin | cSCC | 2.82e-04 | 9.91e-02 | -0.299 |
| 84335 | AKT1S1 | P1_cSCC | Human | Skin | cSCC | 1.42e-28 | 8.93e-01 | 0.0292 |
| 84335 | AKT1S1 | P2_cSCC | Human | Skin | cSCC | 5.72e-20 | 5.36e-01 | -0.024 |
| 84335 | AKT1S1 | P4_cSCC | Human | Skin | cSCC | 1.34e-16 | 5.34e-01 | -0.00290000000000005 |
| 84335 | AKT1S1 | P10_cSCC | Human | Skin | cSCC | 7.77e-19 | 6.01e-01 | 0.1017 |
| 84335 | AKT1S1 | cSCC_p8 | Human | Skin | cSCC | 2.80e-02 | 1.02e-01 | -0.1971 |
| 84335 | AKT1S1 | cSCC_p9 | Human | Skin | cSCC | 1.97e-03 | 1.07e-01 | -0.1991 |
| 84335 | AKT1S1 | male-WTA | Human | Thyroid | PTC | 2.48e-18 | 1.17e-01 | 0.1037 |
| 84335 | AKT1S1 | PTC01 | Human | Thyroid | PTC | 2.32e-10 | 1.47e-01 | 0.1899 |
| 84335 | AKT1S1 | PTC04 | Human | Thyroid | PTC | 3.00e-06 | 8.22e-02 | 0.1927 |
| 84335 | AKT1S1 | PTC05 | Human | Thyroid | PTC | 2.87e-07 | 2.99e-01 | 0.2065 |
| 84335 | AKT1S1 | PTC06 | Human | Thyroid | PTC | 3.68e-17 | 3.20e-01 | 0.2057 |
| 84335 | AKT1S1 | PTC07 | Human | Thyroid | PTC | 8.42e-15 | 2.52e-01 | 0.2044 |
| 84335 | AKT1S1 | ATC09 | Human | Thyroid | ATC | 5.47e-05 | 1.49e-01 | 0.2871 |
| 84335 | AKT1S1 | ATC12 | Human | Thyroid | ATC | 3.82e-12 | 1.31e-01 | 0.34 |
| 84335 | AKT1S1 | ATC13 | Human | Thyroid | ATC | 1.45e-15 | 3.60e-01 | 0.34 |
| 84335 | AKT1S1 | ATC1 | Human | Thyroid | ATC | 8.73e-06 | 1.84e-01 | 0.2878 |
| 84335 | AKT1S1 | ATC2 | Human | Thyroid | ATC | 3.34e-11 | 5.02e-01 | 0.34 |
| 84335 | AKT1S1 | ATC4 | Human | Thyroid | ATC | 3.55e-10 | 1.59e-01 | 0.34 |
| Page: 1 2 3 4 5 6 7 8 |
| Tissue | Expression Dynamics | Abbreviation |
| Colorectum (GSE201348) | 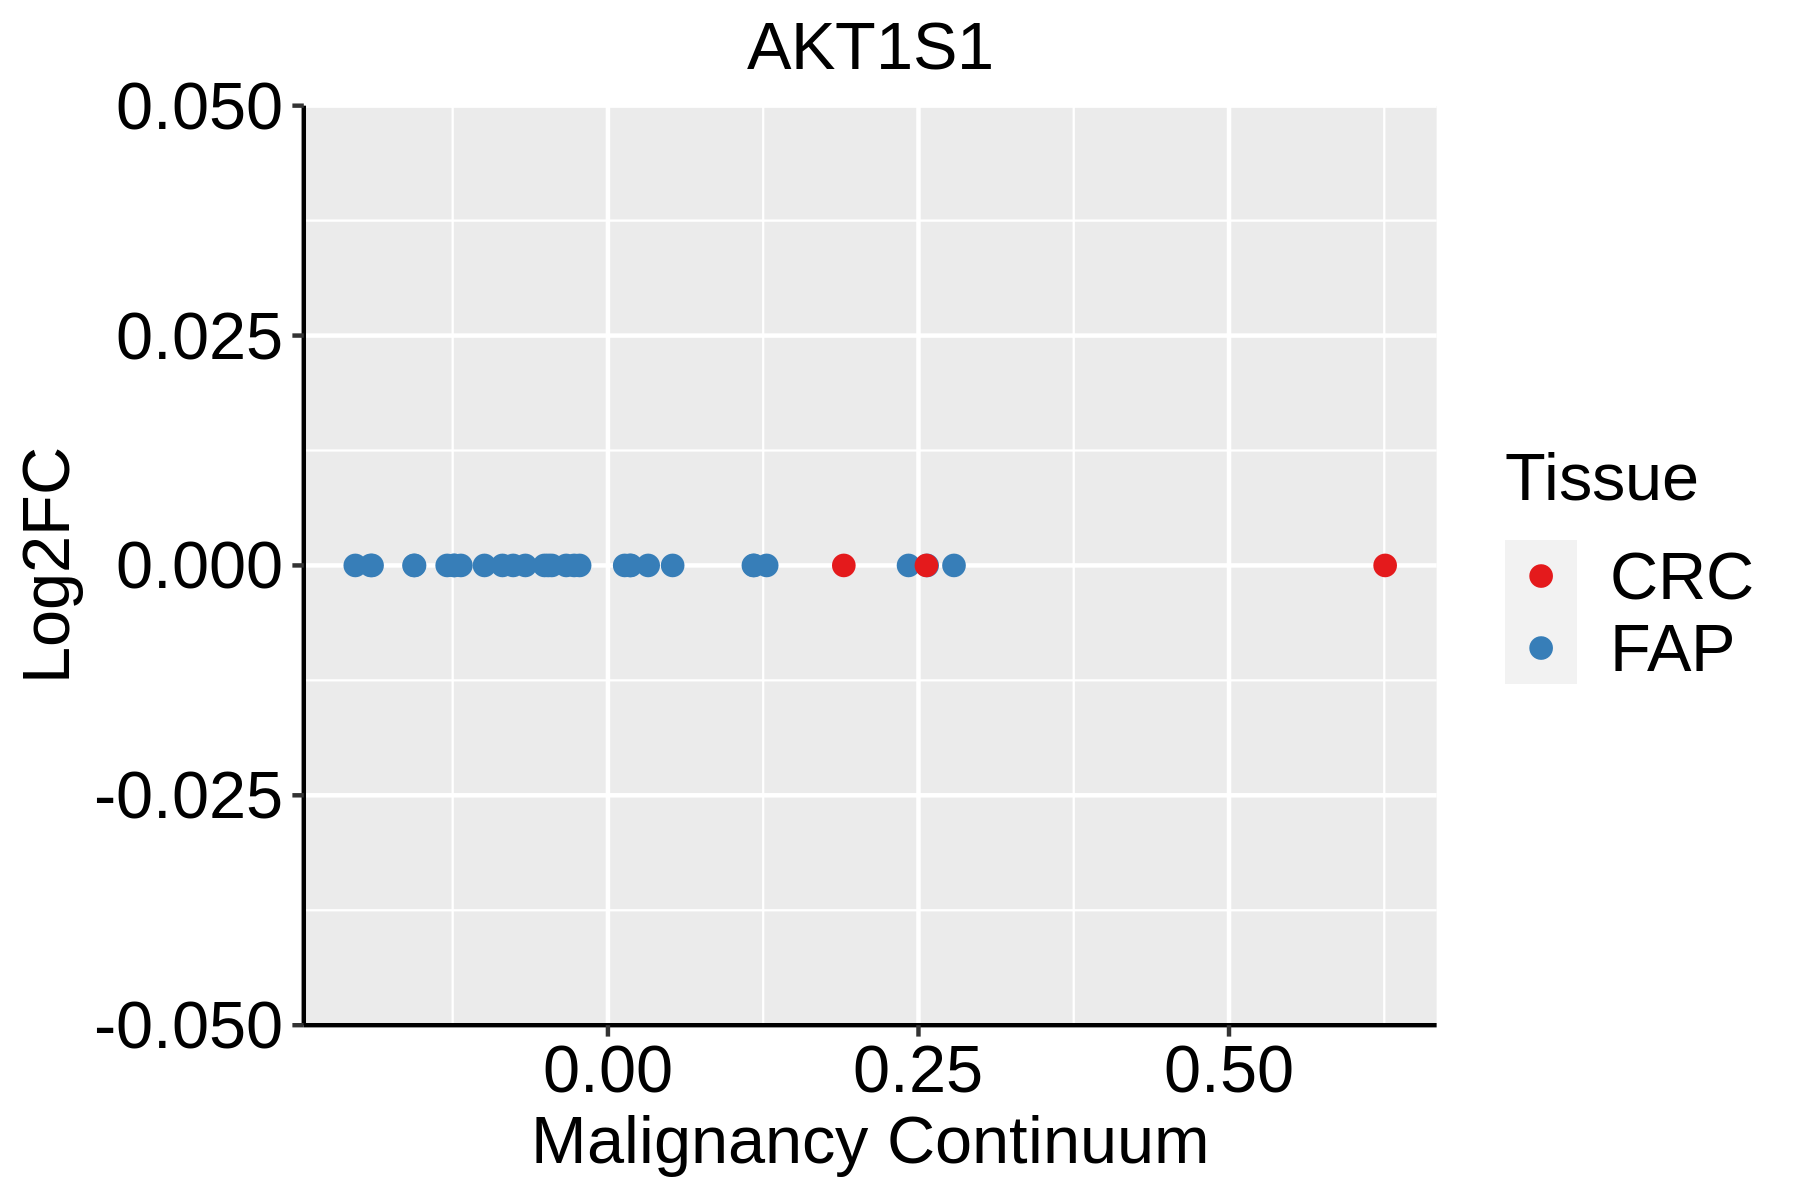 | FAP: Familial adenomatous polyposis |
| CRC: Colorectal cancer | ||
| Colorectum (HTA11) | 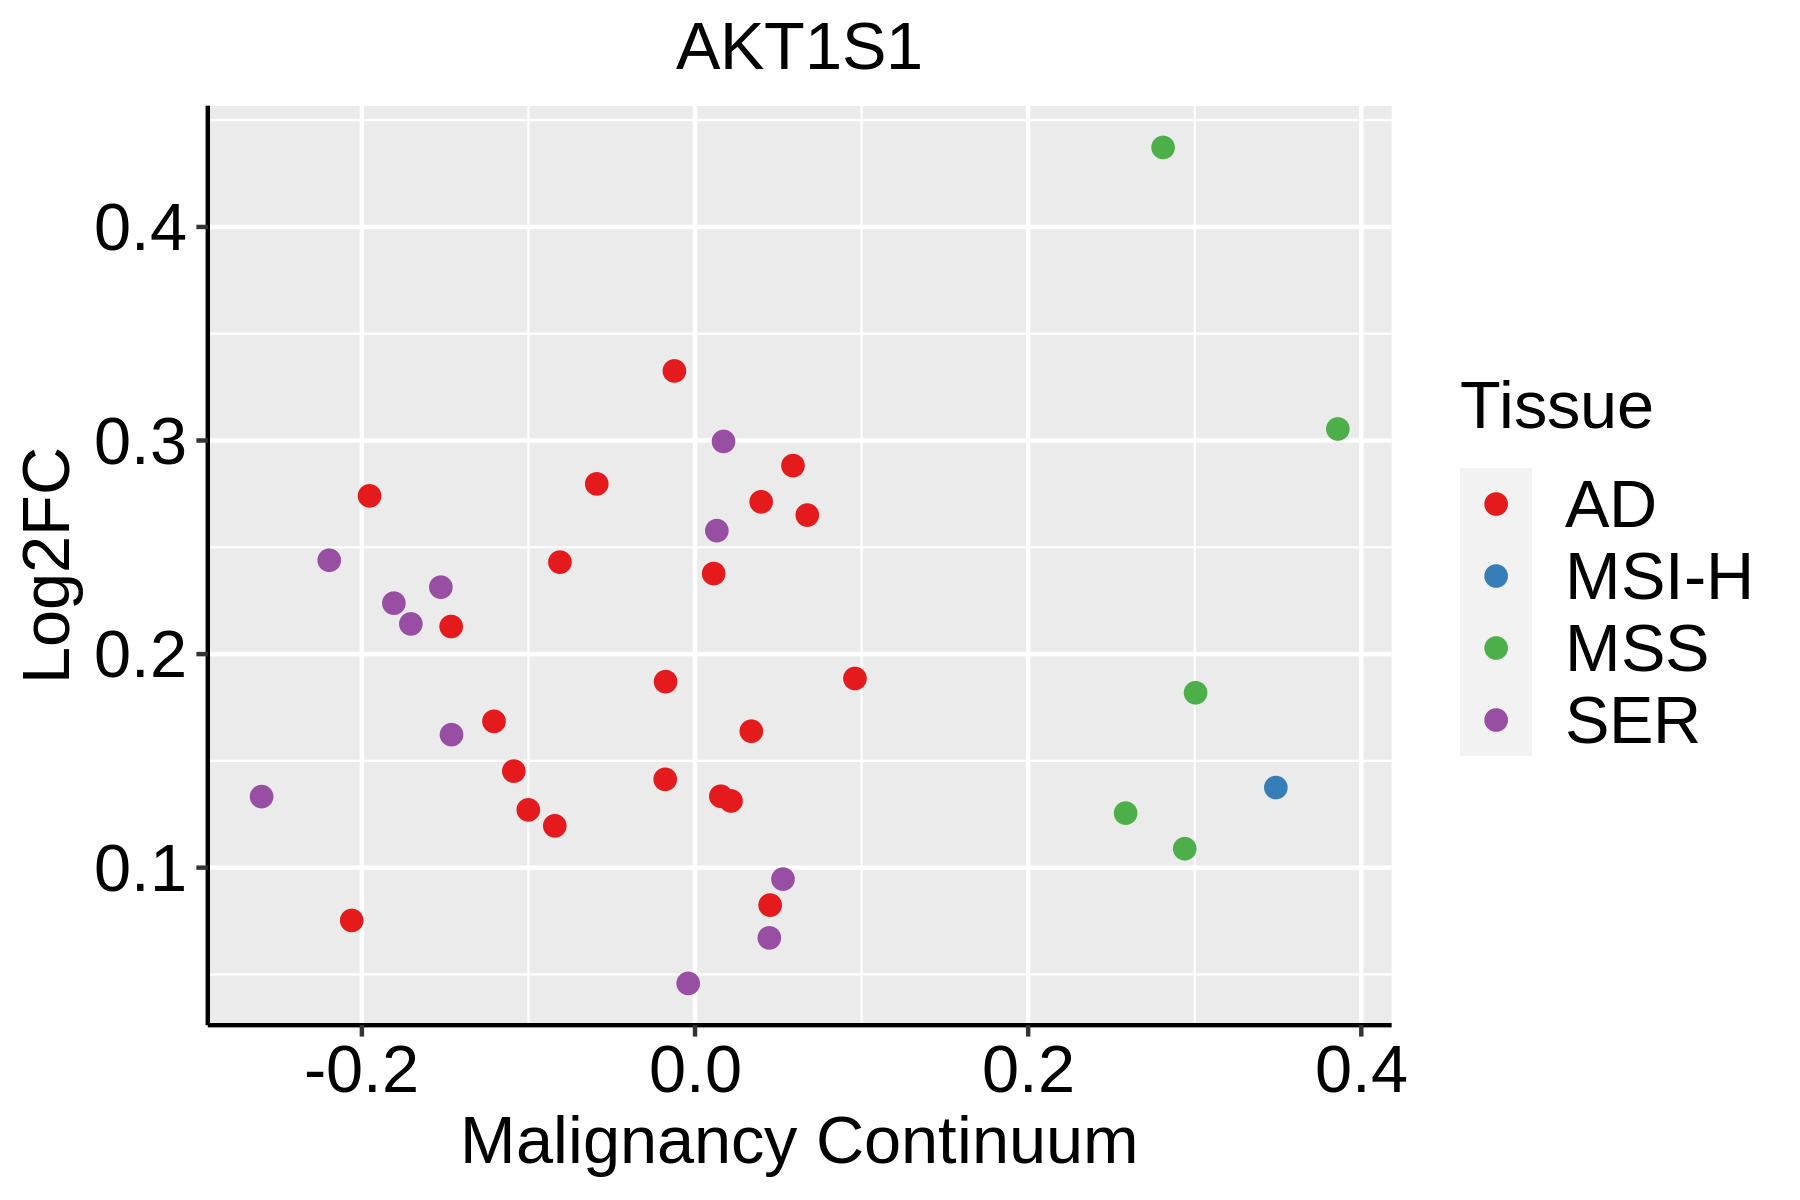 | AD: Adenomas |
| SER: Sessile serrated lesions | ||
| MSI-H: Microsatellite-high colorectal cancer | ||
| MSS: Microsatellite stable colorectal cancer | ||
| Esophagus |  | ESCC: Esophageal squamous cell carcinoma |
| HGIN: High-grade intraepithelial neoplasias | ||
| LGIN: Low-grade intraepithelial neoplasias | ||
| Liver | 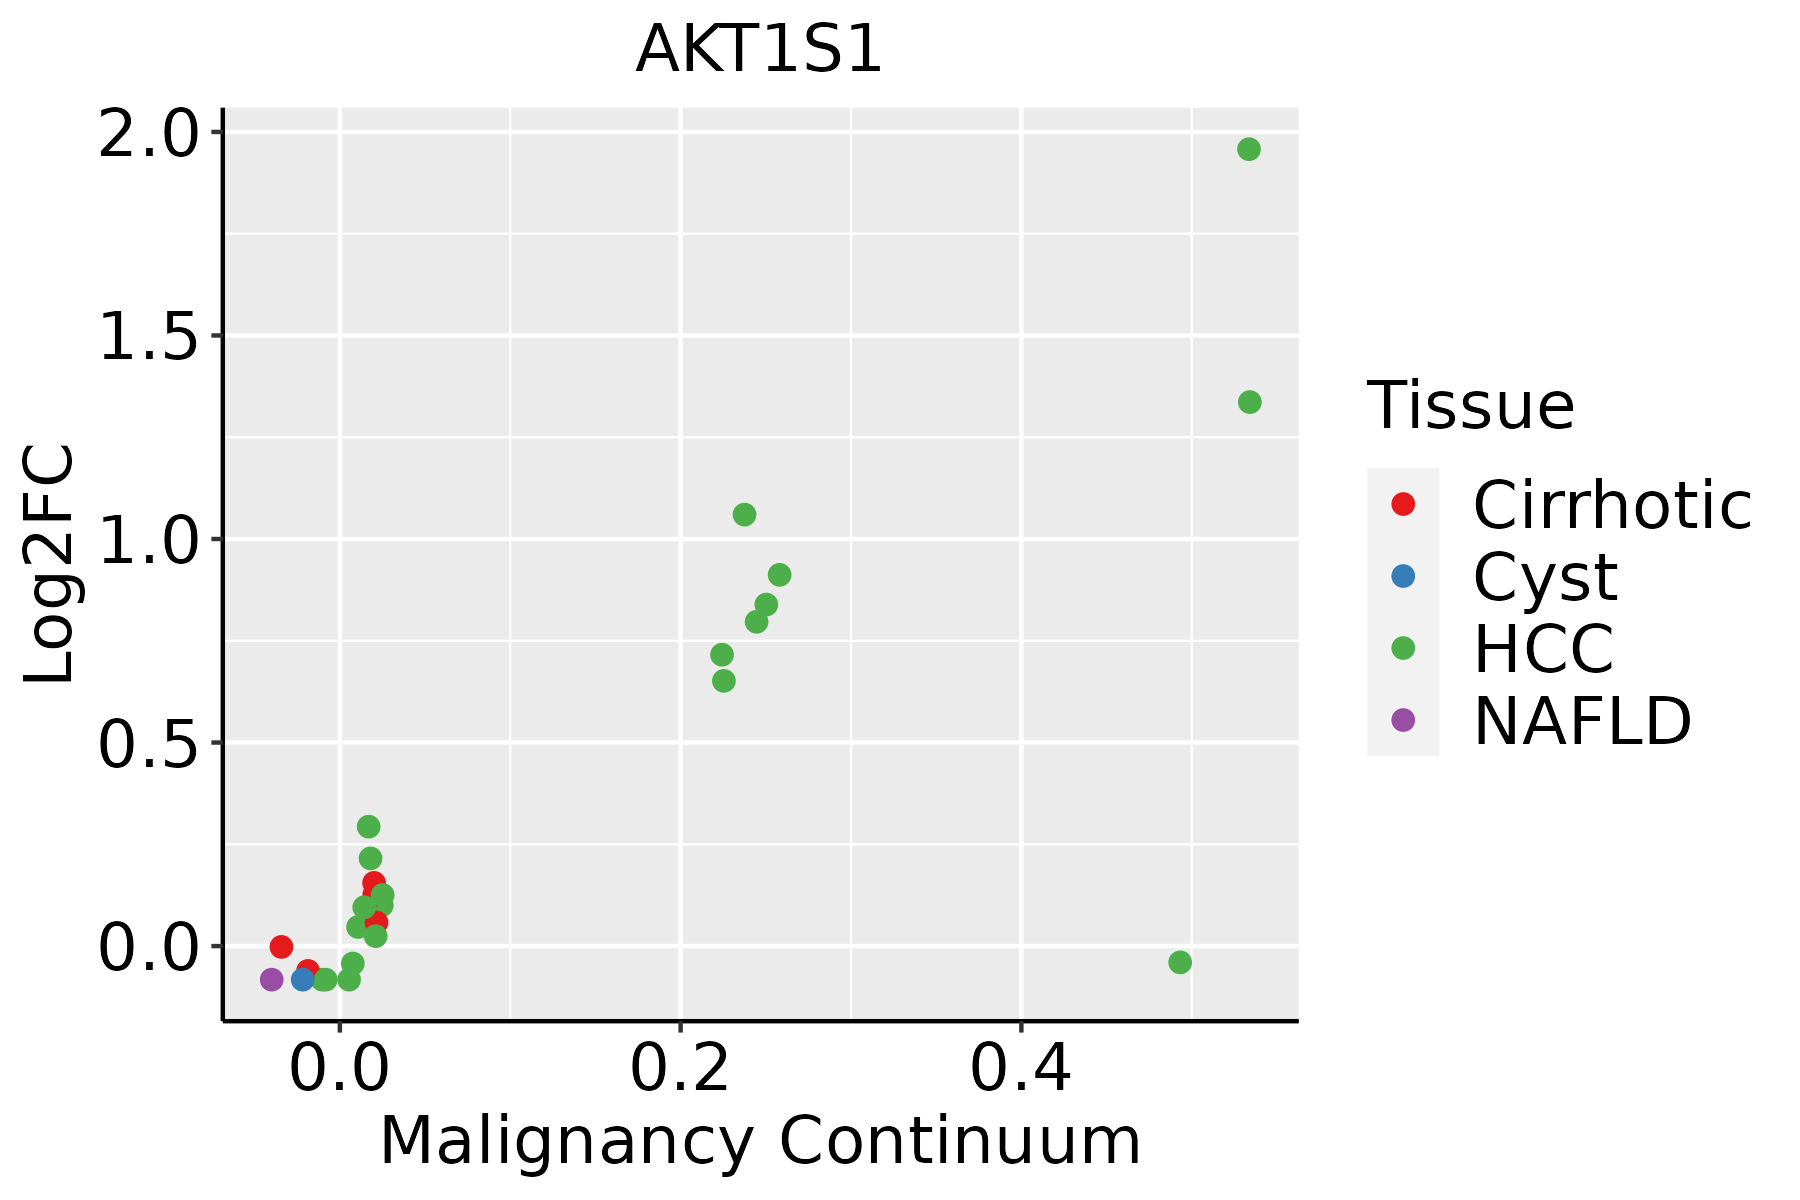 | HCC: Hepatocellular carcinoma |
| NAFLD: Non-alcoholic fatty liver disease | ||
| Oral Cavity | 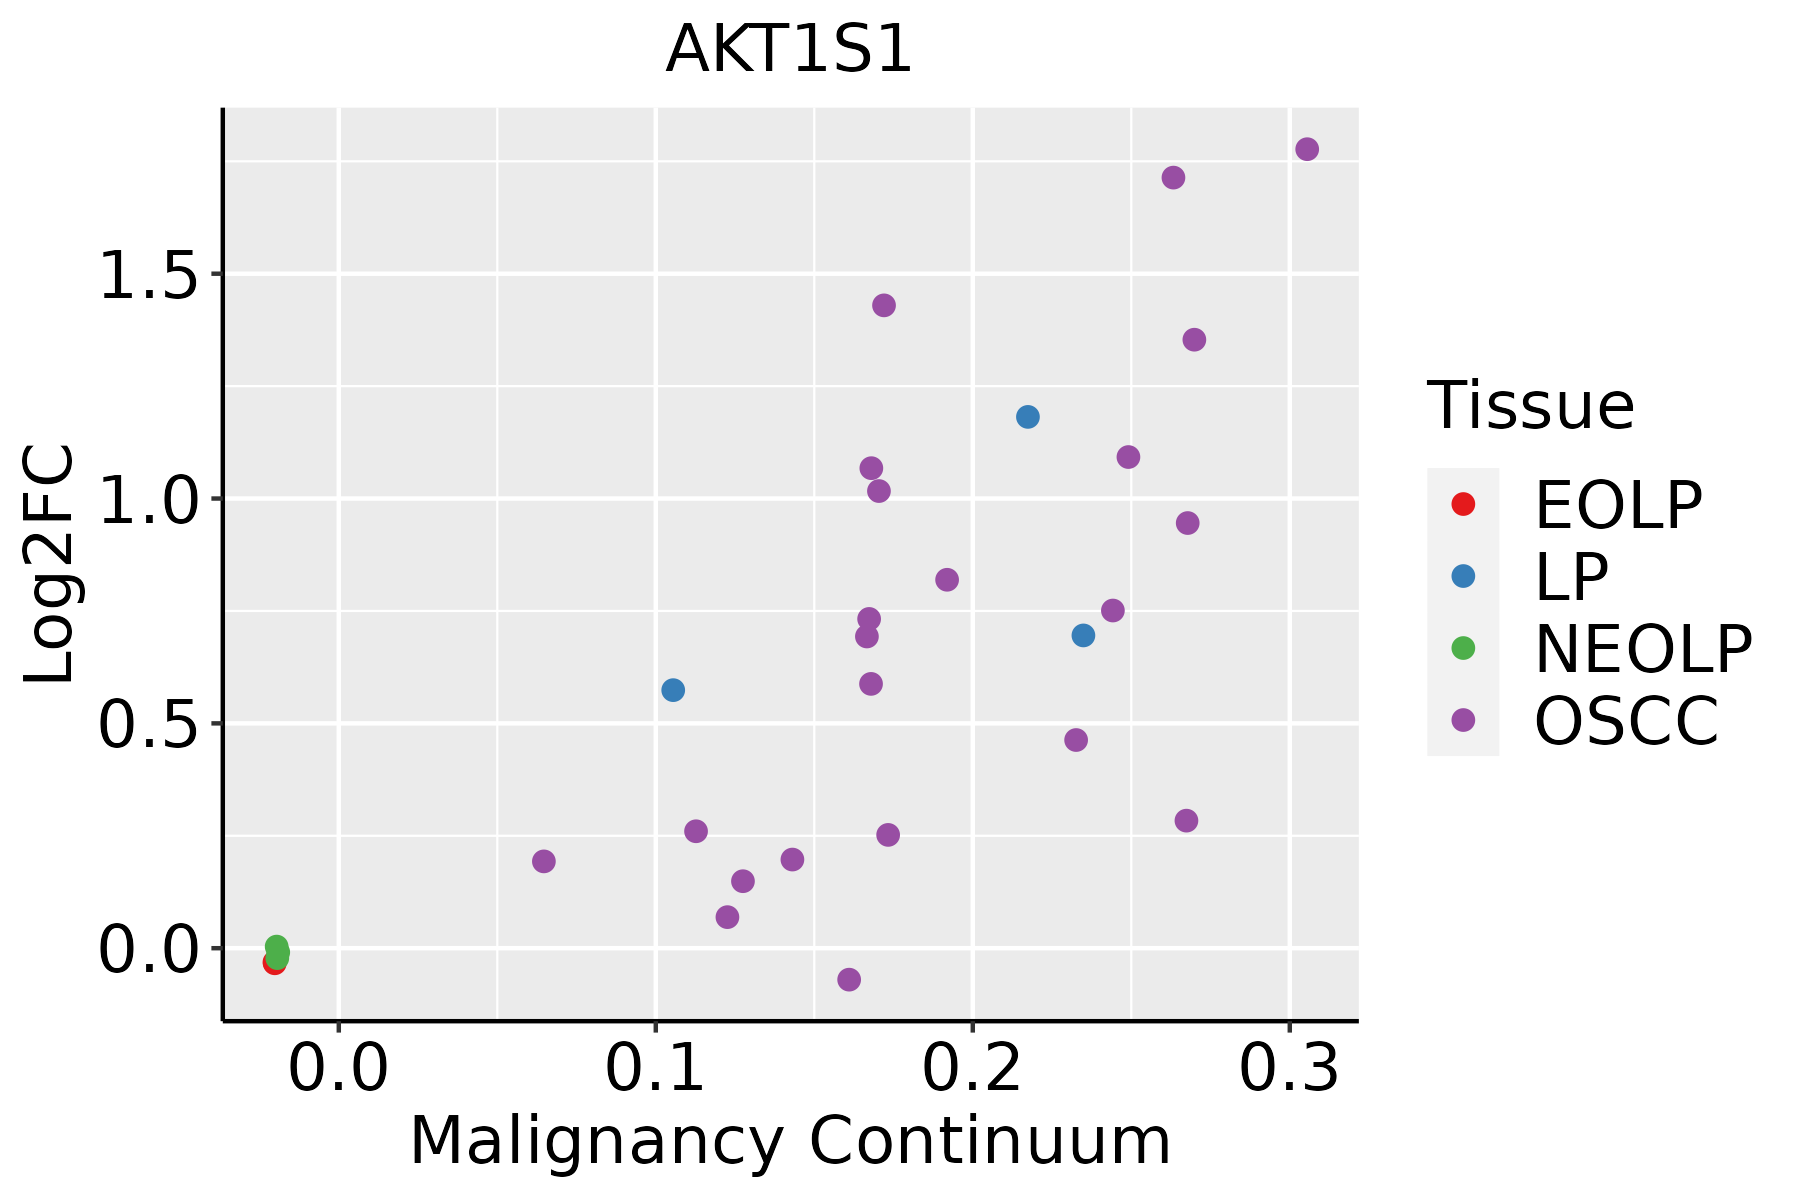 | EOLP: Erosive Oral lichen planus |
| LP: leukoplakia | ||
| NEOLP: Non-erosive oral lichen planus | ||
| OSCC: Oral squamous cell carcinoma | ||
| Skin |  | AK: Actinic keratosis |
| cSCC: Cutaneous squamous cell carcinoma | ||
| SCCIS:squamous cell carcinoma in situ | ||
| Thyroid | 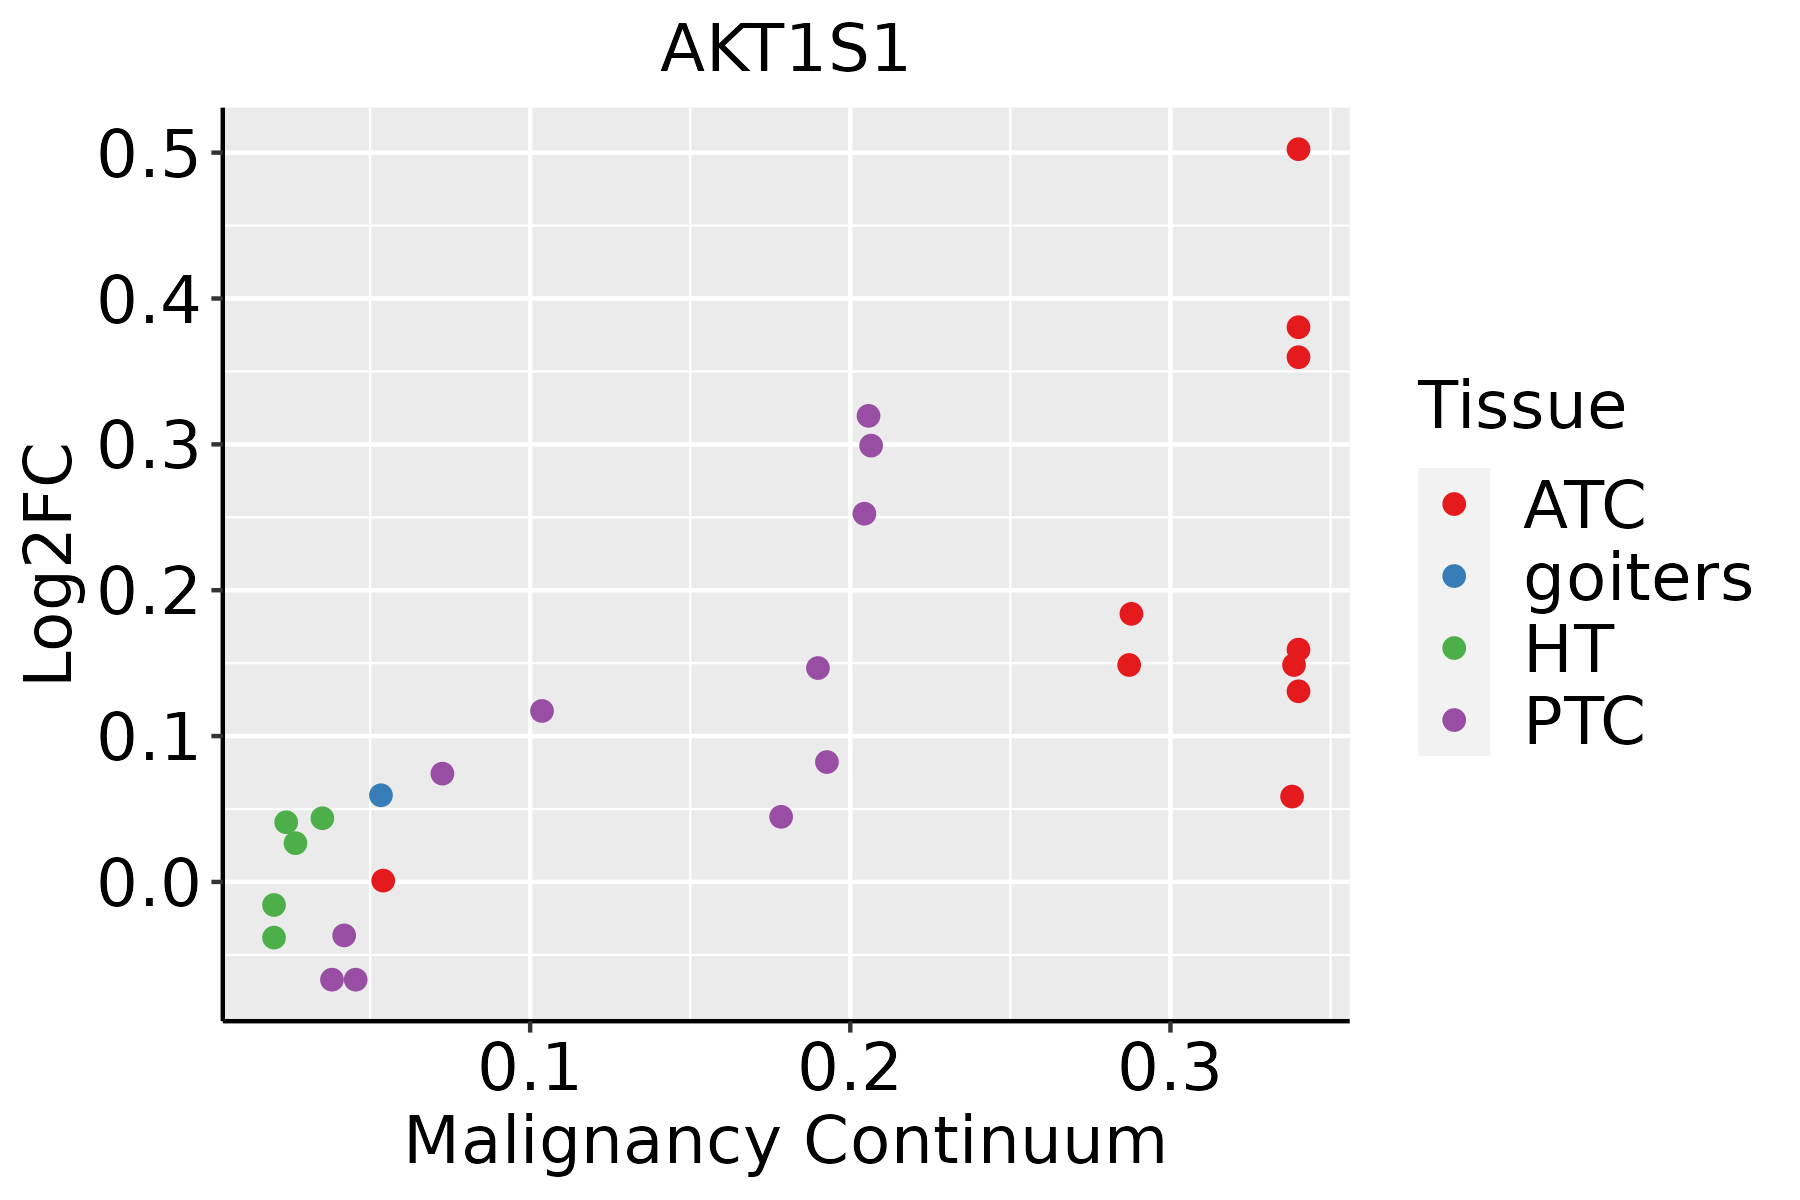 | ATC: Anaplastic thyroid cancer |
| HT: Hashimoto's thyroiditis | ||
| PTC: Papillary thyroid cancer |
| ∗log2FC in expression of this searched gene in stem-like cells from each diseased tissue sample relative to stem-like cells in normal samples in each tissue plotted against the malignancy continuum. Samples are colored based on if they are from different disease stage. |
Top |
Malignant transformation related pathway analysis |
| Find out the enriched GO biological processes and KEGG pathways involved in transition from healthy to precancer to cancer |
| Tissue | Disease Stage | Enriched GO biological Processes |
| Colorectum | AD |  |
| Colorectum | SER |  |
| Colorectum | MSS |  |
| Colorectum | MSI-H |  |
| Colorectum | FAP |  |
| ∗Top 15 enriched GO BP terms are showed in the bar plot of each disease state in each tissue. Each row represents a significant GO biological process which is colored according to the -log10(p.adjust). |
| Page: 1 2 3 4 5 6 7 8 9 |
| GO ID | Tissue | Disease Stage | Description | Gene Ratio | Bg Ratio | pvalue | p.adjust | Count |
| GO:0032535 | Colorectum | AD | regulation of cellular component size | 142/3918 | 383/18723 | 1.74e-13 | 3.41e-11 | 142 |
| GO:0070997 | Colorectum | AD | neuron death | 114/3918 | 361/18723 | 1.13e-06 | 3.72e-05 | 114 |
| GO:0010563 | Colorectum | AD | negative regulation of phosphorus metabolic process | 130/3918 | 442/18723 | 1.26e-05 | 2.76e-04 | 130 |
| GO:1901214 | Colorectum | AD | regulation of neuron death | 99/3918 | 319/18723 | 1.26e-05 | 2.76e-04 | 99 |
| GO:0045936 | Colorectum | AD | negative regulation of phosphate metabolic process | 129/3918 | 441/18723 | 1.81e-05 | 3.76e-04 | 129 |
| GO:0051348 | Colorectum | AD | negative regulation of transferase activity | 85/3918 | 268/18723 | 2.07e-05 | 4.19e-04 | 85 |
| GO:0042326 | Colorectum | AD | negative regulation of phosphorylation | 112/3918 | 385/18723 | 8.02e-05 | 1.27e-03 | 112 |
| GO:0051402 | Colorectum | AD | neuron apoptotic process | 77/3918 | 246/18723 | 8.07e-05 | 1.28e-03 | 77 |
| GO:0001933 | Colorectum | AD | negative regulation of protein phosphorylation | 101/3918 | 342/18723 | 9.39e-05 | 1.42e-03 | 101 |
| GO:0006469 | Colorectum | AD | negative regulation of protein kinase activity | 65/3918 | 212/18723 | 5.21e-04 | 5.62e-03 | 65 |
| GO:0033673 | Colorectum | AD | negative regulation of kinase activity | 71/3918 | 237/18723 | 6.18e-04 | 6.47e-03 | 71 |
| GO:0043523 | Colorectum | AD | regulation of neuron apoptotic process | 64/3918 | 212/18723 | 8.95e-04 | 8.63e-03 | 64 |
| GO:0008361 | Colorectum | AD | regulation of cell size | 56/3918 | 181/18723 | 9.61e-04 | 9.07e-03 | 56 |
| GO:00325351 | Colorectum | SER | regulation of cellular component size | 115/2897 | 383/18723 | 3.04e-13 | 1.10e-10 | 115 |
| GO:00513481 | Colorectum | SER | negative regulation of transferase activity | 70/2897 | 268/18723 | 4.27e-06 | 1.62e-04 | 70 |
| GO:00105631 | Colorectum | SER | negative regulation of phosphorus metabolic process | 101/2897 | 442/18723 | 2.39e-05 | 6.70e-04 | 101 |
| GO:00459361 | Colorectum | SER | negative regulation of phosphate metabolic process | 100/2897 | 441/18723 | 3.62e-05 | 9.39e-04 | 100 |
| GO:00709971 | Colorectum | SER | neuron death | 84/2897 | 361/18723 | 5.76e-05 | 1.35e-03 | 84 |
| GO:00019331 | Colorectum | SER | negative regulation of protein phosphorylation | 79/2897 | 342/18723 | 1.21e-04 | 2.49e-03 | 79 |
| GO:00514021 | Colorectum | SER | neuron apoptotic process | 60/2897 | 246/18723 | 1.65e-04 | 3.13e-03 | 60 |
| Page: 1 2 3 4 5 6 7 8 |
| Pathway ID | Tissue | Disease Stage | Description | Gene Ratio | Bg Ratio | pvalue | p.adjust | qvalue | Count |
| hsa04714 | Colorectum | AD | Thermogenesis | 120/2092 | 232/8465 | 2.76e-19 | 1.16e-17 | 7.37e-18 | 120 |
| hsa05131 | Colorectum | AD | Shigellosis | 109/2092 | 247/8465 | 1.09e-11 | 2.44e-10 | 1.55e-10 | 109 |
| hsa04152 | Colorectum | AD | AMPK signaling pathway | 47/2092 | 121/8465 | 3.74e-04 | 2.82e-03 | 1.80e-03 | 47 |
| hsa04213 | Colorectum | AD | Longevity regulating pathway - multiple species | 27/2092 | 62/8465 | 8.72e-04 | 5.96e-03 | 3.80e-03 | 27 |
| hsa04211 | Colorectum | AD | Longevity regulating pathway | 33/2092 | 89/8465 | 6.15e-03 | 2.68e-02 | 1.71e-02 | 33 |
| hsa047141 | Colorectum | AD | Thermogenesis | 120/2092 | 232/8465 | 2.76e-19 | 1.16e-17 | 7.37e-18 | 120 |
| hsa051311 | Colorectum | AD | Shigellosis | 109/2092 | 247/8465 | 1.09e-11 | 2.44e-10 | 1.55e-10 | 109 |
| hsa041521 | Colorectum | AD | AMPK signaling pathway | 47/2092 | 121/8465 | 3.74e-04 | 2.82e-03 | 1.80e-03 | 47 |
| hsa042131 | Colorectum | AD | Longevity regulating pathway - multiple species | 27/2092 | 62/8465 | 8.72e-04 | 5.96e-03 | 3.80e-03 | 27 |
| hsa042111 | Colorectum | AD | Longevity regulating pathway | 33/2092 | 89/8465 | 6.15e-03 | 2.68e-02 | 1.71e-02 | 33 |
| hsa047142 | Colorectum | SER | Thermogenesis | 106/1580 | 232/8465 | 1.15e-21 | 6.34e-20 | 4.61e-20 | 106 |
| hsa051312 | Colorectum | SER | Shigellosis | 87/1580 | 247/8465 | 3.07e-10 | 7.27e-09 | 5.28e-09 | 87 |
| hsa041402 | Colorectum | SER | Autophagy - animal | 39/1580 | 141/8465 | 5.43e-03 | 3.28e-02 | 2.38e-02 | 39 |
| hsa042132 | Colorectum | SER | Longevity regulating pathway - multiple species | 20/1580 | 62/8465 | 7.15e-03 | 3.77e-02 | 2.74e-02 | 20 |
| hsa047143 | Colorectum | SER | Thermogenesis | 106/1580 | 232/8465 | 1.15e-21 | 6.34e-20 | 4.61e-20 | 106 |
| hsa051313 | Colorectum | SER | Shigellosis | 87/1580 | 247/8465 | 3.07e-10 | 7.27e-09 | 5.28e-09 | 87 |
| hsa041403 | Colorectum | SER | Autophagy - animal | 39/1580 | 141/8465 | 5.43e-03 | 3.28e-02 | 2.38e-02 | 39 |
| hsa042133 | Colorectum | SER | Longevity regulating pathway - multiple species | 20/1580 | 62/8465 | 7.15e-03 | 3.77e-02 | 2.74e-02 | 20 |
| hsa047144 | Colorectum | MSS | Thermogenesis | 113/1875 | 232/8465 | 1.52e-19 | 4.62e-18 | 2.83e-18 | 113 |
| hsa051314 | Colorectum | MSS | Shigellosis | 94/1875 | 247/8465 | 6.82e-09 | 1.34e-07 | 8.23e-08 | 94 |
| Page: 1 2 3 4 5 |
Top |
Cell-cell communication analysis |
| Identification of potential cell-cell interactions between two cell types and their ligand-receptor pairs for different disease states |
| Ligand | Receptor | LRpair | Pathway | Tissue | Disease Stage |
| Page: 1 |
Top |
Single-cell gene regulatory network inference analysis |
| Find out the significant the regulons (TFs) and the target genes of each regulon across cell types for different disease states |
| TF | Cell Type | Tissue | Disease Stage | Target Gene | RSS | Regulon Activity |
| ∗The dot plots of a searched regulon are shown for all cell subpopulations in each disease state of each tissue based on the regulon specific score inferred using pySCENIC and by calculating the average expression. |
| Page: 1 |
Top |
Somatic mutation of malignant transformation related genes |
| Annotation of somatic variants for genes involved in malignant transformation |
| Hugo Symbol | Variant Class | Variant Classification | dbSNP RS | HGVSc | HGVSp | HGVSp Short | SWISSPROT | BIOTYPE | SIFT | PolyPhen | Tumor Sample Barcode | Tissue | Histology | Sex | Age | Stage | Therapy Types | Drugs | Outcome |
| AKT1S1 | SNV | Missense_Mutation | novel | c.668N>T | p.Ser223Leu | p.S223L | Q96B36 | protein_coding | tolerated(0.09) | probably_damaging(0.978) | TCGA-C5-A8XH-01 | Cervix | cervical & endocervical cancer | Female | <65 | I/II | Unknown | Unknown | SD |
| AKT1S1 | SNV | Missense_Mutation | c.305N>A | p.Pro102Gln | p.P102Q | Q96B36 | protein_coding | tolerated(0.42) | possibly_damaging(0.881) | TCGA-FU-A57G-01 | Cervix | cervical & endocervical cancer | Female | <65 | I/II | Unknown | Unknown | SD | |
| AKT1S1 | SNV | Missense_Mutation | rs374227857 | c.661N>T | p.Arg221Trp | p.R221W | Q96B36 | protein_coding | deleterious(0.01) | probably_damaging(0.953) | TCGA-UC-A7PF-01 | Cervix | cervical & endocervical cancer | Female | <65 | I/II | Unknown | Unknown | SD |
| AKT1S1 | SNV | Missense_Mutation | novel | c.548G>C | p.Gly183Ala | p.G183A | Q96B36 | protein_coding | tolerated(0.38) | benign(0.003) | TCGA-AA-3672-01 | Colorectum | colon adenocarcinoma | Female | >=65 | III/IV | Unknown | Unknown | SD |
| AKT1S1 | SNV | Missense_Mutation | c.337N>A | p.Pro113Thr | p.P113T | Q96B36 | protein_coding | tolerated(0.13) | benign(0.06) | TCGA-AA-3710-01 | Colorectum | colon adenocarcinoma | Female | >=65 | I/II | Unknown | Unknown | SD | |
| AKT1S1 | SNV | Missense_Mutation | rs375398248 | c.233C>T | p.Ala78Val | p.A78V | Q96B36 | protein_coding | tolerated(0.22) | benign(0.14) | TCGA-AD-5900-01 | Colorectum | colon adenocarcinoma | Male | >=65 | I/II | Unknown | Unknown | SD |
| AKT1S1 | SNV | Missense_Mutation | rs142575650 | c.659N>T | p.Ala220Val | p.A220V | Q96B36 | protein_coding | tolerated(0.15) | benign(0.086) | TCGA-AD-6889-01 | Colorectum | colon adenocarcinoma | Male | >=65 | I/II | Chemotherapy | xeloda | PD |
| AKT1S1 | SNV | Missense_Mutation | novel | c.335N>T | p.Ser112Ile | p.S112I | Q96B36 | protein_coding | deleterious(0.01) | possibly_damaging(0.737) | TCGA-F4-6856-01 | Colorectum | colon adenocarcinoma | Male | <65 | I/II | Ancillary | leucovorin | CR |
| AKT1S1 | SNV | Missense_Mutation | novel | c.474N>T | p.Gln158His | p.Q158H | Q96B36 | protein_coding | deleterious(0.03) | possibly_damaging(0.555) | TCGA-A5-A1OF-01 | Endometrium | uterine corpus endometrioid carcinoma | Female | <65 | I/II | Unknown | Unknown | SD |
| AKT1S1 | SNV | Missense_Mutation | novel | c.221T>C | p.Leu74Pro | p.L74P | Q96B36 | protein_coding | deleterious(0.04) | probably_damaging(0.998) | TCGA-AP-A1DK-01 | Endometrium | uterine corpus endometrioid carcinoma | Female | <65 | I/II | Unknown | Unknown | SD |
| Page: 1 2 3 |
Top |
Related drugs of malignant transformation related genes |
| Identification of chemicals and drugs interact with genes involved in malignant transfromation |
| (DGIdb 4.0) |
| Entrez ID | Symbol | Category | Interaction Types | Drug Claim Name | Drug Name | PMIDs |
| 84335 | AKT1S1 | KINASE, DRUGGABLE GENOME | GEDATOLISIB | GEDATOLISIB | 20166697 | |
| 84335 | AKT1S1 | KINASE, DRUGGABLE GENOME | inhibitor | OSI-027 | OSI-027 | |
| 84335 | AKT1S1 | KINASE, DRUGGABLE GENOME | inhibitor | AZD8055 | AZD-8055 | |
| 84335 | AKT1S1 | KINASE, DRUGGABLE GENOME | inhibitor | MLN0128 | SAPANISERTIB |
| Page: 1 |

Copyright 2023-Present -The University of Texas Health Science Center at Houston |