
|
|||||
|
 | |
| |
| |
| |
| |
| |
|
Gene: AHCYL1 |
Gene summary for AHCYL1 |
| Gene information | Species | Human | Gene symbol | AHCYL1 | Gene ID | 10768 |
| Gene name | adenosylhomocysteinase like 1 | |
| Gene Alias | DCAL | |
| Cytomap | 1p13.3 | |
| Gene Type | protein-coding | GO ID | GO:0002028 | UniProtAcc | O43865 |
Top |
Malignant transformation analysis |
| Identification of the aberrant gene expression in precancerous and cancerous lesions by comparing the gene expression of stem-like cells in diseased tissues with normal stem cells |
| Entrez ID | Symbol | Replicates | Species | Organ | Tissue | Adj P-value | Log2FC | Malignancy |
| 10768 | AHCYL1 | HTA12-26-1 | Human | Pancreas | PDAC | 4.33e-05 | 6.60e-01 | 0.3728 |
| 10768 | AHCYL1 | HTA12-29-1 | Human | Pancreas | PDAC | 1.71e-19 | 6.01e-01 | 0.3722 |
| 10768 | AHCYL1 | GSM5252128_BPH327PrGF_Via | Human | Prostate | BPH | 2.01e-02 | 2.87e-01 | -0.1688 |
| 10768 | AHCYL1 | GSM5252132_BPH389PrGF | Human | Prostate | BPH | 1.34e-13 | 7.67e-01 | -0.2247 |
| 10768 | AHCYL1 | GSM5252133_BPH389PrSF | Human | Prostate | BPH | 1.47e-03 | 6.68e-01 | -0.2027 |
| 10768 | AHCYL1 | GSM5252135_BPH511PrPUr_Fcol_3GEX | Human | Prostate | BPH | 2.86e-03 | 3.88e-01 | -0.1833 |
| 10768 | AHCYL1 | GSM5252137_BPH556PrGA2_Fcol | Human | Prostate | BPH | 4.86e-11 | 8.25e-01 | -0.23 |
| 10768 | AHCYL1 | 047563_1562-all-cells | Human | Prostate | BPH | 6.62e-11 | 9.84e-02 | 0.0791 |
| 10768 | AHCYL1 | 052097_1595-all-cells | Human | Prostate | BPH | 3.42e-06 | 2.04e-01 | 0.0972 |
| 10768 | AHCYL1 | Dong_P1 | Human | Prostate | Tumor | 4.25e-21 | 1.10e-01 | 0.035 |
| 10768 | AHCYL1 | Dong_P3 | Human | Prostate | Tumor | 2.06e-10 | 3.56e-02 | 0.0278 |
| 10768 | AHCYL1 | Dong_P4 | Human | Prostate | Tumor | 4.12e-03 | -7.74e-02 | 0.0292 |
| 10768 | AHCYL1 | Dong_P5 | Human | Prostate | Tumor | 1.27e-33 | -1.44e-01 | 0.053 |
| 10768 | AHCYL1 | P10 | Human | Prostate | Tumor | 2.49e-02 | 3.20e-01 | -0.0902 |
| 10768 | AHCYL1 | GSM5353221_PA_PB2A_Pool_1_3_S25_L001 | Human | Prostate | Tumor | 5.69e-05 | 3.86e-01 | 0.1633 |
| 10768 | AHCYL1 | GSM5353222_PA_PB2B_Pool_1_3_S52_L002 | Human | Prostate | Tumor | 3.33e-08 | 4.31e-01 | 0.1608 |
| 10768 | AHCYL1 | GSM5353227_PA_PR5199-193K_Pool_1_2_3_S55_L002 | Human | Prostate | Tumor | 1.70e-07 | 3.81e-01 | 0.1602 |
| 10768 | AHCYL1 | GSM5353228_PA_PR5199-640K_Pool_1_3_S108_L004 | Human | Prostate | Tumor | 1.40e-05 | 3.72e-01 | 0.1537 |
| 10768 | AHCYL1 | GSM5353236_PA_PR5251_T1_S7_L001 | Human | Prostate | Tumor | 6.07e-03 | 4.50e-01 | 0.1608 |
| 10768 | AHCYL1 | GSM5353240_PA_PR5254_T1_S15_L001 | Human | Prostate | Tumor | 1.27e-07 | 2.90e-01 | 0.1575 |
| Page: 1 2 3 4 5 6 7 8 9 |
| Tissue | Expression Dynamics | Abbreviation |
| Colorectum (GSE201348) |  | FAP: Familial adenomatous polyposis |
| CRC: Colorectal cancer | ||
| Colorectum (HTA11) | 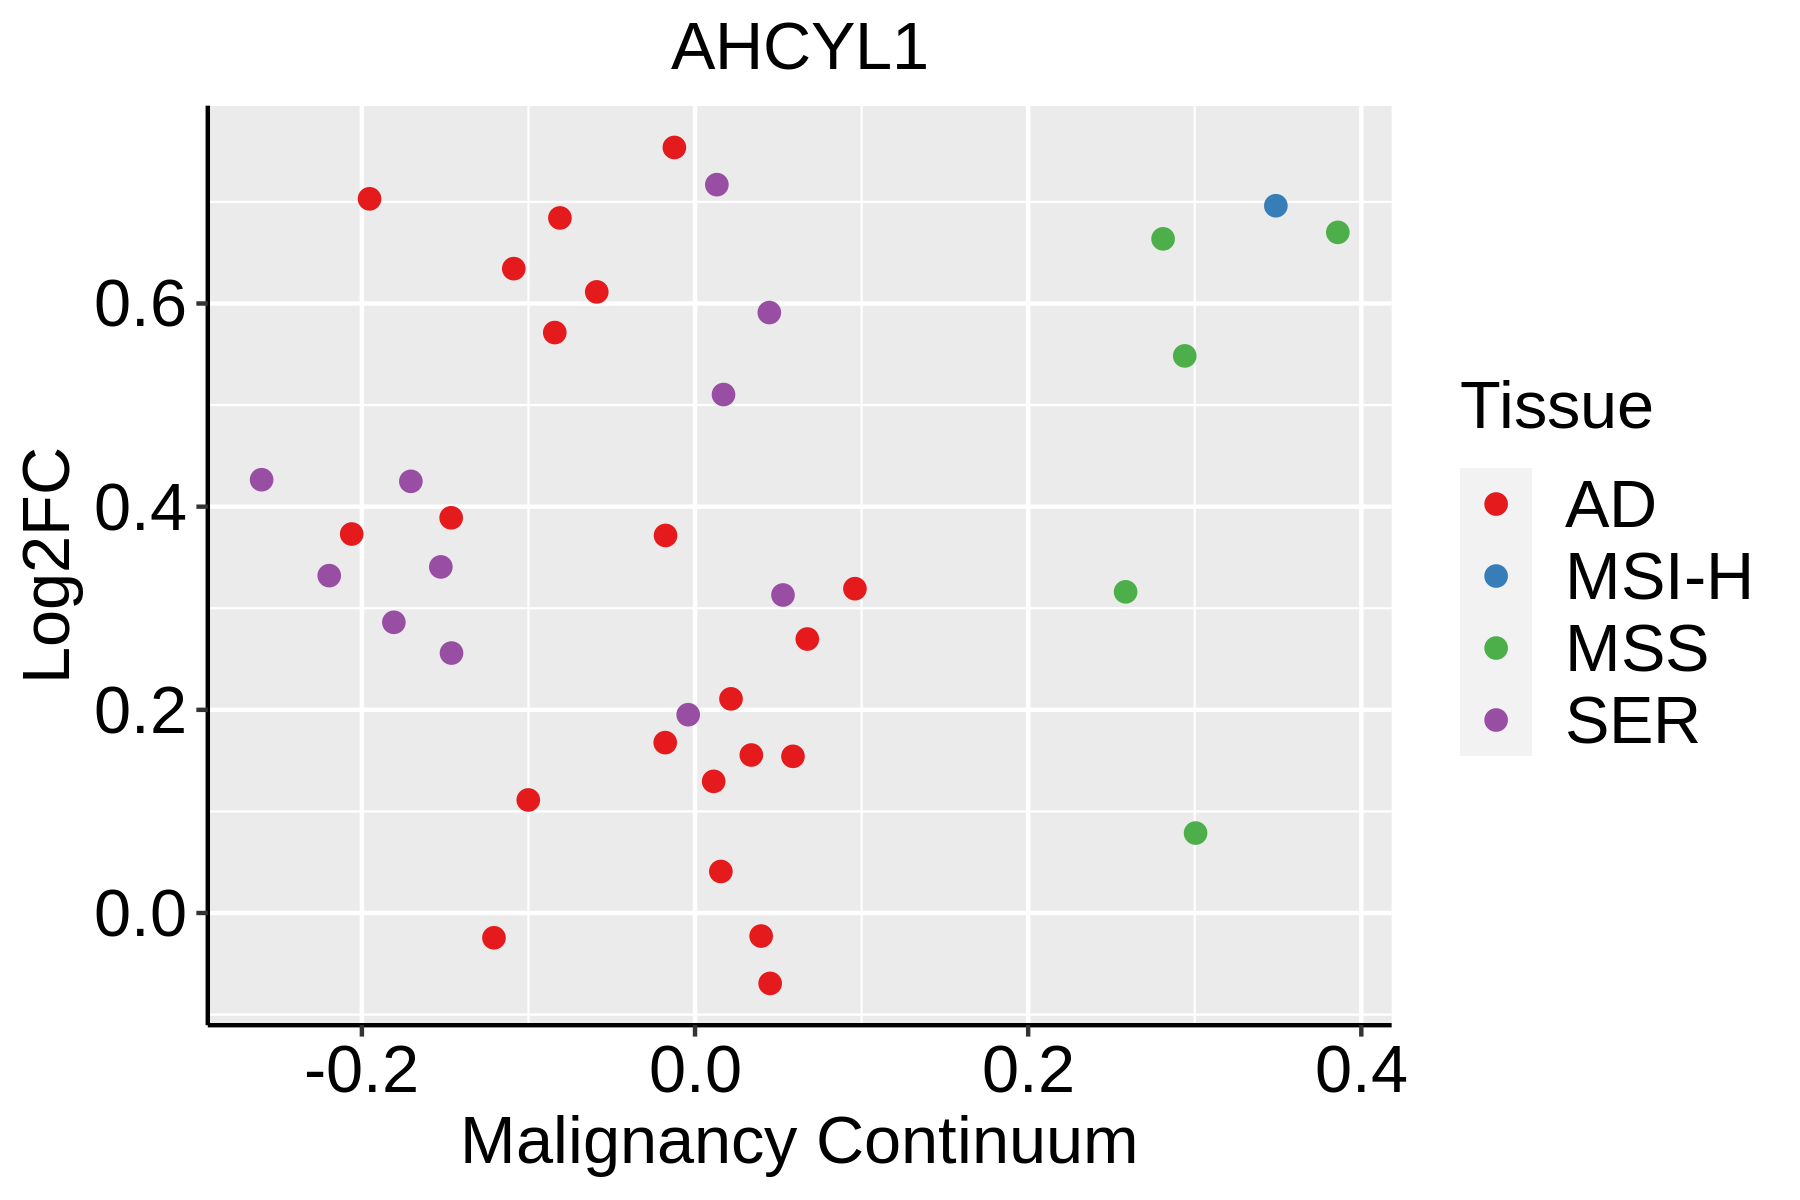 | AD: Adenomas |
| SER: Sessile serrated lesions | ||
| MSI-H: Microsatellite-high colorectal cancer | ||
| MSS: Microsatellite stable colorectal cancer | ||
| Endometrium |  | AEH: Atypical endometrial hyperplasia |
| EEC: Endometrioid Cancer | ||
| Esophagus | 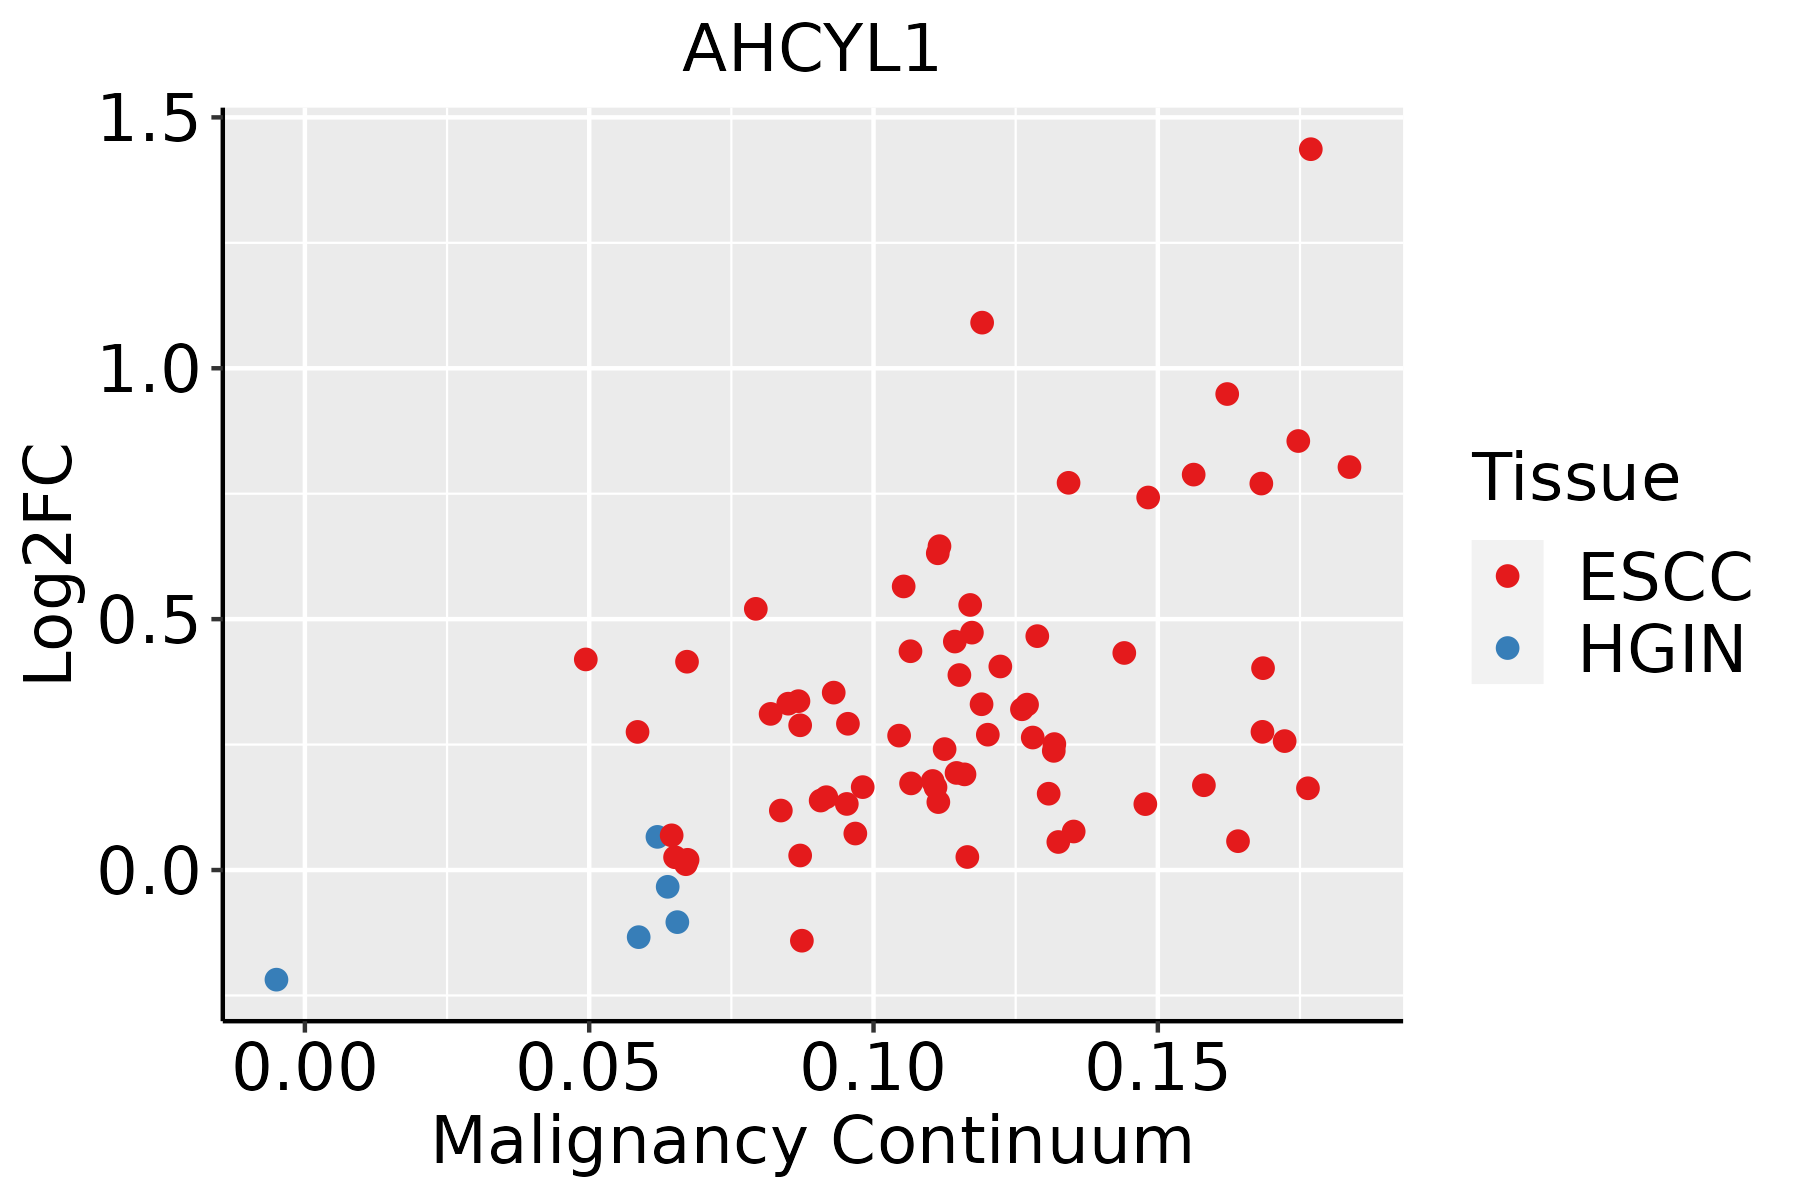 | ESCC: Esophageal squamous cell carcinoma |
| HGIN: High-grade intraepithelial neoplasias | ||
| LGIN: Low-grade intraepithelial neoplasias | ||
| Liver | 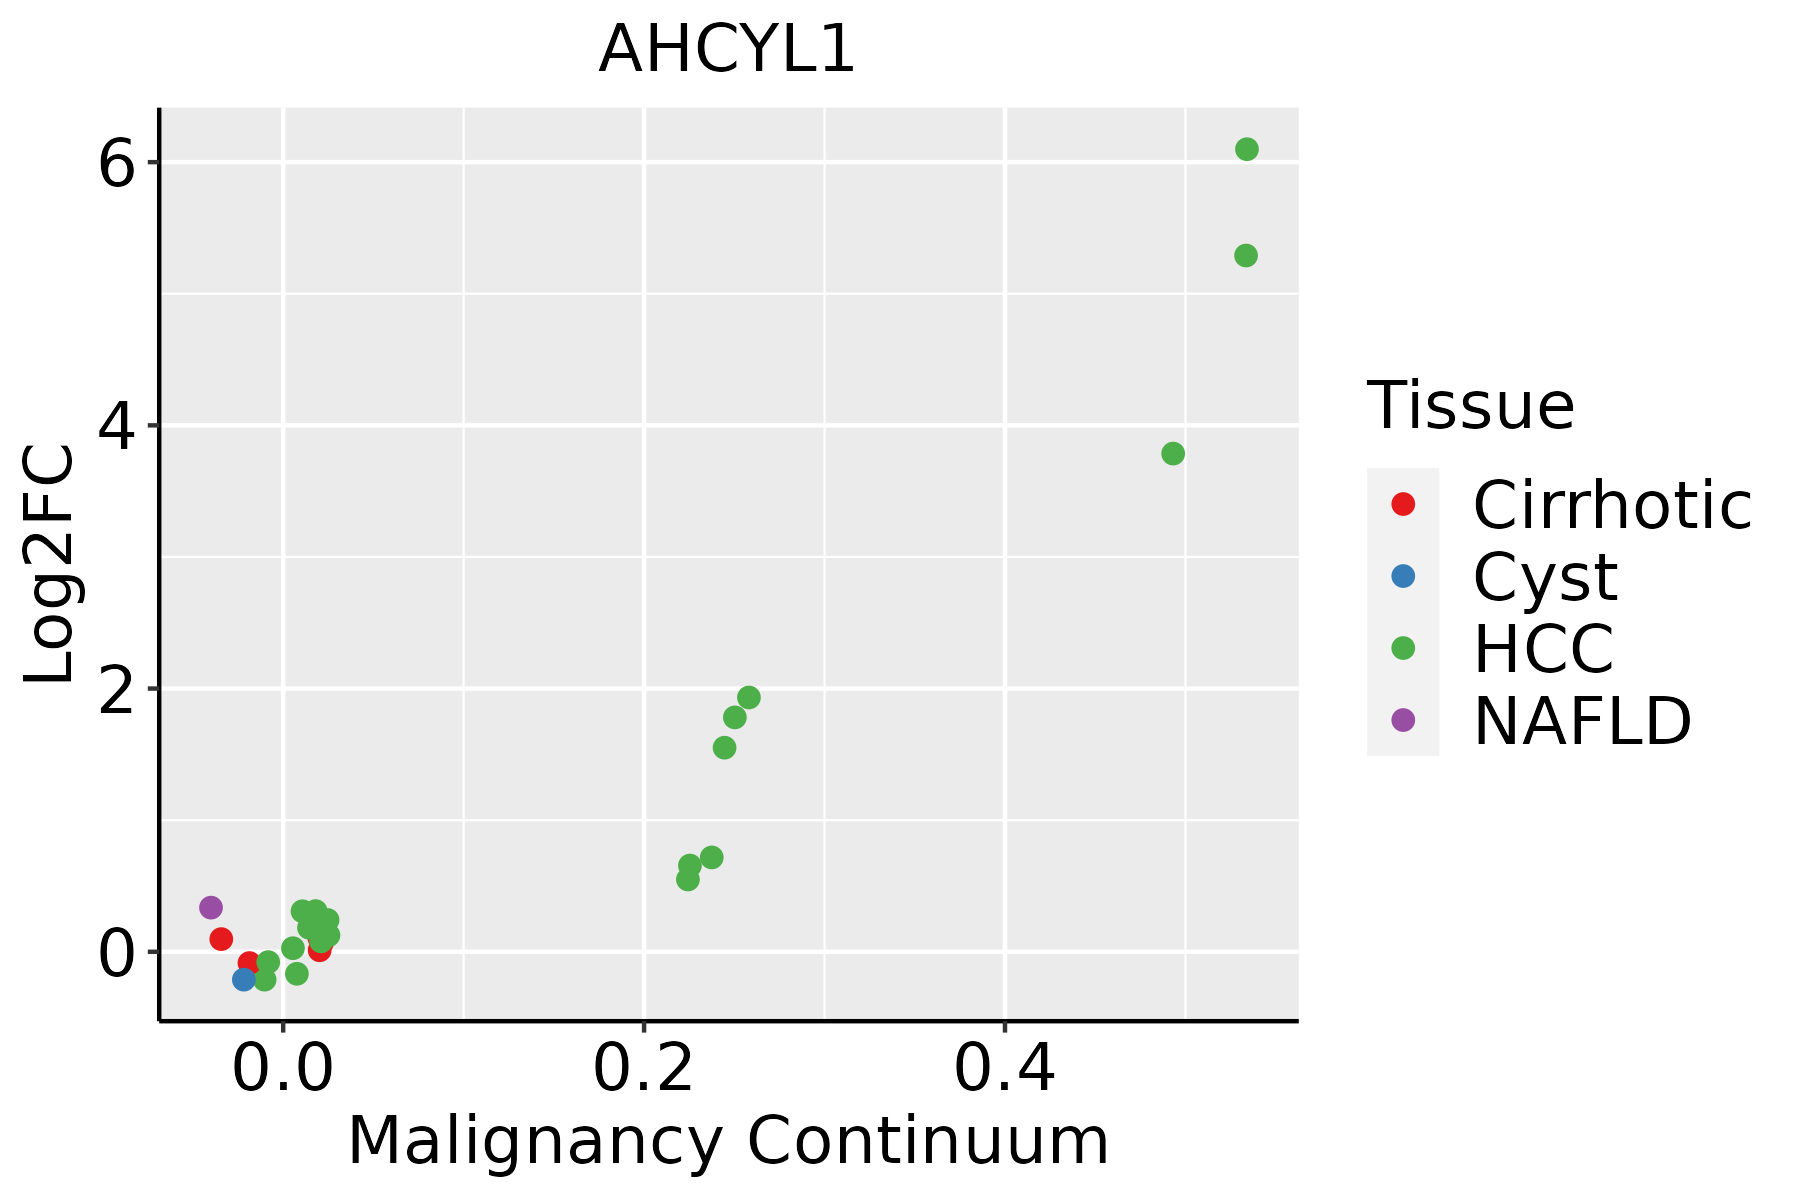 | HCC: Hepatocellular carcinoma |
| NAFLD: Non-alcoholic fatty liver disease | ||
| Oral Cavity | 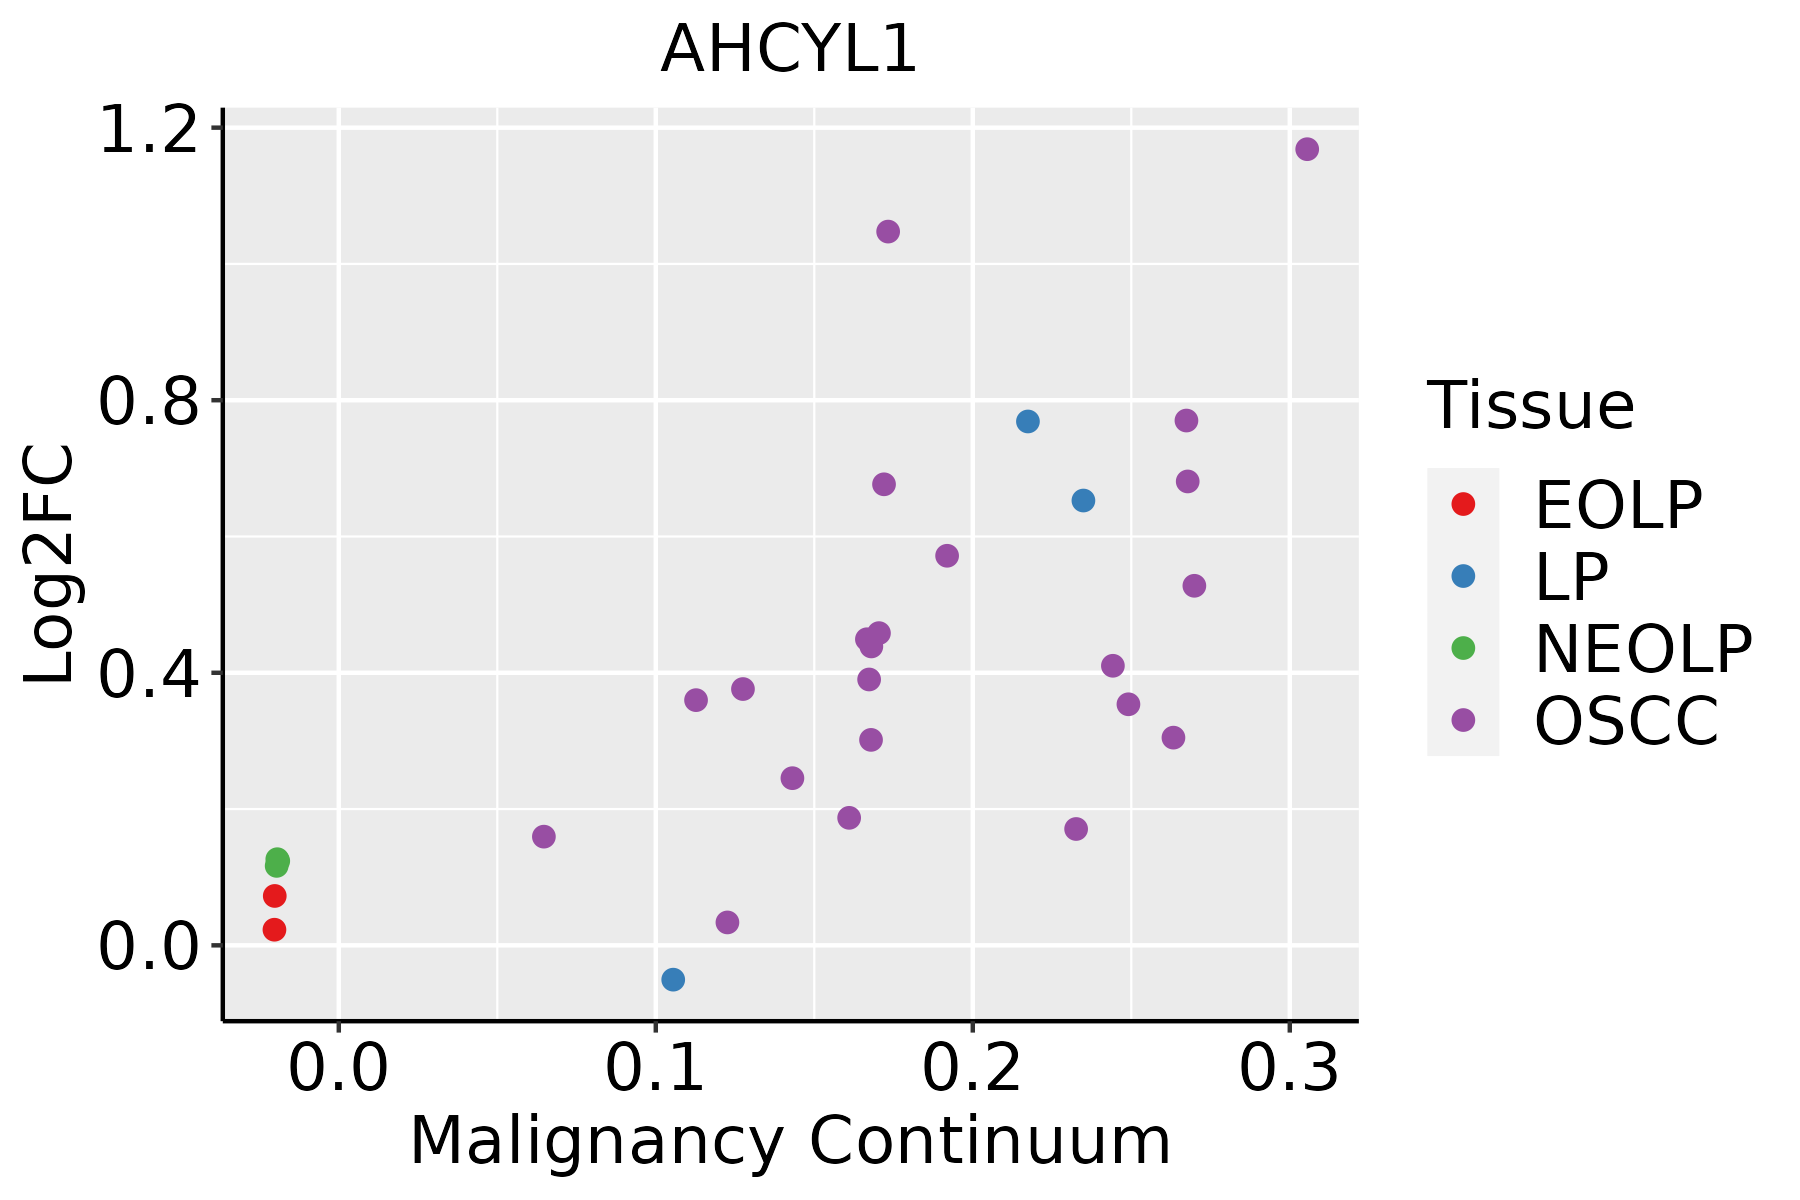 | EOLP: Erosive Oral lichen planus |
| LP: leukoplakia | ||
| NEOLP: Non-erosive oral lichen planus | ||
| OSCC: Oral squamous cell carcinoma | ||
| Prostate | 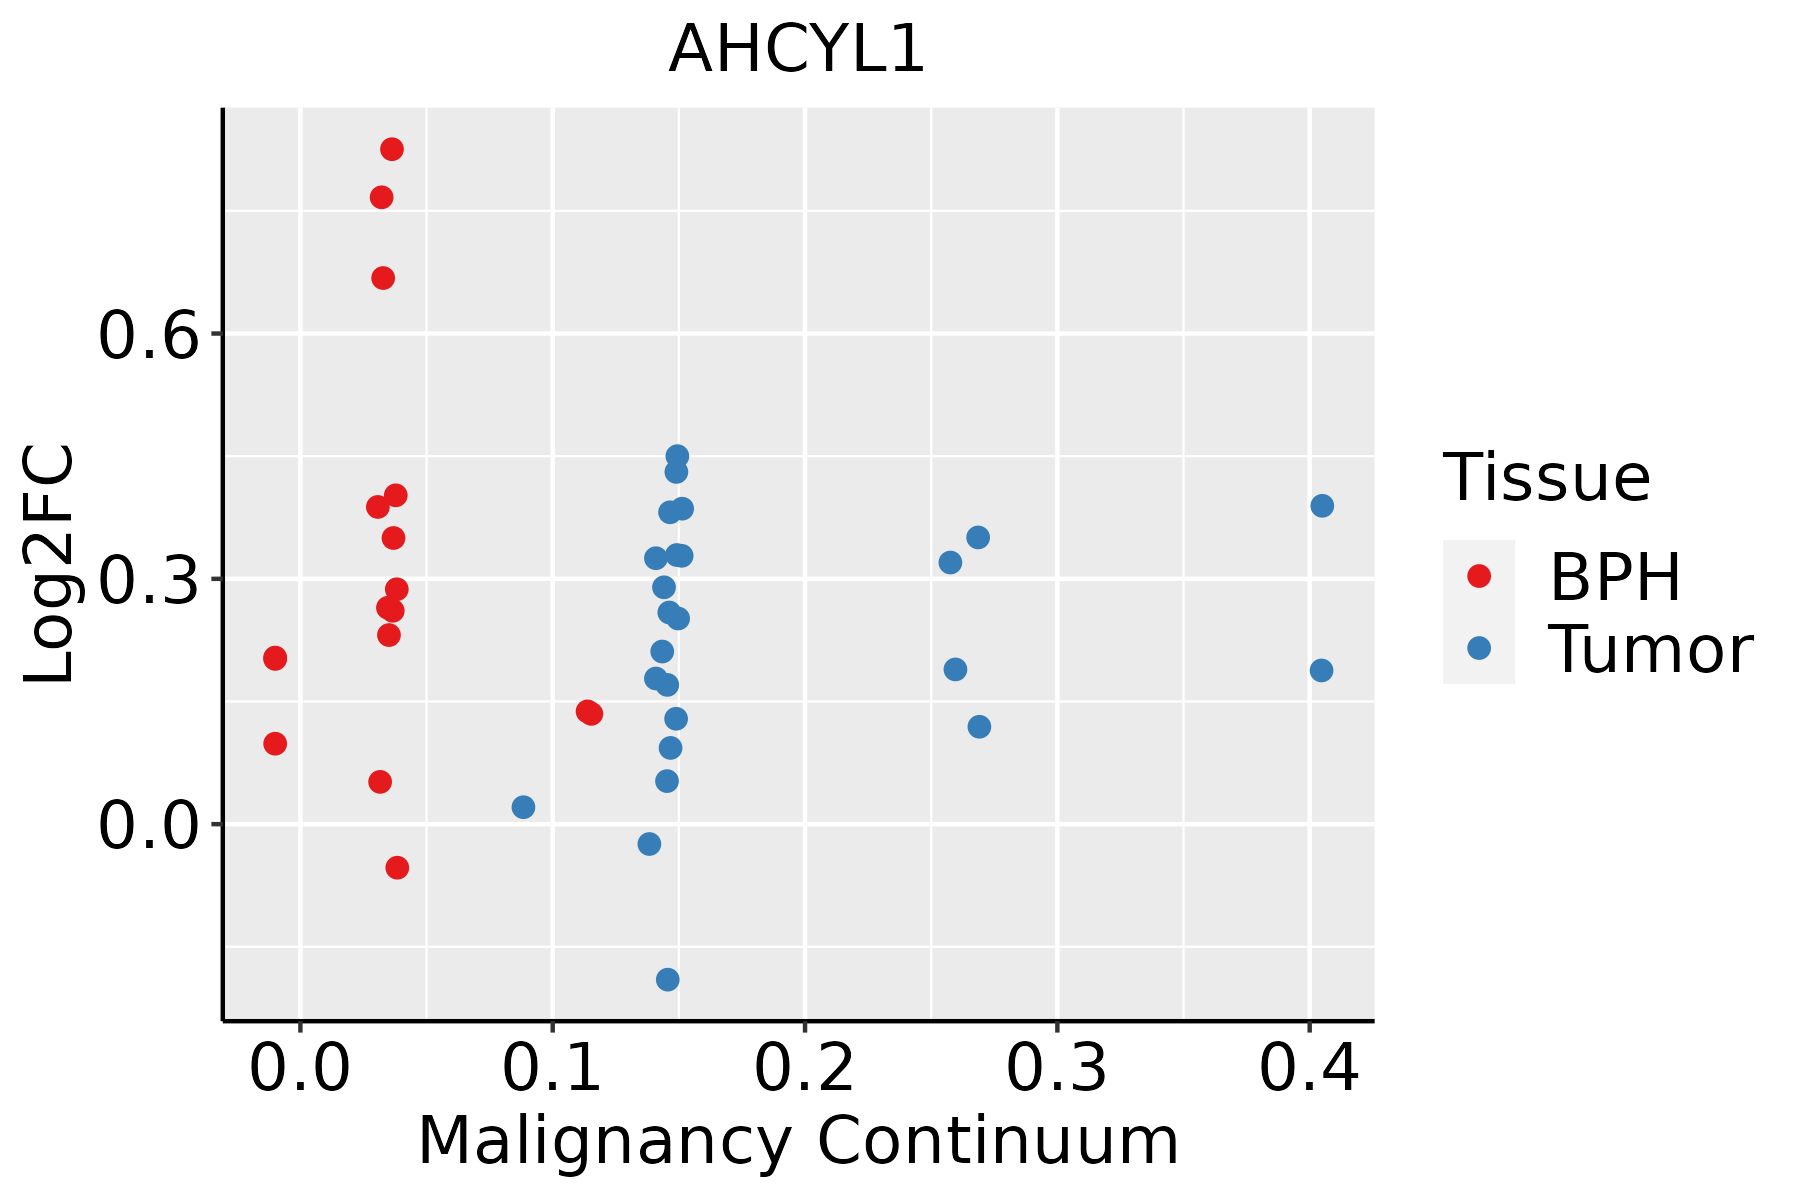 | BPH: Benign Prostatic Hyperplasia |
| Skin | 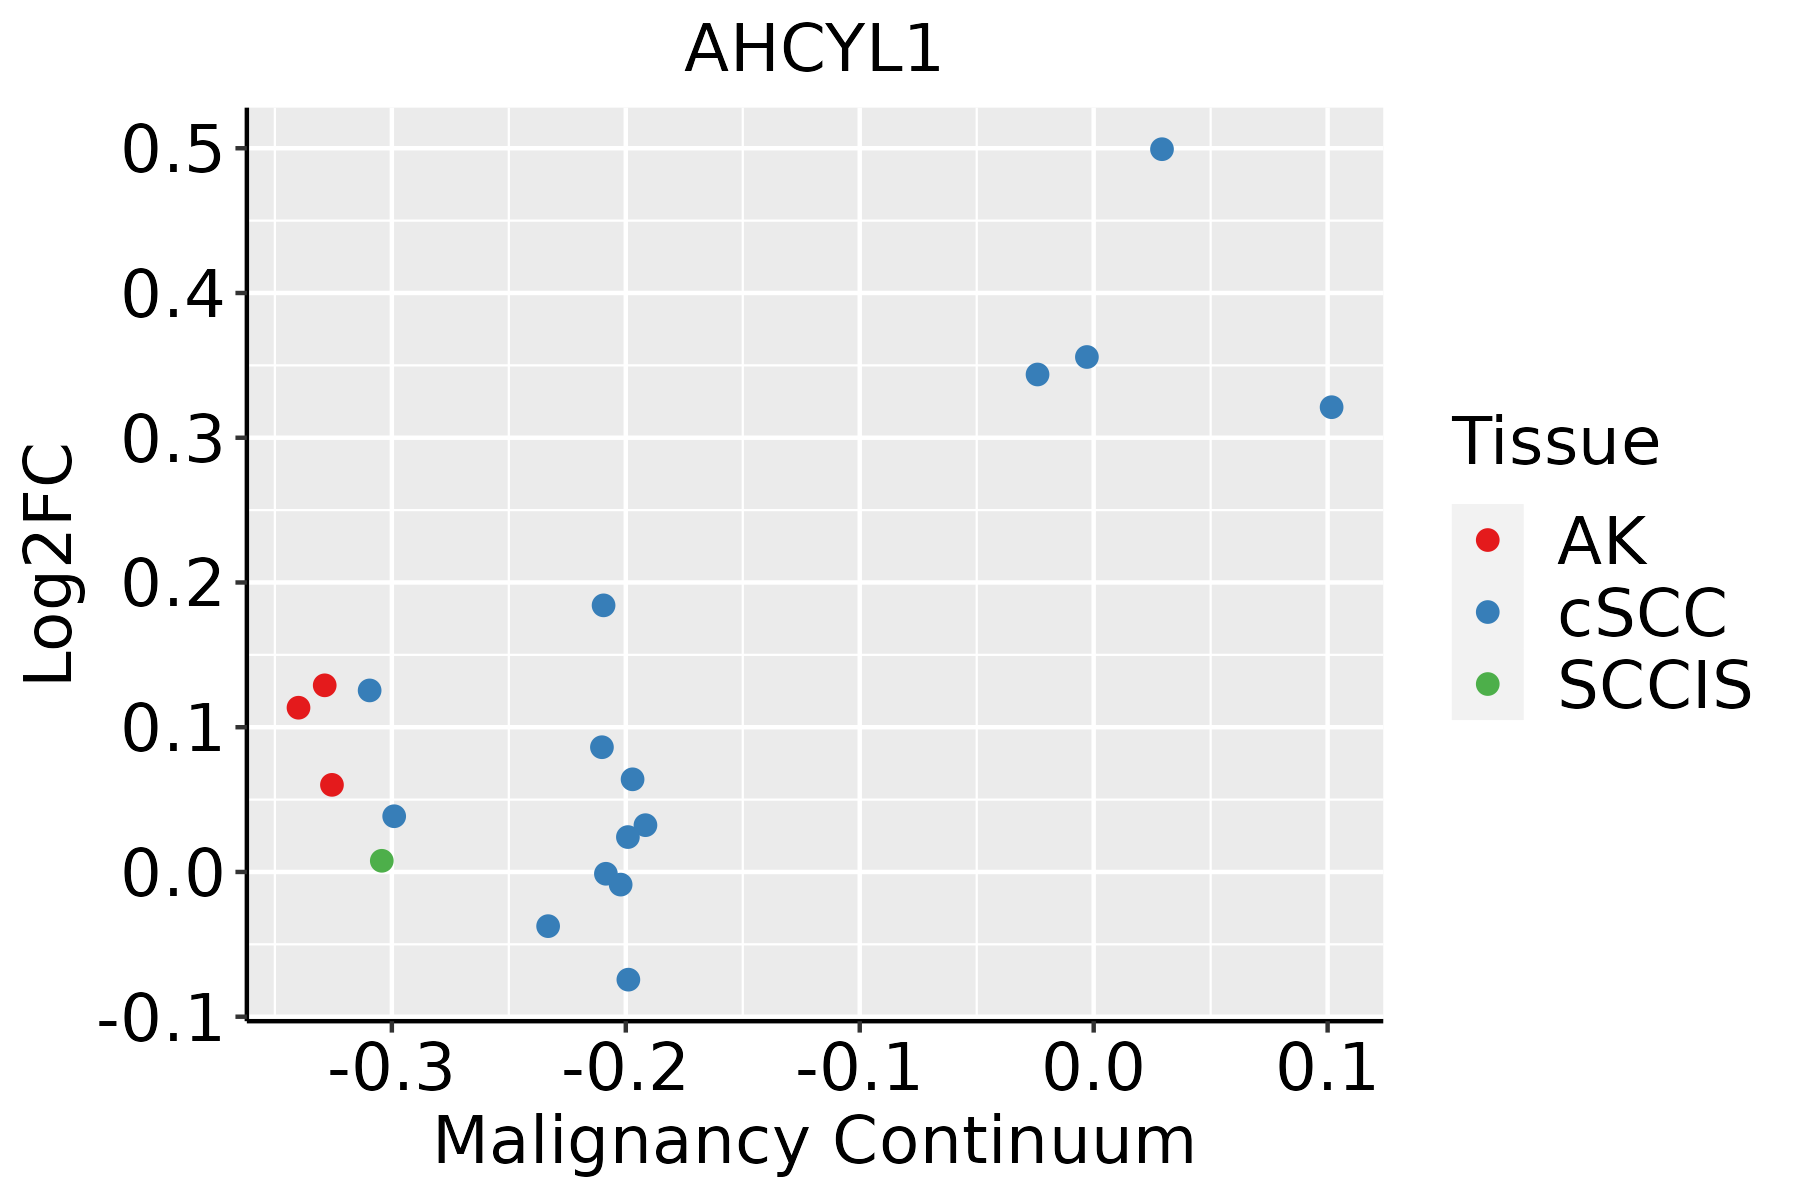 | AK: Actinic keratosis |
| cSCC: Cutaneous squamous cell carcinoma | ||
| SCCIS:squamous cell carcinoma in situ | ||
| Thyroid | 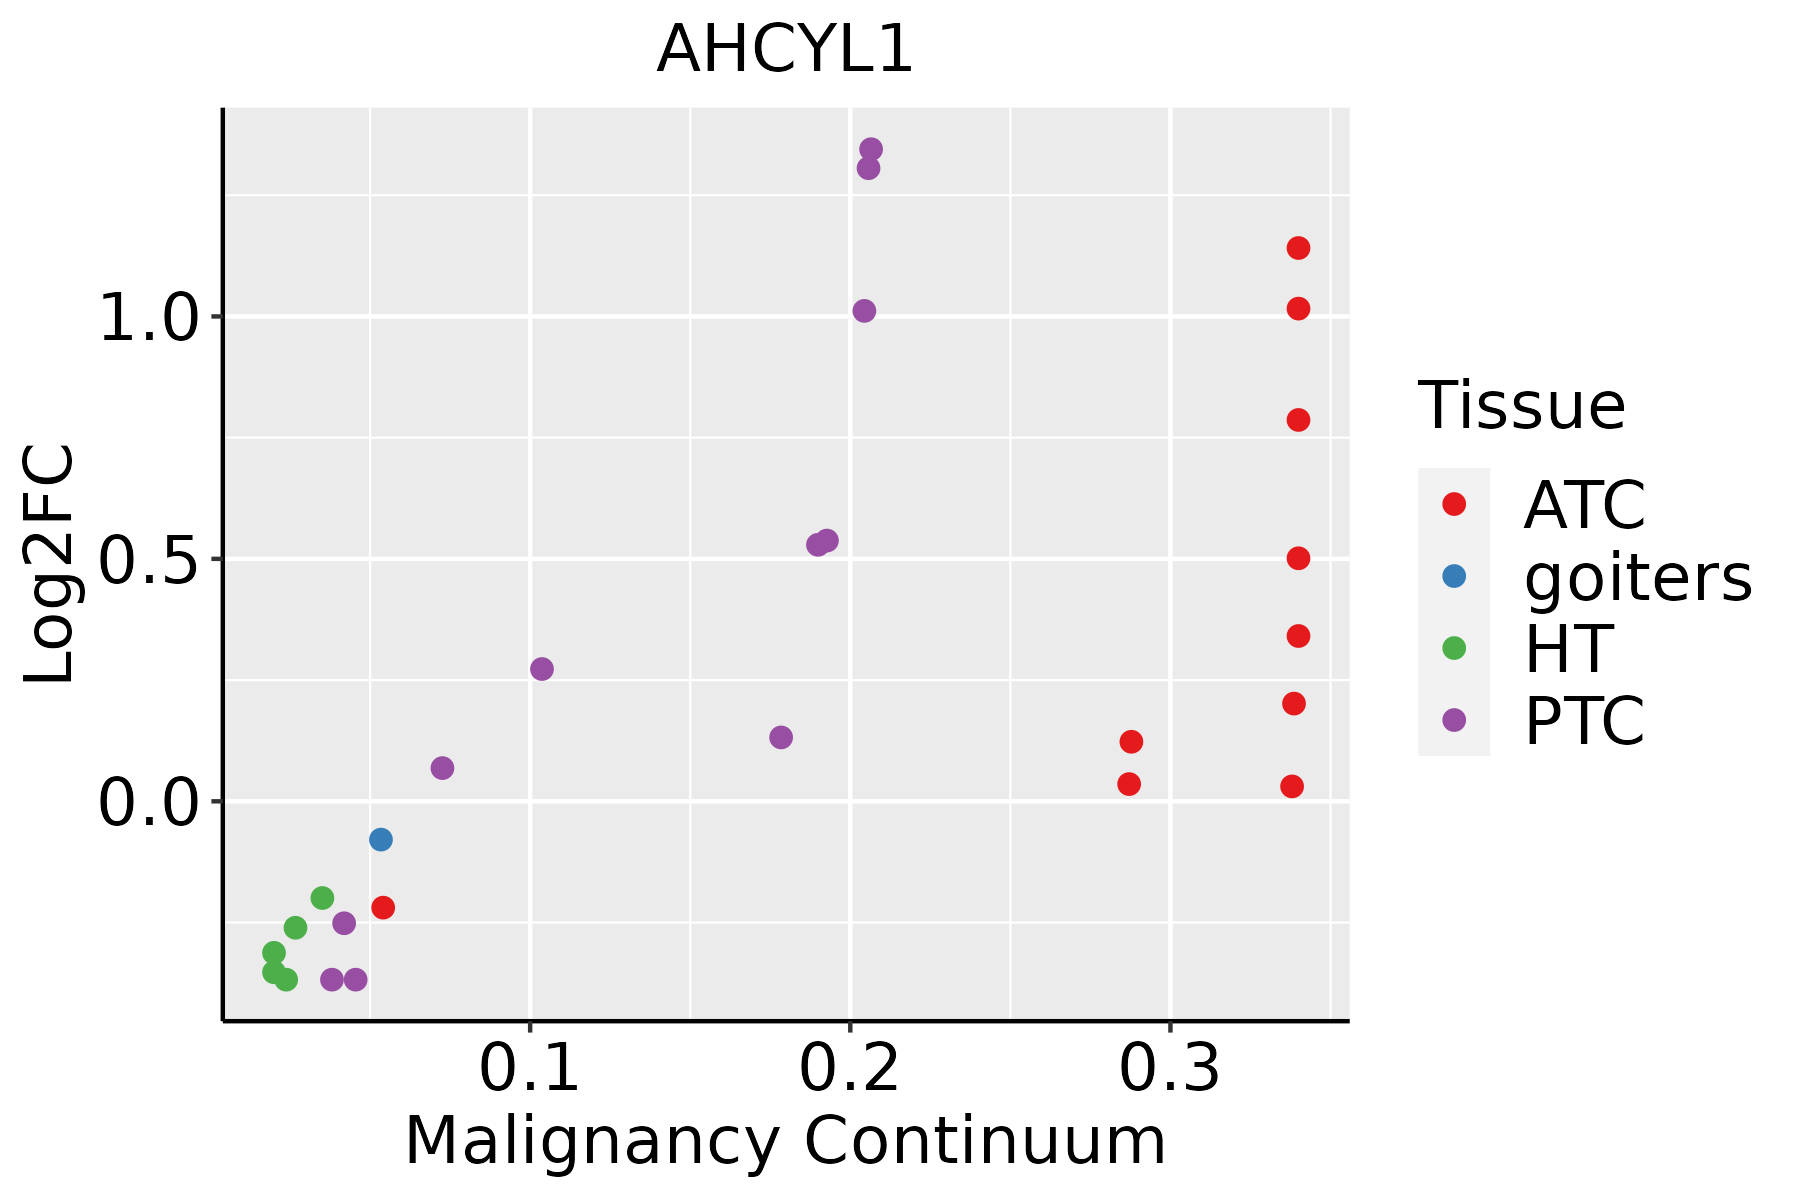 | ATC: Anaplastic thyroid cancer |
| HT: Hashimoto's thyroiditis | ||
| PTC: Papillary thyroid cancer |
| ∗log2FC in expression of this searched gene in stem-like cells from each diseased tissue sample relative to stem-like cells in normal samples in each tissue plotted against the malignancy continuum. Samples are colored based on if they are from different disease stage. |
Top |
Malignant transformation related pathway analysis |
| Find out the enriched GO biological processes and KEGG pathways involved in transition from healthy to precancer to cancer |
| Tissue | Disease Stage | Enriched GO biological Processes |
| Colorectum | AD |  |
| Colorectum | SER |  |
| Colorectum | MSS |  |
| Colorectum | MSI-H |  |
| Colorectum | FAP |  |
| ∗Top 15 enriched GO BP terms are showed in the bar plot of each disease state in each tissue. Each row represents a significant GO biological process which is colored according to the -log10(p.adjust). |
| Page: 1 2 3 4 5 6 7 8 9 |
| GO ID | Tissue | Disease Stage | Description | Gene Ratio | Bg Ratio | pvalue | p.adjust | Count |
| GO:1903311 | Colorectum | AD | regulation of mRNA metabolic process | 117/3918 | 288/18723 | 1.69e-14 | 4.23e-12 | 117 |
| GO:0050684 | Colorectum | AD | regulation of mRNA processing | 61/3918 | 137/18723 | 4.23e-10 | 3.58e-08 | 61 |
| GO:0006913 | Colorectum | AD | nucleocytoplasmic transport | 102/3918 | 301/18723 | 1.00e-07 | 4.85e-06 | 102 |
| GO:0051169 | Colorectum | AD | nuclear transport | 102/3918 | 301/18723 | 1.00e-07 | 4.85e-06 | 102 |
| GO:1901653 | Colorectum | AD | cellular response to peptide | 114/3918 | 359/18723 | 8.32e-07 | 2.88e-05 | 114 |
| GO:0071375 | Colorectum | AD | cellular response to peptide hormone stimulus | 95/3918 | 290/18723 | 1.50e-06 | 4.66e-05 | 95 |
| GO:0043434 | Colorectum | AD | response to peptide hormone | 126/3918 | 414/18723 | 2.70e-06 | 7.86e-05 | 126 |
| GO:0002028 | Colorectum | AD | regulation of sodium ion transport | 36/3918 | 90/18723 | 2.89e-05 | 5.37e-04 | 36 |
| GO:0006790 | Colorectum | AD | sulfur compound metabolic process | 101/3918 | 339/18723 | 6.46e-05 | 1.07e-03 | 101 |
| GO:0051168 | Colorectum | AD | nuclear export | 53/3918 | 154/18723 | 6.89e-05 | 1.11e-03 | 53 |
| GO:0010765 | Colorectum | AD | positive regulation of sodium ion transport | 17/3918 | 35/18723 | 2.48e-04 | 3.13e-03 | 17 |
| GO:0010038 | Colorectum | AD | response to metal ion | 106/3918 | 373/18723 | 3.22e-04 | 3.83e-03 | 106 |
| GO:0006730 | Colorectum | AD | one-carbon metabolic process | 18/3918 | 40/18723 | 5.36e-04 | 5.74e-03 | 18 |
| GO:0006611 | Colorectum | AD | protein export from nucleus | 23/3918 | 57/18723 | 6.62e-04 | 6.80e-03 | 23 |
| GO:0022406 | Colorectum | AD | membrane docking | 31/3918 | 86/18723 | 8.67e-04 | 8.45e-03 | 31 |
| GO:0140056 | Colorectum | AD | organelle localization by membrane tethering | 28/3918 | 77/18723 | 1.29e-03 | 1.14e-02 | 28 |
| GO:19033111 | Colorectum | SER | regulation of mRNA metabolic process | 78/2897 | 288/18723 | 2.61e-07 | 1.43e-05 | 78 |
| GO:00069131 | Colorectum | SER | nucleocytoplasmic transport | 77/2897 | 301/18723 | 3.39e-06 | 1.32e-04 | 77 |
| GO:00511691 | Colorectum | SER | nuclear transport | 77/2897 | 301/18723 | 3.39e-06 | 1.32e-04 | 77 |
| GO:00506841 | Colorectum | SER | regulation of mRNA processing | 42/2897 | 137/18723 | 5.57e-06 | 2.01e-04 | 42 |
| Page: 1 2 3 4 5 6 7 8 9 10 11 12 13 14 15 |
| Pathway ID | Tissue | Disease Stage | Description | Gene Ratio | Bg Ratio | pvalue | p.adjust | qvalue | Count |
| hsa002704 | Endometrium | EEC | Cysteine and methionine metabolism | 15/1237 | 52/8465 | 6.02e-03 | 3.12e-02 | 2.33e-02 | 15 |
| hsa0027011 | Endometrium | EEC | Cysteine and methionine metabolism | 15/1237 | 52/8465 | 6.02e-03 | 3.12e-02 | 2.33e-02 | 15 |
| hsa00270 | Liver | Cirrhotic | Cysteine and methionine metabolism | 27/2530 | 52/8465 | 6.98e-04 | 4.15e-03 | 2.56e-03 | 27 |
| hsa002701 | Liver | Cirrhotic | Cysteine and methionine metabolism | 27/2530 | 52/8465 | 6.98e-04 | 4.15e-03 | 2.56e-03 | 27 |
| hsa002702 | Liver | HCC | Cysteine and methionine metabolism | 35/4020 | 52/8465 | 3.03e-03 | 9.94e-03 | 5.53e-03 | 35 |
| hsa002703 | Liver | HCC | Cysteine and methionine metabolism | 35/4020 | 52/8465 | 3.03e-03 | 9.94e-03 | 5.53e-03 | 35 |
| Page: 1 |
Top |
Cell-cell communication analysis |
| Identification of potential cell-cell interactions between two cell types and their ligand-receptor pairs for different disease states |
| Ligand | Receptor | LRpair | Pathway | Tissue | Disease Stage |
| Page: 1 |
Top |
Single-cell gene regulatory network inference analysis |
| Find out the significant the regulons (TFs) and the target genes of each regulon across cell types for different disease states |
| TF | Cell Type | Tissue | Disease Stage | Target Gene | RSS | Regulon Activity |
| ∗The dot plots of a searched regulon are shown for all cell subpopulations in each disease state of each tissue based on the regulon specific score inferred using pySCENIC and by calculating the average expression. |
| Page: 1 |
Top |
Somatic mutation of malignant transformation related genes |
| Annotation of somatic variants for genes involved in malignant transformation |
| Hugo Symbol | Variant Class | Variant Classification | dbSNP RS | HGVSc | HGVSp | HGVSp Short | SWISSPROT | BIOTYPE | SIFT | PolyPhen | Tumor Sample Barcode | Tissue | Histology | Sex | Age | Stage | Therapy Types | Drugs | Outcome |
| AHCYL1 | SNV | Missense_Mutation | novel | c.1148N>T | p.Glu383Val | p.E383V | O43865 | protein_coding | deleterious(0) | benign(0.062) | TCGA-B6-A3ZX-01 | Breast | breast invasive carcinoma | Female | <65 | III/IV | Chemotherapy | cyclophosphamide | PD |
| AHCYL1 | SNV | Missense_Mutation | c.909N>T | p.Arg303Ser | p.R303S | O43865 | protein_coding | deleterious(0.02) | possibly_damaging(0.458) | TCGA-E2-A1LH-01 | Breast | breast invasive carcinoma | Female | <65 | I/II | Chemotherapy | adriamycin | SD | |
| AHCYL1 | insertion | Frame_Shift_Ins | novel | c.899_899+1insCTCTCTTACTAGTACAGAAAGT | p.Leu301SerfsTer28 | p.L301Sfs*28 | O43865 | protein_coding | TCGA-A7-A0CJ-01 | Breast | breast invasive carcinoma | Female | <65 | I/II | Chemotherapy | cytoxan | SD | ||
| AHCYL1 | SNV | Missense_Mutation | rs538566120 | c.1213N>A | p.Asp405Asn | p.D405N | O43865 | protein_coding | deleterious(0.03) | benign(0.429) | TCGA-C5-A1ME-01 | Cervix | cervical & endocervical cancer | Female | <65 | I/II | Unknown | Unknown | SD |
| AHCYL1 | SNV | Missense_Mutation | novel | c.305N>A | p.Ser102Asn | p.S102N | O43865 | protein_coding | tolerated(0.51) | benign(0) | TCGA-VS-A94Z-01 | Cervix | cervical & endocervical cancer | Female | <65 | I/II | Chemotherapy | cisplatin | CR |
| AHCYL1 | SNV | Missense_Mutation | novel | c.766G>A | p.Val256Met | p.V256M | O43865 | protein_coding | deleterious(0.03) | probably_damaging(0.92) | TCGA-VS-A950-01 | Cervix | cervical & endocervical cancer | Female | <65 | III/IV | Unknown | Unknown | SD |
| AHCYL1 | SNV | Missense_Mutation | c.361G>A | p.Glu121Lys | p.E121K | O43865 | protein_coding | tolerated(0.07) | possibly_damaging(0.706) | TCGA-ZX-AA5X-01 | Cervix | cervical & endocervical cancer | Female | <65 | III/IV | Unknown | Unknown | SD | |
| AHCYL1 | SNV | Missense_Mutation | novel | c.821N>T | p.Pro274Leu | p.P274L | O43865 | protein_coding | deleterious(0) | probably_damaging(1) | TCGA-5M-AAT6-01 | Colorectum | colon adenocarcinoma | Female | <65 | III/IV | Unknown | Unknown | PD |
| AHCYL1 | SNV | Missense_Mutation | c.409N>A | p.Ala137Thr | p.A137T | O43865 | protein_coding | tolerated(0.36) | benign(0.39) | TCGA-AA-3530-01 | Colorectum | colon adenocarcinoma | Male | >=65 | I/II | Unknown | Unknown | SD | |
| AHCYL1 | SNV | Missense_Mutation | rs756700510 | c.641G>A | p.Arg214His | p.R214H | O43865 | protein_coding | deleterious(0.03) | benign(0.022) | TCGA-AA-3864-01 | Colorectum | colon adenocarcinoma | Male | >=65 | I/II | Unknown | Unknown | SD |
| Page: 1 2 3 4 5 6 |
Top |
Related drugs of malignant transformation related genes |
| Identification of chemicals and drugs interact with genes involved in malignant transfromation |
| (DGIdb 4.0) |
| Entrez ID | Symbol | Category | Interaction Types | Drug Claim Name | Drug Name | PMIDs |
| Page: 1 |

Copyright 2023-Present -The University of Texas Health Science Center at Houston |