| Entrez ID | Symbol | Replicates | Species | Organ | Tissue | Adj P-value | Log2FC | Malignancy |
| 191 | AHCY | Dong_P3 | Human | Prostate | Tumor | 5.08e-14 | 1.88e-01 | 0.0278 |
| 191 | AHCY | Dong_P4 | Human | Prostate | Tumor | 1.38e-08 | 2.93e-01 | 0.0292 |
| 191 | AHCY | Dong_P5 | Human | Prostate | Tumor | 6.74e-28 | 1.31e-01 | 0.053 |
| 191 | AHCY | GSM5353215_PA_AUG_PB_1B_S2 | Human | Prostate | Tumor | 2.39e-02 | 2.98e-01 | 0.1557 |
| 191 | AHCY | GSM5353221_PA_PB2A_Pool_1_3_S25_L001 | Human | Prostate | Tumor | 1.55e-04 | 3.83e-01 | 0.1633 |
| 191 | AHCY | GSM5353222_PA_PB2B_Pool_1_3_S52_L002 | Human | Prostate | Tumor | 3.32e-05 | 3.81e-01 | 0.1608 |
| 191 | AHCY | GSM5353223_PA_PB2B_Pool_2_S26_L001 | Human | Prostate | Tumor | 3.06e-04 | 4.56e-01 | 0.1604 |
| 191 | AHCY | GSM5353227_PA_PR5199-193K_Pool_1_2_3_S55_L002 | Human | Prostate | Tumor | 3.05e-06 | 3.28e-01 | 0.1602 |
| 191 | AHCY | GSM5353228_PA_PR5199-640K_Pool_1_3_S108_L004 | Human | Prostate | Tumor | 2.52e-02 | 2.89e-01 | 0.1537 |
| 191 | AHCY | GSM5353232_PA_PR5249_T1_S3_L001 | Human | Prostate | Tumor | 5.68e-03 | 2.28e-01 | 0.1439 |
| 191 | AHCY | GSM5353236_PA_PR5251_T1_S7_L001 | Human | Prostate | Tumor | 6.42e-03 | 4.31e-01 | 0.1608 |
| 191 | AHCY | GSM5353237_PA_PR5251_T2_S8_L001 | Human | Prostate | Tumor | 1.44e-03 | 6.03e-01 | 0.1622 |
| 191 | AHCY | GSM5353240_PA_PR5254_T1_S15_L001 | Human | Prostate | Tumor | 1.01e-08 | 4.01e-01 | 0.1575 |
| 191 | AHCY | GSM5353243_PA_PR5261_T1_S23_L002 | Human | Prostate | Tumor | 2.74e-13 | 2.57e-01 | 0.1545 |
| 191 | AHCY | GSM5353244_PA_PR5261_T2_S24_L002 | Human | Prostate | Tumor | 2.32e-12 | 1.79e-01 | 0.1569 |
| 191 | AHCY | P4_S8_cSCC | Human | Skin | cSCC | 6.15e-12 | 1.69e-01 | -0.3095 |
| 191 | AHCY | P5_S10_cSCC | Human | Skin | cSCC | 1.80e-02 | 4.72e-02 | -0.299 |
| 191 | AHCY | P1_cSCC | Human | Skin | cSCC | 1.00e-41 | 1.41e+00 | 0.0292 |
| 191 | AHCY | P2_cSCC | Human | Skin | cSCC | 4.99e-33 | 8.46e-01 | -0.024 |
| 191 | AHCY | P4_cSCC | Human | Skin | cSCC | 6.89e-34 | 9.25e-01 | -0.00290000000000005 |
| Tissue | Expression Dynamics | Abbreviation |
| Colorectum (GSE201348) |  | FAP: Familial adenomatous polyposis |
| CRC: Colorectal cancer |
| Colorectum (HTA11) |  | AD: Adenomas |
| SER: Sessile serrated lesions |
| MSI-H: Microsatellite-high colorectal cancer |
| MSS: Microsatellite stable colorectal cancer |
| Esophagus | 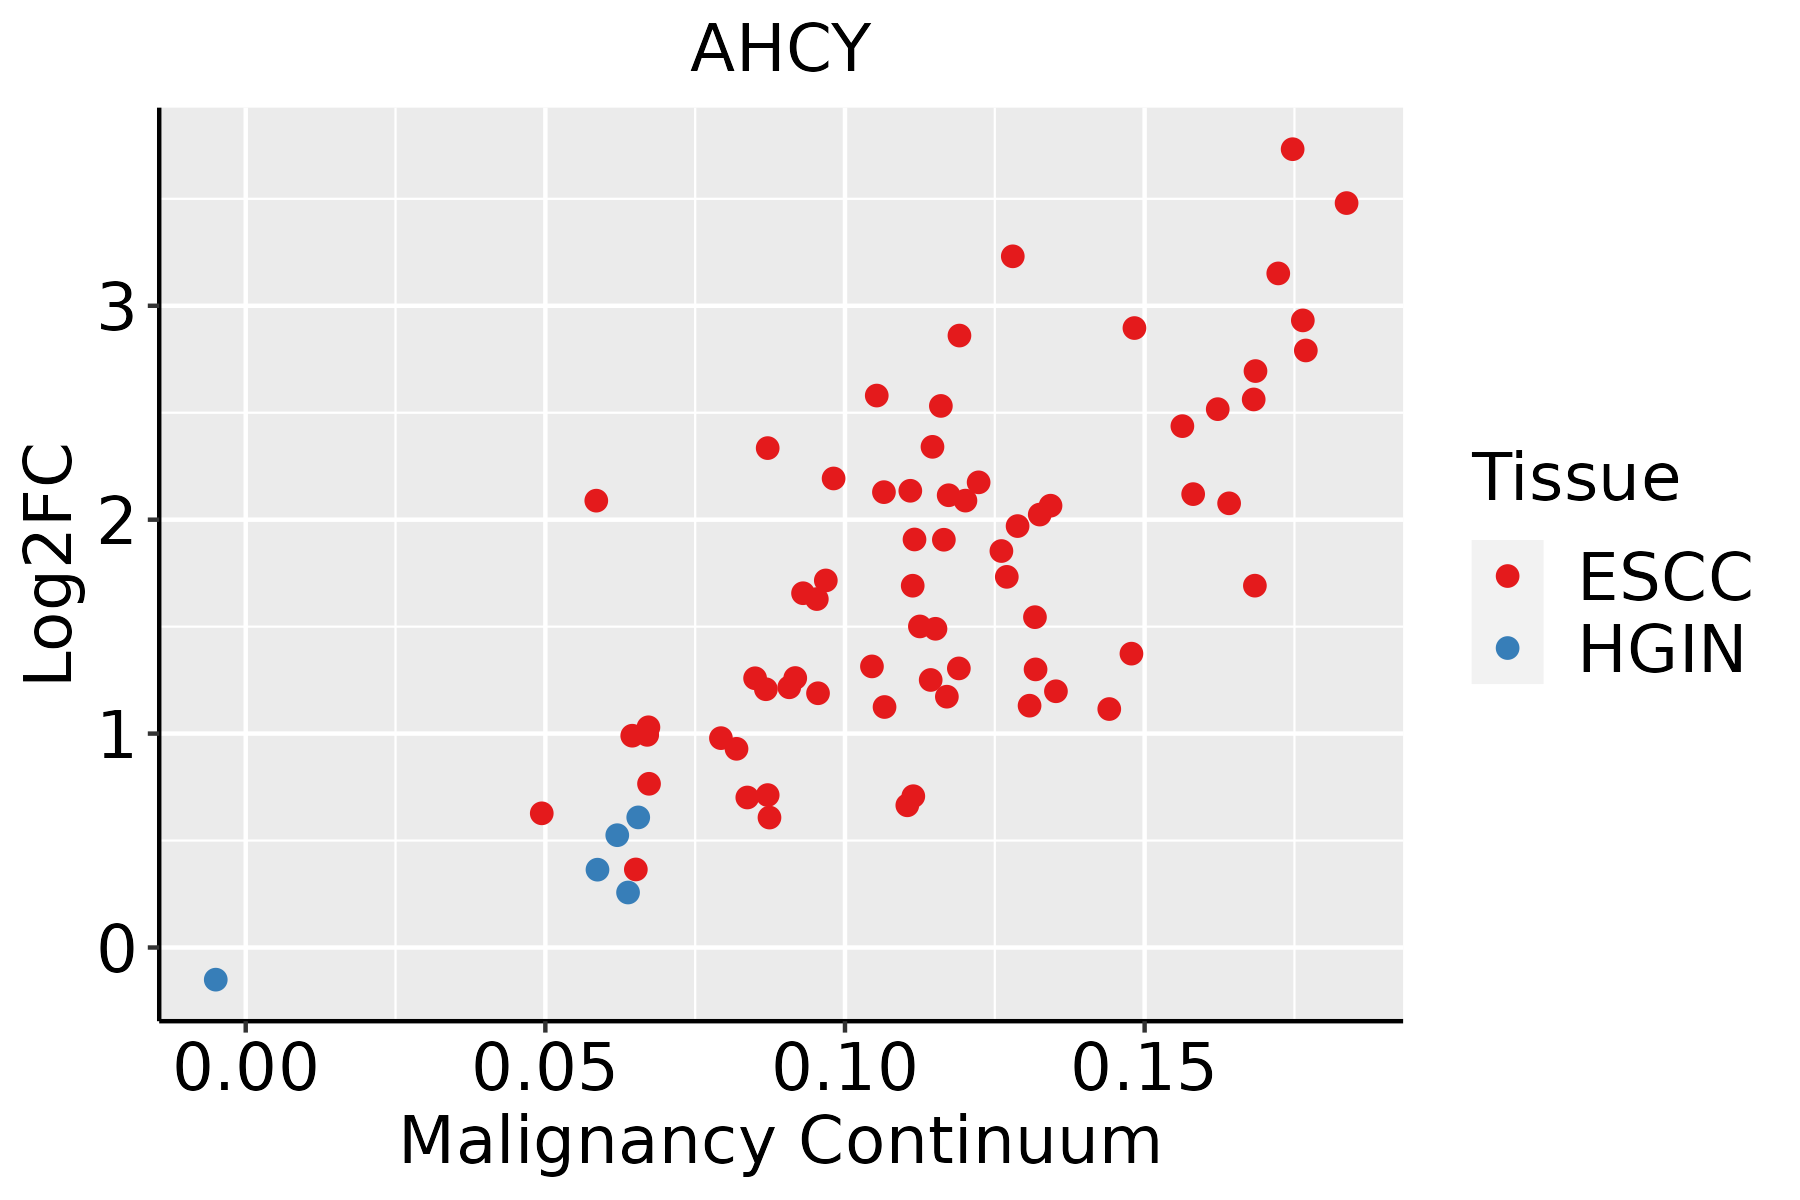 | ESCC: Esophageal squamous cell carcinoma |
| HGIN: High-grade intraepithelial neoplasias |
| LGIN: Low-grade intraepithelial neoplasias |
| Liver | 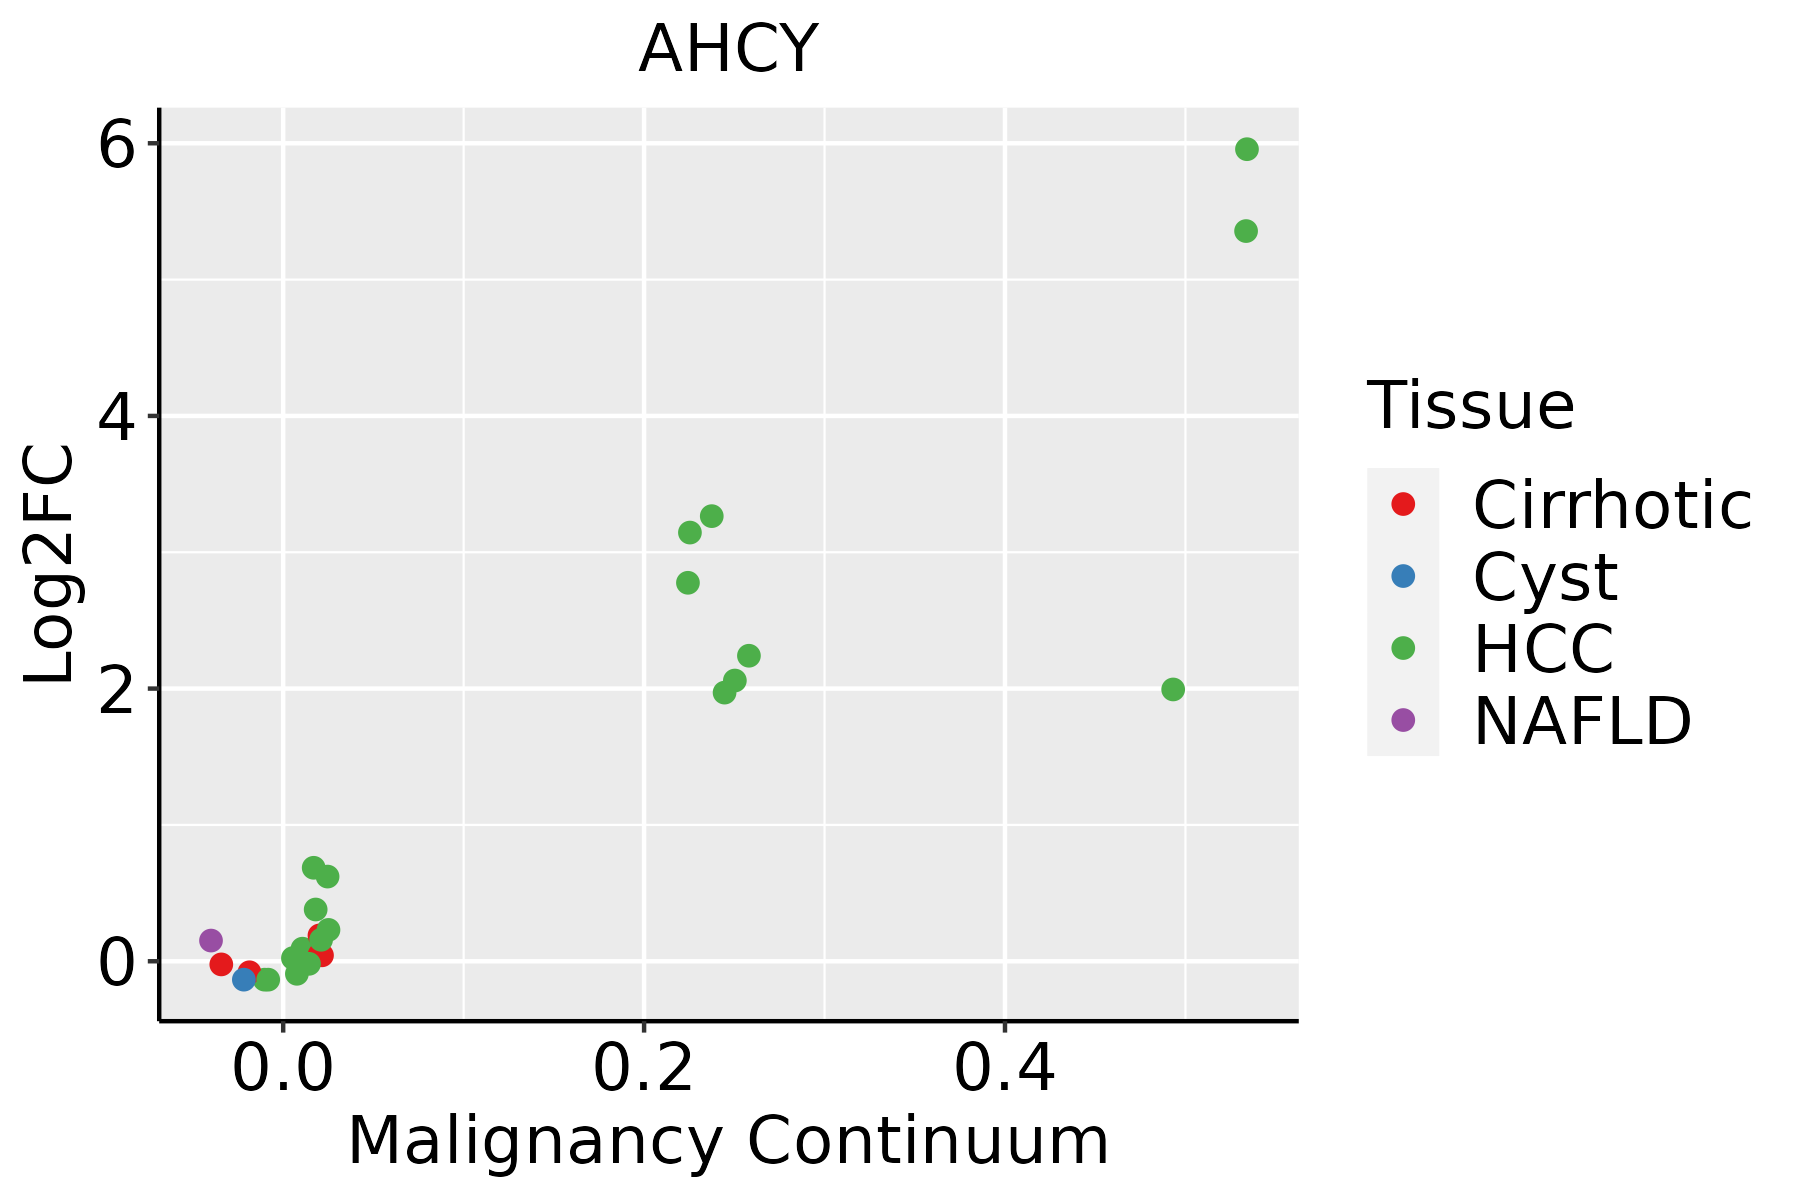 | HCC: Hepatocellular carcinoma |
| NAFLD: Non-alcoholic fatty liver disease |
| Oral Cavity | 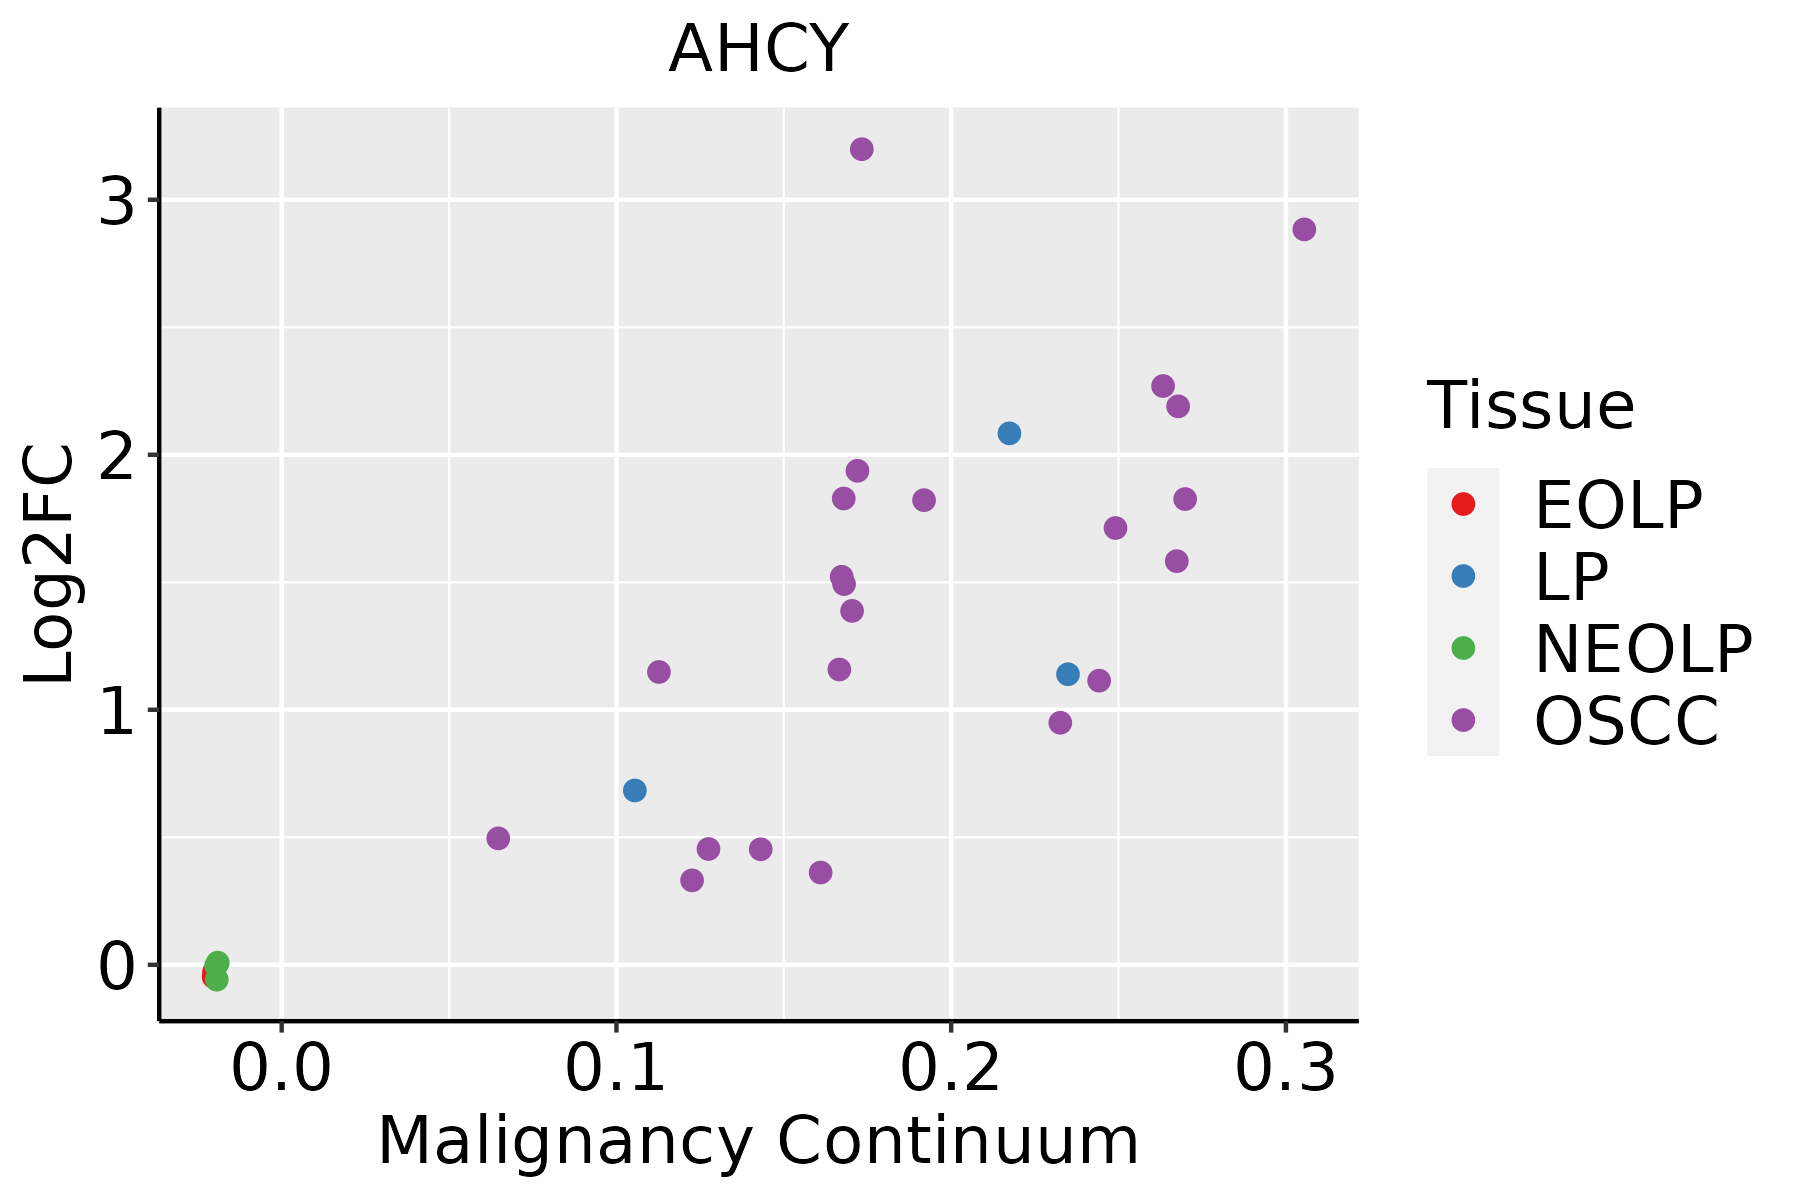 | EOLP: Erosive Oral lichen planus |
| LP: leukoplakia |
| NEOLP: Non-erosive oral lichen planus |
| OSCC: Oral squamous cell carcinoma |
| Prostate |  | BPH: Benign Prostatic Hyperplasia |
| Skin | 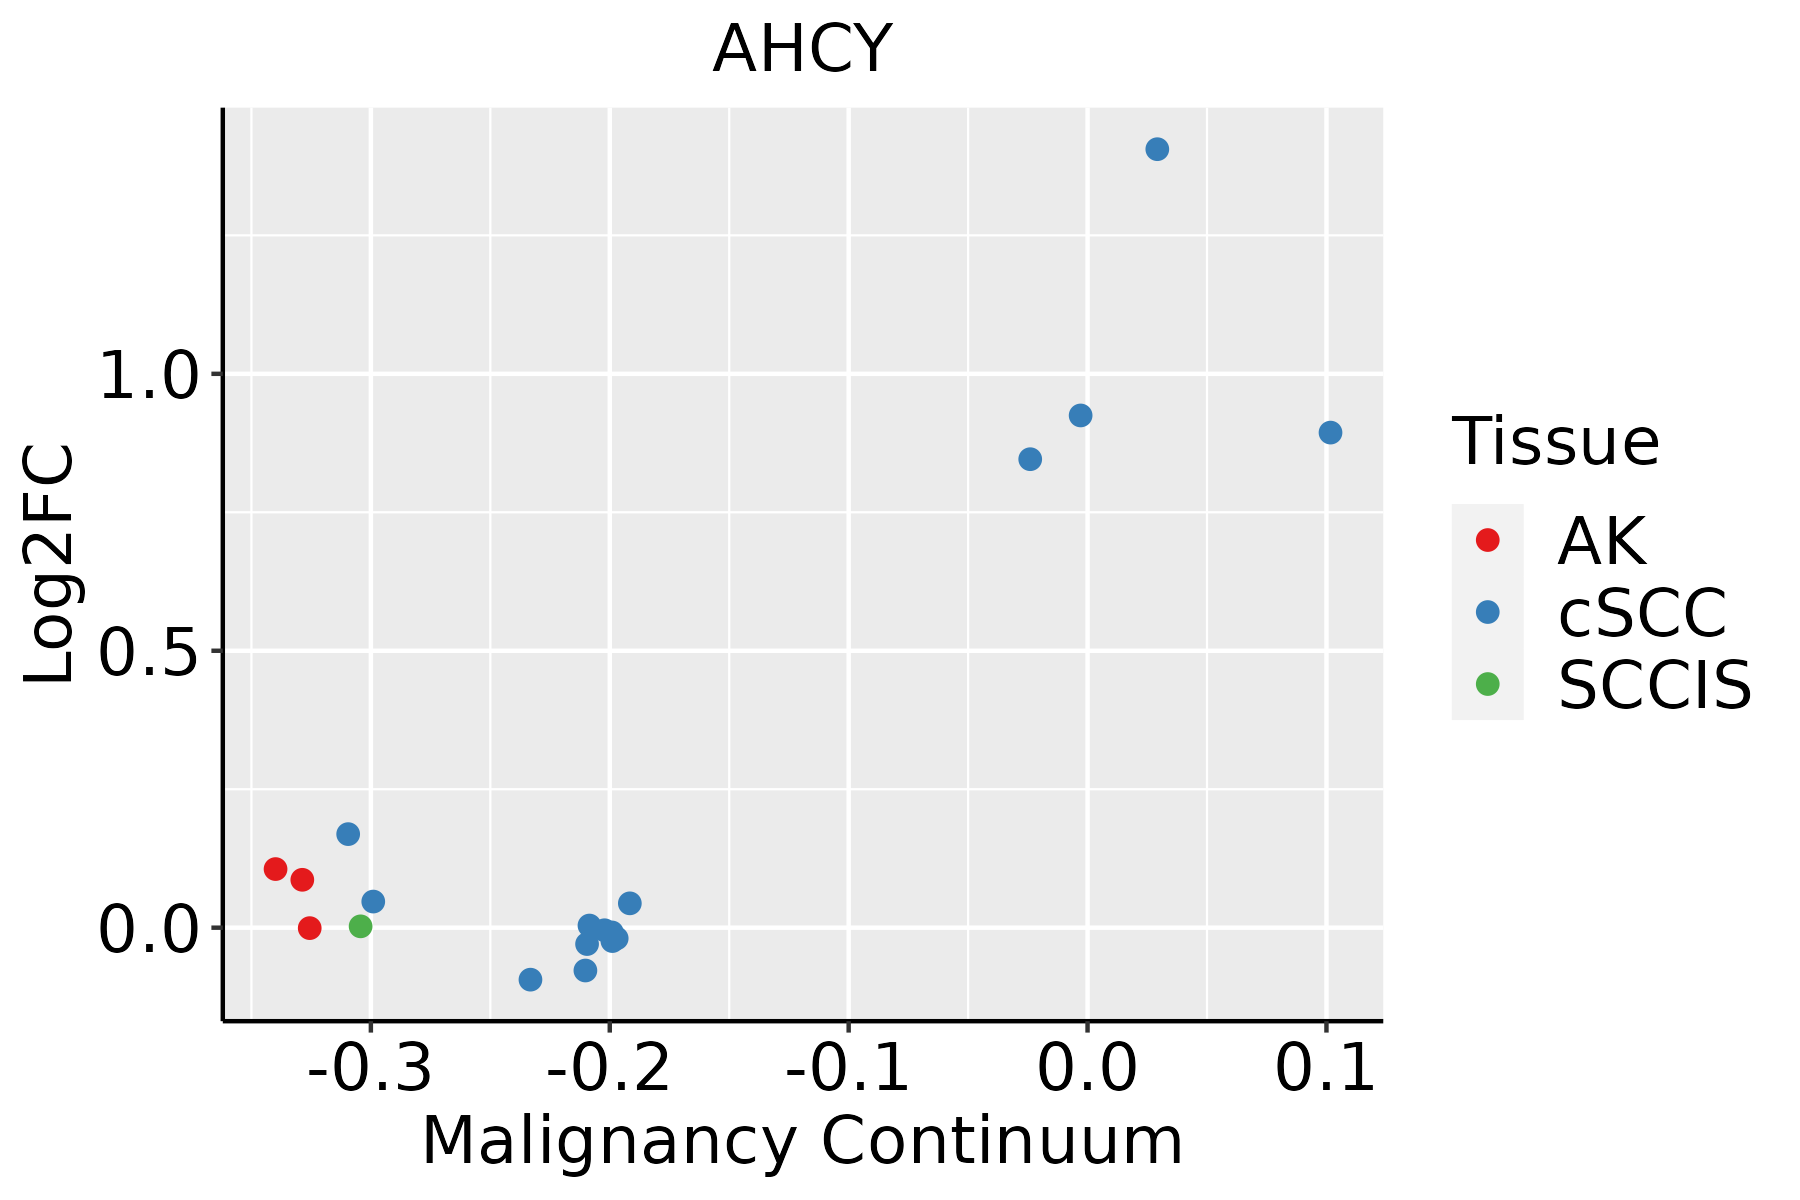 | AK: Actinic keratosis |
| cSCC: Cutaneous squamous cell carcinoma |
| SCCIS:squamous cell carcinoma in situ |
| Thyroid |  | ATC: Anaplastic thyroid cancer |
| HT: Hashimoto's thyroiditis |
| PTC: Papillary thyroid cancer |
| GO ID | Tissue | Disease Stage | Description | Gene Ratio | Bg Ratio | pvalue | p.adjust | Count |
| GO:1903311 | Colorectum | AD | regulation of mRNA metabolic process | 117/3918 | 288/18723 | 1.69e-14 | 4.23e-12 | 117 |
| GO:0072521 | Colorectum | AD | purine-containing compound metabolic process | 153/3918 | 416/18723 | 4.34e-14 | 1.01e-11 | 153 |
| GO:0050684 | Colorectum | AD | regulation of mRNA processing | 61/3918 | 137/18723 | 4.23e-10 | 3.58e-08 | 61 |
| GO:0044270 | Colorectum | AD | cellular nitrogen compound catabolic process | 147/3918 | 451/18723 | 3.35e-09 | 2.23e-07 | 147 |
| GO:0046700 | Colorectum | AD | heterocycle catabolic process | 145/3918 | 445/18723 | 4.37e-09 | 2.84e-07 | 145 |
| GO:0034655 | Colorectum | AD | nucleobase-containing compound catabolic process | 133/3918 | 407/18723 | 1.56e-08 | 9.12e-07 | 133 |
| GO:0019439 | Colorectum | AD | aromatic compound catabolic process | 146/3918 | 467/18723 | 7.48e-08 | 3.84e-06 | 146 |
| GO:1901361 | Colorectum | AD | organic cyclic compound catabolic process | 153/3918 | 495/18723 | 8.23e-08 | 4.18e-06 | 153 |
| GO:0006913 | Colorectum | AD | nucleocytoplasmic transport | 102/3918 | 301/18723 | 1.00e-07 | 4.85e-06 | 102 |
| GO:0051169 | Colorectum | AD | nuclear transport | 102/3918 | 301/18723 | 1.00e-07 | 4.85e-06 | 102 |
| GO:1901653 | Colorectum | AD | cellular response to peptide | 114/3918 | 359/18723 | 8.32e-07 | 2.88e-05 | 114 |
| GO:0044282 | Colorectum | AD | small molecule catabolic process | 118/3918 | 376/18723 | 1.05e-06 | 3.55e-05 | 118 |
| GO:0071375 | Colorectum | AD | cellular response to peptide hormone stimulus | 95/3918 | 290/18723 | 1.50e-06 | 4.66e-05 | 95 |
| GO:0043434 | Colorectum | AD | response to peptide hormone | 126/3918 | 414/18723 | 2.70e-06 | 7.86e-05 | 126 |
| GO:0007623 | Colorectum | AD | circadian rhythm | 72/3918 | 210/18723 | 4.50e-06 | 1.21e-04 | 72 |
| GO:0048511 | Colorectum | AD | rhythmic process | 94/3918 | 298/18723 | 1.00e-05 | 2.34e-04 | 94 |
| GO:0031667 | Colorectum | AD | response to nutrient levels | 138/3918 | 474/18723 | 1.22e-05 | 2.68e-04 | 138 |
| GO:0002028 | Colorectum | AD | regulation of sodium ion transport | 36/3918 | 90/18723 | 2.89e-05 | 5.37e-04 | 36 |
| GO:0006790 | Colorectum | AD | sulfur compound metabolic process | 101/3918 | 339/18723 | 6.46e-05 | 1.07e-03 | 101 |
| GO:0051168 | Colorectum | AD | nuclear export | 53/3918 | 154/18723 | 6.89e-05 | 1.11e-03 | 53 |
| Hugo Symbol | Variant Class | Variant Classification | dbSNP RS | HGVSc | HGVSp | HGVSp Short | SWISSPROT | BIOTYPE | SIFT | PolyPhen | Tumor Sample Barcode | Tissue | Histology | Sex | Age | Stage | Therapy Types | Drugs | Outcome |
| AHCY | SNV | Missense_Mutation | rs377090568 | c.1280N>T | p.Pro427Leu | p.P427L | P23526 | protein_coding | tolerated_low_confidence(0.06) | benign(0.118) | TCGA-AR-A24L-01 | Breast | breast invasive carcinoma | Female | <65 | I/II | Hormone Therapy | tamoxiphen | PD |
| AHCY | SNV | Missense_Mutation | novel | c.243C>G | p.Ile81Met | p.I81M | P23526 | protein_coding | deleterious_low_confidence(0) | probably_damaging(0.979) | TCGA-AR-A2LE-01 | Breast | breast invasive carcinoma | Female | >=65 | I/II | Hormone Therapy | tamoxiphen | PD |
| AHCY | SNV | Missense_Mutation | novel | c.635N>A | p.Ala212Asp | p.A212D | P23526 | protein_coding | deleterious_low_confidence(0) | probably_damaging(0.973) | TCGA-BH-A18Q-01 | Breast | breast invasive carcinoma | Female | <65 | I/II | Unknown | Unknown | SD |
| AHCY | SNV | Missense_Mutation | | c.322N>C | p.Glu108Gln | p.E108Q | P23526 | protein_coding | deleterious_low_confidence(0.02) | possibly_damaging(0.876) | TCGA-C8-A134-01 | Breast | breast invasive carcinoma | Female | <65 | I/II | Chemotherapy | 5-fluorouracil | CR |
| AHCY | insertion | Frame_Shift_Ins | novel | c.220-1_220insCCCAGCGACCCCACAGGAAAGAGCTGCTTTGTCCCAT | p.Val74ProfsTer54 | p.V74Pfs*54 | P23526 | protein_coding | | | TCGA-AN-A0FN-01 | Breast | breast invasive carcinoma | Female | <65 | I/II | Unknown | Unknown | SD |
| AHCY | SNV | Missense_Mutation | rs767274069 | c.1027N>T | p.Arg343Trp | p.R343W | P23526 | protein_coding | deleterious_low_confidence(0) | probably_damaging(0.966) | TCGA-2W-A8YY-01 | Cervix | cervical & endocervical cancer | Female | <65 | I/II | Chemotherapy | cisplatin | CR |
| AHCY | SNV | Missense_Mutation | novel | c.501G>A | p.Met167Ile | p.M167I | P23526 | protein_coding | deleterious_low_confidence(0) | benign(0.115) | TCGA-VS-A959-01 | Cervix | cervical & endocervical cancer | Female | >=65 | I/II | Unknown | Unknown | SD |
| AHCY | SNV | Missense_Mutation | novel | c.802G>C | p.Glu268Gln | p.E268Q | P23526 | protein_coding | tolerated_low_confidence(0.24) | benign(0.056) | TCGA-AA-3947-01 | Colorectum | colon adenocarcinoma | Female | <65 | I/II | Unknown | Unknown | SD |
| AHCY | SNV | Missense_Mutation | | c.722N>C | p.Ile241Thr | p.I241T | P23526 | protein_coding | deleterious_low_confidence(0) | possibly_damaging(0.871) | TCGA-AA-3966-01 | Colorectum | colon adenocarcinoma | Female | >=65 | I/II | Unknown | Unknown | SD |
| AHCY | SNV | Missense_Mutation | | c.1094A>G | p.Gln365Arg | p.Q365R | P23526 | protein_coding | deleterious_low_confidence(0.01) | possibly_damaging(0.829) | TCGA-AA-A010-01 | Colorectum | colon adenocarcinoma | Female | <65 | I/II | Chemotherapy | folinic | CR |


