
|
|||||
|
 | |
| |
| |
| |
| |
| |
|
Gene: ZNF22 |
Gene summary for ZNF22 |
| Gene information | Species | Human | Gene symbol | ZNF22 | Gene ID | 7570 |
| Gene name | zinc finger protein 22 | |
| Gene Alias | HKR-T1 | |
| Cytomap | 10q11.21 | |
| Gene Type | protein-coding | GO ID | GO:0006139 | UniProtAcc | A0A024R7T4 |
Top |
Malignant transformation analysis |
| Identification of the aberrant gene expression in precancerous and cancerous lesions by comparing the gene expression of stem-like cells in diseased tissues with normal stem cells |
| Entrez ID | Symbol | Replicates | Species | Organ | Tissue | Adj P-value | Log2FC | Malignancy |
| 7570 | ZNF22 | C06 | Human | Oral cavity | OSCC | 1.01e-05 | 1.23e+00 | 0.2699 |
| 7570 | ZNF22 | C07 | Human | Oral cavity | OSCC | 1.28e-02 | 6.29e-01 | 0.2491 |
| 7570 | ZNF22 | C08 | Human | Oral cavity | OSCC | 3.29e-43 | 9.65e-01 | 0.1919 |
| 7570 | ZNF22 | LN46 | Human | Oral cavity | OSCC | 2.61e-04 | 3.96e-01 | 0.1666 |
| 7570 | ZNF22 | LP17 | Human | Oral cavity | LP | 2.93e-02 | 5.60e-01 | 0.2349 |
| 7570 | ZNF22 | SYSMH2 | Human | Oral cavity | OSCC | 1.08e-09 | 4.16e-01 | 0.2326 |
| 7570 | ZNF22 | SYSMH3 | Human | Oral cavity | OSCC | 7.75e-11 | 4.17e-01 | 0.2442 |
| 7570 | ZNF22 | SYSMH4 | Human | Oral cavity | OSCC | 6.55e-04 | 6.69e-02 | 0.1226 |
| 7570 | ZNF22 | SYSMH6 | Human | Oral cavity | OSCC | 9.57e-11 | 2.83e-01 | 0.1275 |
| 7570 | ZNF22 | P1_cSCC | Human | Skin | cSCC | 1.27e-02 | 4.74e-01 | 0.0292 |
| 7570 | ZNF22 | P2_cSCC | Human | Skin | cSCC | 6.59e-04 | 3.29e-01 | -0.024 |
| 7570 | ZNF22 | P4_cSCC | Human | Skin | cSCC | 3.79e-03 | 2.02e-01 | -0.00290000000000005 |
| 7570 | ZNF22 | P10_cSCC | Human | Skin | cSCC | 4.40e-15 | 7.05e-01 | 0.1017 |
| 7570 | ZNF22 | Adj_PTCwithHT_8 | Human | Thyroid | HT | 4.27e-02 | -1.68e-01 | 0.0267 |
| 7570 | ZNF22 | male-WTA | Human | Thyroid | PTC | 1.53e-22 | 8.99e-02 | 0.1037 |
| 7570 | ZNF22 | PTC01 | Human | Thyroid | PTC | 4.94e-15 | 1.05e-01 | 0.1899 |
| 7570 | ZNF22 | PTC03 | Human | Thyroid | PTC | 6.89e-05 | 1.83e-02 | 0.1784 |
| 7570 | ZNF22 | PTC04 | Human | Thyroid | PTC | 5.33e-05 | 5.85e-02 | 0.1927 |
| 7570 | ZNF22 | PTC05 | Human | Thyroid | PTC | 1.68e-07 | 2.47e-01 | 0.2065 |
| 7570 | ZNF22 | PTC06 | Human | Thyroid | PTC | 8.61e-18 | 2.55e-01 | 0.2057 |
| Page: 1 2 3 4 5 6 7 |
| Tissue | Expression Dynamics | Abbreviation |
| Endometrium |  | AEH: Atypical endometrial hyperplasia |
| EEC: Endometrioid Cancer | ||
| Esophagus | 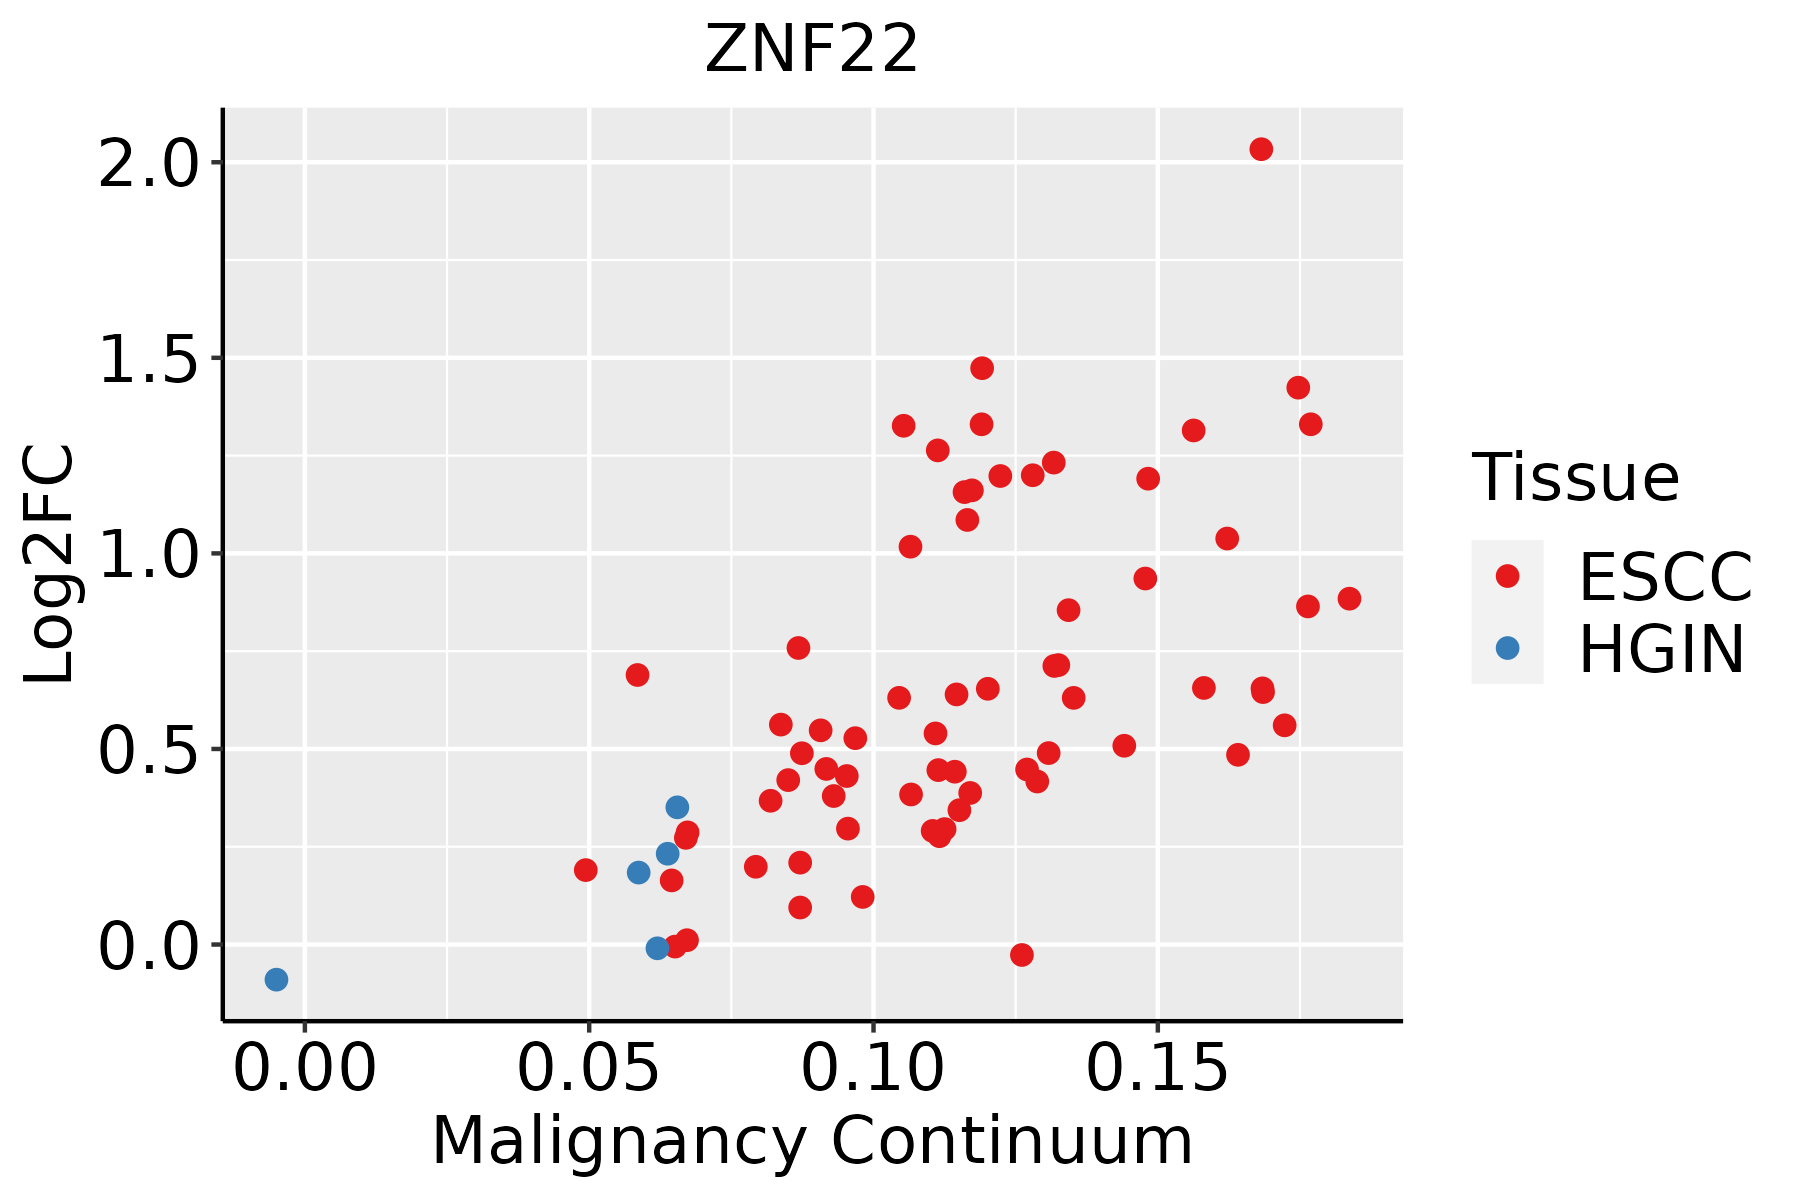 | ESCC: Esophageal squamous cell carcinoma |
| HGIN: High-grade intraepithelial neoplasias | ||
| LGIN: Low-grade intraepithelial neoplasias | ||
| Liver |  | HCC: Hepatocellular carcinoma |
| NAFLD: Non-alcoholic fatty liver disease | ||
| Oral Cavity | 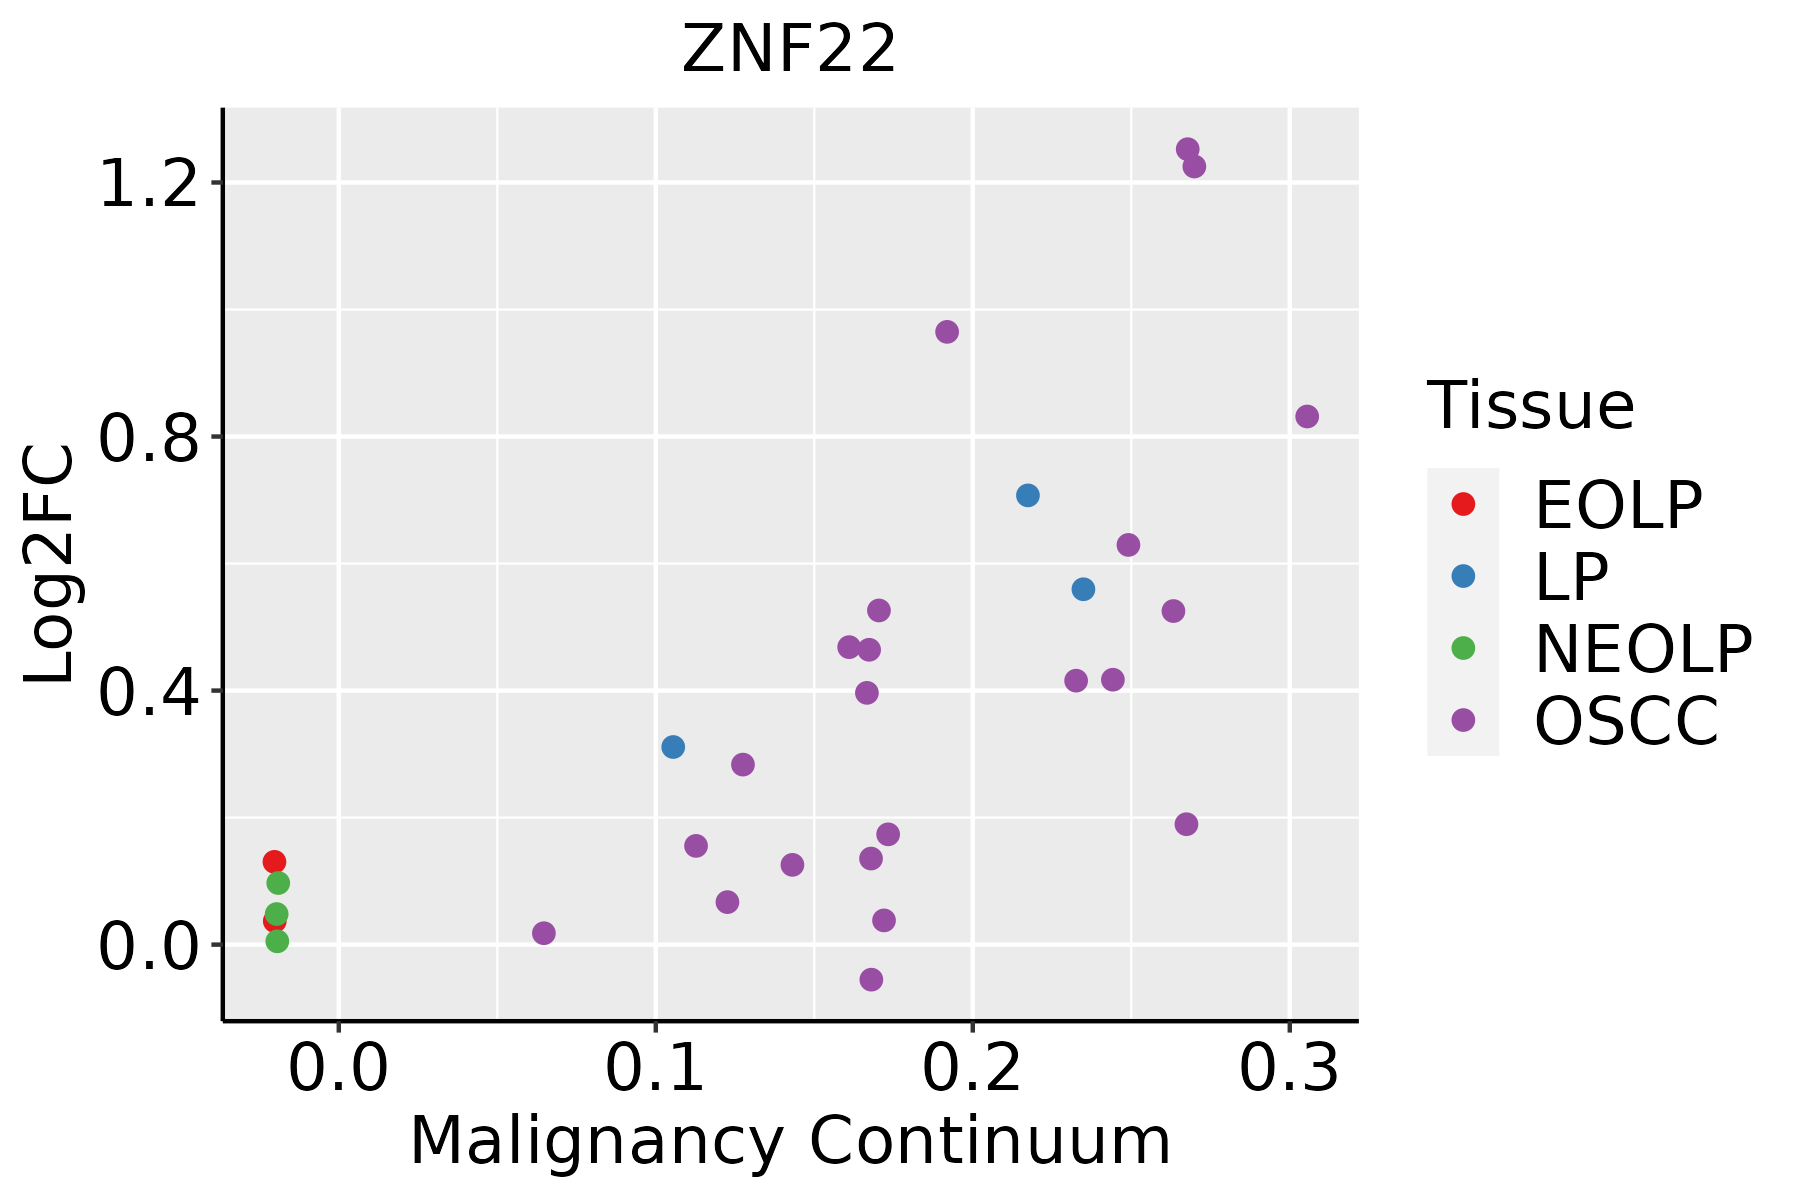 | EOLP: Erosive Oral lichen planus |
| LP: leukoplakia | ||
| NEOLP: Non-erosive oral lichen planus | ||
| OSCC: Oral squamous cell carcinoma | ||
| Prostate |  | BPH: Benign Prostatic Hyperplasia |
| Skin |  | AK: Actinic keratosis |
| cSCC: Cutaneous squamous cell carcinoma | ||
| SCCIS:squamous cell carcinoma in situ | ||
| Thyroid |  | ATC: Anaplastic thyroid cancer |
| HT: Hashimoto's thyroiditis | ||
| PTC: Papillary thyroid cancer |
| ∗log2FC in expression of this searched gene in stem-like cells from each diseased tissue sample relative to stem-like cells in normal samples in each tissue plotted against the malignancy continuum. Samples are colored based on if they are from different disease stage. |
Top |
Malignant transformation related pathway analysis |
| Find out the enriched GO biological processes and KEGG pathways involved in transition from healthy to precancer to cancer |
| Tissue | Disease Stage | Enriched GO biological Processes |
| Colorectum | AD |  |
| Colorectum | SER |  |
| Colorectum | MSS |  |
| Colorectum | MSI-H |  |
| Colorectum | FAP |  |
| ∗Top 15 enriched GO BP terms are showed in the bar plot of each disease state in each tissue. Each row represents a significant GO biological process which is colored according to the -log10(p.adjust). |
| Page: 1 2 3 4 5 6 7 8 9 |
| GO ID | Tissue | Disease Stage | Description | Gene Ratio | Bg Ratio | pvalue | p.adjust | Count |
| Page: 1 |
| Pathway ID | Tissue | Disease Stage | Description | Gene Ratio | Bg Ratio | pvalue | p.adjust | qvalue | Count |
| Page: 1 |
Top |
Cell-cell communication analysis |
| Identification of potential cell-cell interactions between two cell types and their ligand-receptor pairs for different disease states |
| Ligand | Receptor | LRpair | Pathway | Tissue | Disease Stage |
| Page: 1 |
Top |
Single-cell gene regulatory network inference analysis |
| Find out the significant the regulons (TFs) and the target genes of each regulon across cell types for different disease states |
| TF | Cell Type | Tissue | Disease Stage | Target Gene | RSS | Regulon Activity |
| ZNF22 | MON | Colorectum | ADJ | TRIB2,LIMK2,TATDN1, etc. | 2.57e-02 |  |
| ZNF22 | ILC | Colorectum | CRC | TRIB2,LIMK2,TATDN1, etc. | 2.99e-02 |  |
| ZNF22 | MON | Colorectum | FAP | TRIB2,LIMK2,TATDN1, etc. | 4.15e-02 |  |
| ZNF22 | CD8TCM | Colorectum | FAP | TRIB2,LIMK2,TATDN1, etc. | 5.77e-02 | |
| ZNF22 | DC | Colorectum | MSI-H | TRIB2,LIMK2,TATDN1, etc. | 2.58e-02 |  |
| ZNF22 | MAST | Colorectum | MSS | TRIB2,LIMK2,TATDN1, etc. | 3.04e-02 |  |
| ZNF22 | CD8TEFF | Liver | Healthy | RPS26,GZMM,LINC02446, etc. | 4.52e-03 |  |
| ∗The dot plots of a searched regulon are shown for all cell subpopulations in each disease state of each tissue based on the regulon specific score inferred using pySCENIC and by calculating the average expression. |
| Page: 1 |
Top |
Somatic mutation of malignant transformation related genes |
| Annotation of somatic variants for genes involved in malignant transformation |
| Hugo Symbol | Variant Class | Variant Classification | dbSNP RS | HGVSc | HGVSp | HGVSp Short | SWISSPROT | BIOTYPE | SIFT | PolyPhen | Tumor Sample Barcode | Tissue | Histology | Sex | Age | Stage | Therapy Types | Drugs | Outcome |
| ZNF22 | SNV | Missense_Mutation | novel | c.583N>T | p.Arg195Cys | p.R195C | P17026 | protein_coding | deleterious(0.02) | benign(0) | TCGA-3C-AALI-01 | Breast | breast invasive carcinoma | Female | <65 | I/II | Unspecific | Poly E | Complete Response |
| ZNF22 | SNV | Missense_Mutation | novel | c.292C>G | p.Leu98Val | p.L98V | P17026 | protein_coding | deleterious(0.02) | benign(0.281) | TCGA-5L-AAT1-01 | Breast | breast invasive carcinoma | Female | <65 | III/IV | Hormone Therapy | letrozol | SD |
| ZNF22 | SNV | Missense_Mutation | c.413N>T | p.Pro138Leu | p.P138L | P17026 | protein_coding | deleterious(0.01) | possibly_damaging(0.825) | TCGA-A2-A0CM-01 | Breast | breast invasive carcinoma | Female | <65 | I/II | Chemotherapy | adriamycin | PD | |
| ZNF22 | SNV | Missense_Mutation | novel | c.319G>T | p.Gly107Trp | p.G107W | P17026 | protein_coding | deleterious(0) | probably_damaging(1) | TCGA-A7-A0DB-01 | Breast | breast invasive carcinoma | Female | <65 | I/II | Hormone Therapy | arimidex | SD |
| ZNF22 | SNV | Missense_Mutation | c.118N>C | p.Asp40His | p.D40H | P17026 | protein_coding | tolerated(0.32) | benign(0.04) | TCGA-D8-A1JA-01 | Breast | breast invasive carcinoma | Female | <65 | III/IV | Chemotherapy | adriamycin | PD | |
| ZNF22 | SNV | Missense_Mutation | novel | c.167A>C | p.Lys56Thr | p.K56T | P17026 | protein_coding | tolerated(0.06) | benign(0.103) | TCGA-2W-A8YY-01 | Cervix | cervical & endocervical cancer | Female | <65 | I/II | Chemotherapy | cisplatin | CR |
| ZNF22 | SNV | Missense_Mutation | novel | c.521A>C | p.Lys174Thr | p.K174T | P17026 | protein_coding | deleterious(0) | probably_damaging(0.954) | TCGA-2W-A8YY-01 | Cervix | cervical & endocervical cancer | Female | <65 | I/II | Chemotherapy | cisplatin | CR |
| ZNF22 | SNV | Missense_Mutation | c.182N>T | p.Glu61Val | p.E61V | P17026 | protein_coding | deleterious(0) | benign(0.166) | TCGA-A6-A56B-01 | Colorectum | colon adenocarcinoma | Male | <65 | III/IV | Chemotherapy | fluorouracil | PD | |
| ZNF22 | SNV | Missense_Mutation | c.80N>A | p.Gly27Asp | p.G27D | P17026 | protein_coding | tolerated(0.05) | benign(0.007) | TCGA-AA-3713-01 | Colorectum | colon adenocarcinoma | Male | >=65 | III/IV | Chemotherapy | 5-fluorouracil | PR | |
| ZNF22 | SNV | Missense_Mutation | rs761209244 | c.584N>A | p.Arg195His | p.R195H | P17026 | protein_coding | tolerated(0.13) | benign(0) | TCGA-AA-3950-01 | Colorectum | colon adenocarcinoma | Female | >=65 | I/II | Unknown | Unknown | SD |
| Page: 1 2 3 4 |
Top |
Related drugs of malignant transformation related genes |
| Identification of chemicals and drugs interact with genes involved in malignant transfromation |
| (DGIdb 4.0) |
| Entrez ID | Symbol | Category | Interaction Types | Drug Claim Name | Drug Name | PMIDs |
| Page: 1 |

Copyright 2023-Present -The University of Texas Health Science Center at Houston |