
|
|||||
|
 | |
| |
| |
| |
| |
| |
|
Gene: YWHAH |
Gene summary for YWHAH |
| Gene information | Species | Human | Gene symbol | YWHAH | Gene ID | 7533 |
| Gene name | tyrosine 3-monooxygenase/tryptophan 5-monooxygenase activation protein eta | |
| Gene Alias | YWHA1 | |
| Cytomap | 22q12.3 | |
| Gene Type | protein-coding | GO ID | GO:0000902 | UniProtAcc | A0A024R1K7 |
Top |
Malignant transformation analysis |
| Identification of the aberrant gene expression in precancerous and cancerous lesions by comparing the gene expression of stem-like cells in diseased tissues with normal stem cells |
| Entrez ID | Symbol | Replicates | Species | Organ | Tissue | Adj P-value | Log2FC | Malignancy |
| 7533 | YWHAH | P82T-E | Human | Esophagus | ESCC | 2.97e-15 | 1.32e+00 | 0.1072 |
| 7533 | YWHAH | P83T-E | Human | Esophagus | ESCC | 1.48e-52 | 1.87e+00 | 0.1738 |
| 7533 | YWHAH | P89T-E | Human | Esophagus | ESCC | 7.72e-09 | 1.14e+00 | 0.1752 |
| 7533 | YWHAH | P91T-E | Human | Esophagus | ESCC | 5.06e-09 | 1.55e+00 | 0.1828 |
| 7533 | YWHAH | P104T-E | Human | Esophagus | ESCC | 5.85e-04 | 8.16e-01 | 0.0931 |
| 7533 | YWHAH | P107T-E | Human | Esophagus | ESCC | 1.36e-44 | 1.45e+00 | 0.171 |
| 7533 | YWHAH | P126T-E | Human | Esophagus | ESCC | 5.18e-14 | 2.03e+00 | 0.1125 |
| 7533 | YWHAH | P127T-E | Human | Esophagus | ESCC | 4.79e-18 | 4.72e-01 | 0.0826 |
| 7533 | YWHAH | P128T-E | Human | Esophagus | ESCC | 3.56e-59 | 2.93e+00 | 0.1241 |
| 7533 | YWHAH | P130T-E | Human | Esophagus | ESCC | 1.20e-100 | 2.89e+00 | 0.1676 |
| 7533 | YWHAH | S41 | Human | Liver | Cirrhotic | 1.83e-02 | 2.41e-02 | -0.0343 |
| 7533 | YWHAH | S43 | Human | Liver | Cirrhotic | 3.56e-05 | -1.99e-01 | -0.0187 |
| 7533 | YWHAH | HCC1_Meng | Human | Liver | HCC | 6.69e-79 | 6.62e-02 | 0.0246 |
| 7533 | YWHAH | HCC2_Meng | Human | Liver | HCC | 1.52e-38 | 3.22e-01 | 0.0107 |
| 7533 | YWHAH | cirrhotic1 | Human | Liver | Cirrhotic | 2.08e-10 | 1.77e-01 | 0.0202 |
| 7533 | YWHAH | cirrhotic2 | Human | Liver | Cirrhotic | 8.09e-17 | 2.52e-01 | 0.0201 |
| 7533 | YWHAH | cirrhotic3 | Human | Liver | Cirrhotic | 4.07e-08 | 1.37e-01 | 0.0215 |
| 7533 | YWHAH | HCC1 | Human | Liver | HCC | 1.24e-05 | 4.87e+00 | 0.5336 |
| 7533 | YWHAH | HCC2 | Human | Liver | HCC | 2.09e-11 | 3.83e+00 | 0.5341 |
| 7533 | YWHAH | HCC5 | Human | Liver | HCC | 2.78e-02 | 1.89e+00 | 0.4932 |
| Page: 1 2 3 4 5 6 7 8 9 10 11 12 |
| Tissue | Expression Dynamics | Abbreviation |
| Breast |  | IDC: Invasive ductal carcinoma |
| DCIS: Ductal carcinoma in situ | ||
| Precancer(BRCA1-mut): Precancerous lesion from BRCA1 mutation carriers | ||
| Colorectum (GSE201348) |  | FAP: Familial adenomatous polyposis |
| CRC: Colorectal cancer | ||
| Colorectum (HTA11) |  | AD: Adenomas |
| SER: Sessile serrated lesions | ||
| MSI-H: Microsatellite-high colorectal cancer | ||
| MSS: Microsatellite stable colorectal cancer | ||
| Esophagus | 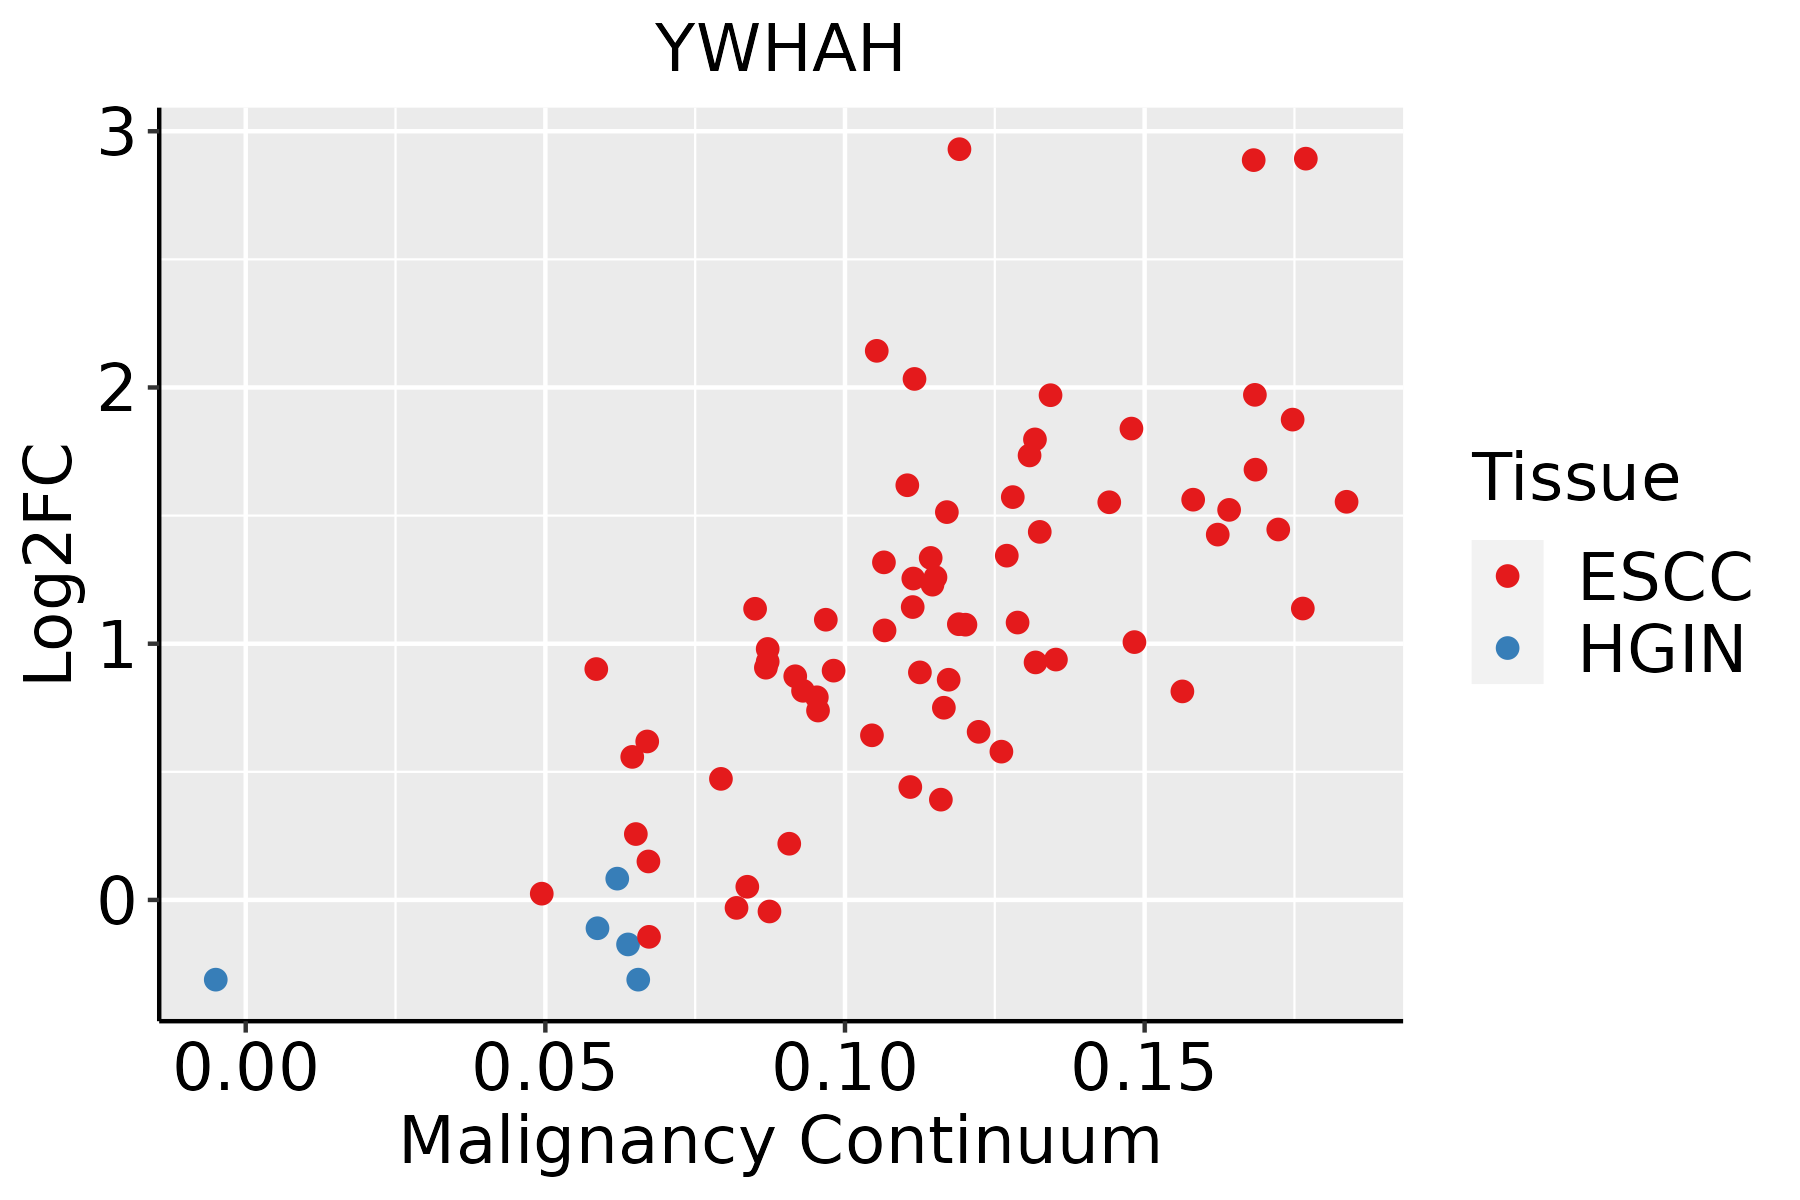 | ESCC: Esophageal squamous cell carcinoma |
| HGIN: High-grade intraepithelial neoplasias | ||
| LGIN: Low-grade intraepithelial neoplasias | ||
| GC | 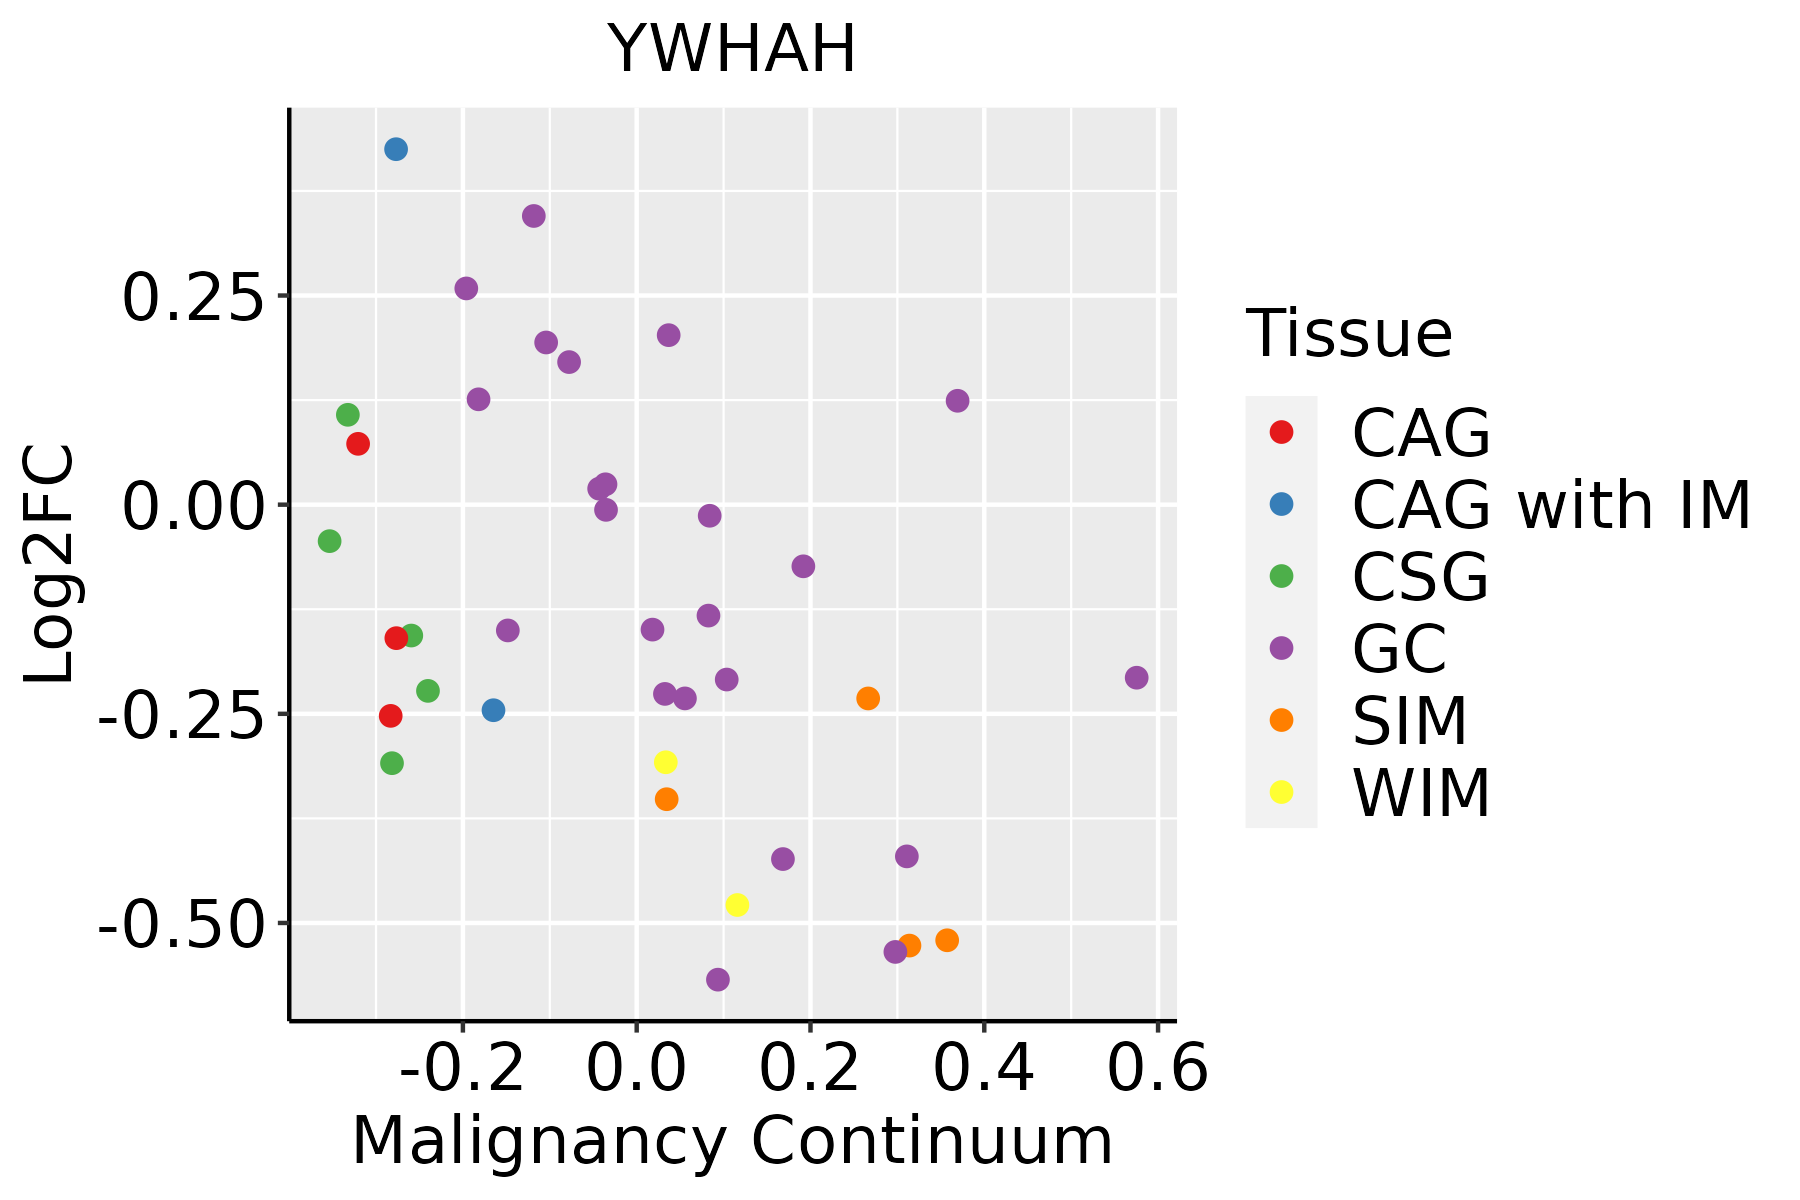 | CAG: Chronic atrophic gastritis |
| CAG with IM: Chronic atrophic gastritis with intestinal metaplasia | ||
| CSG: Chronic superficial gastritis | ||
| GC: Gastric cancer | ||
| SIM: Severe intestinal metaplasia | ||
| WIM: Wild intestinal metaplasia | ||
| Liver | 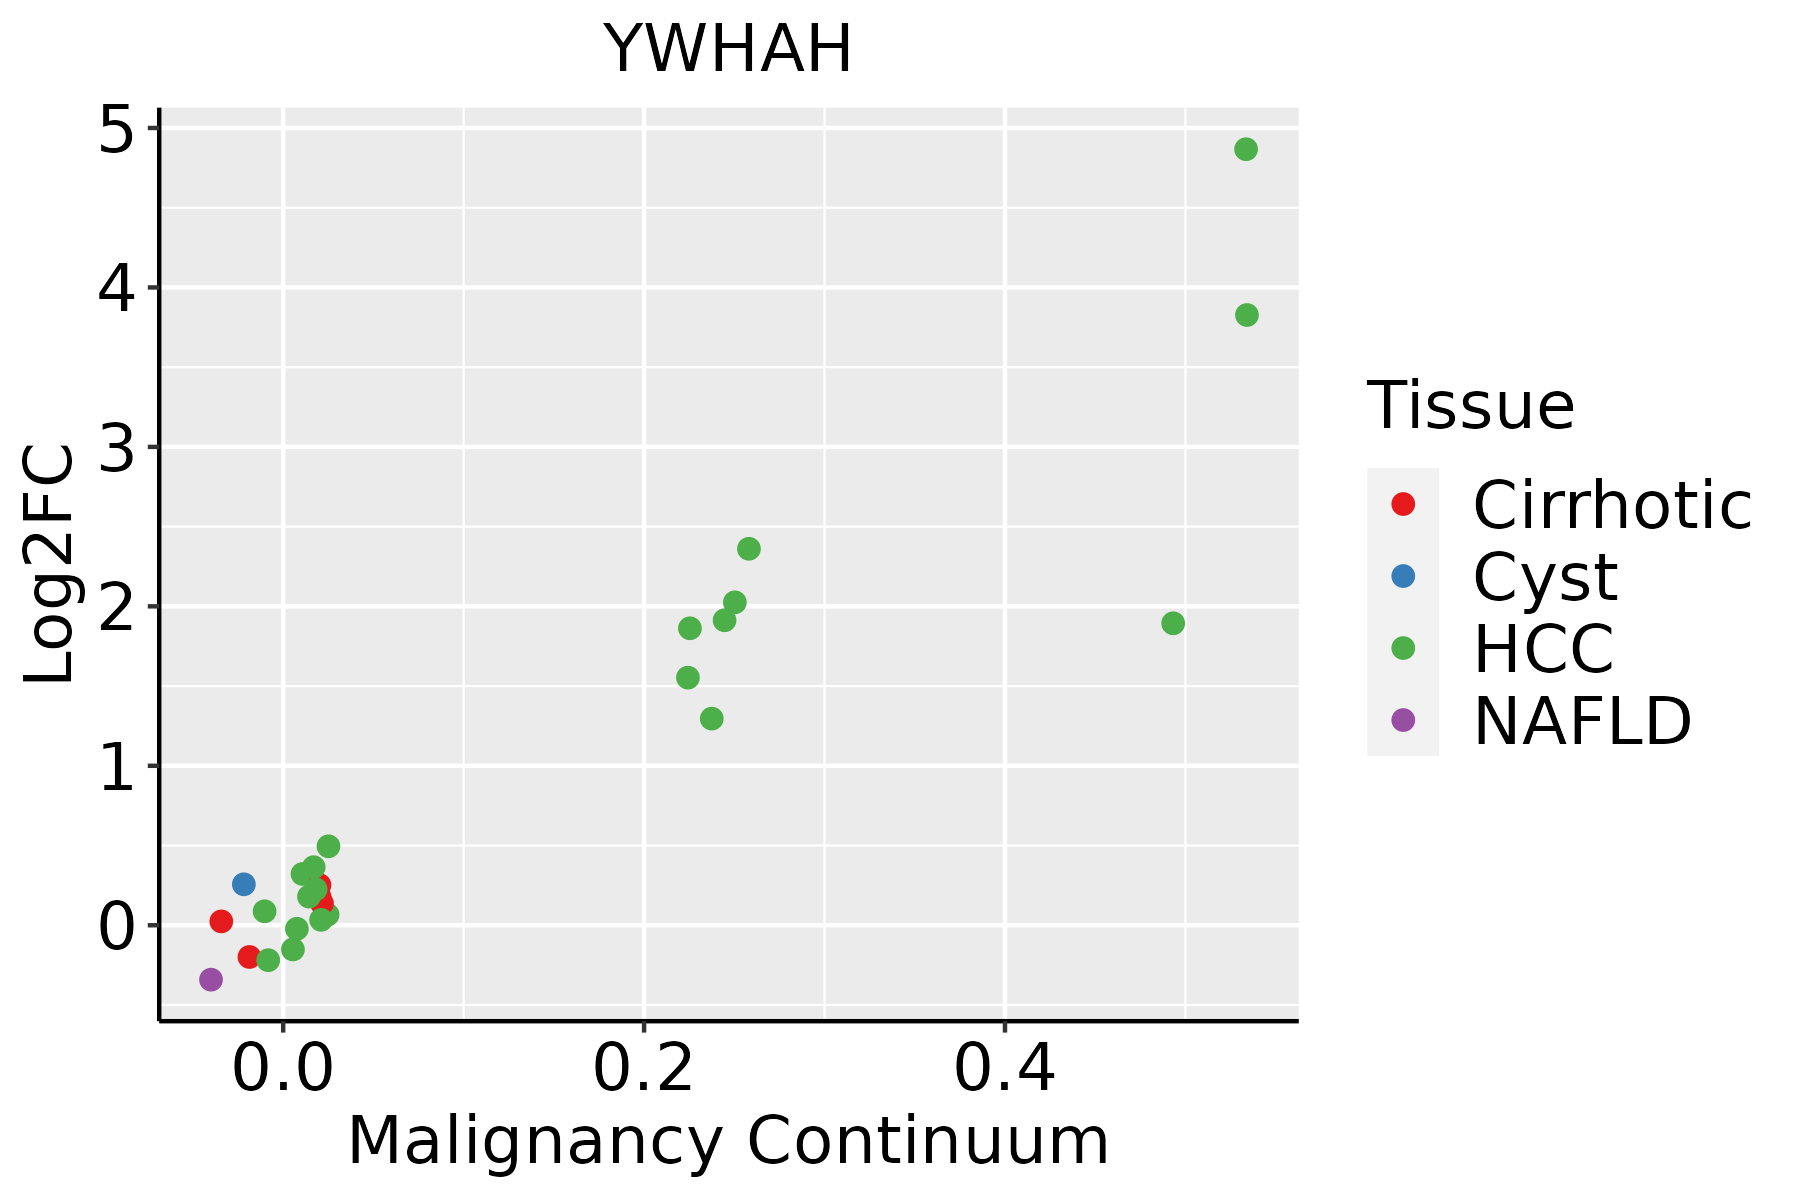 | HCC: Hepatocellular carcinoma |
| NAFLD: Non-alcoholic fatty liver disease | ||
| Oral Cavity | 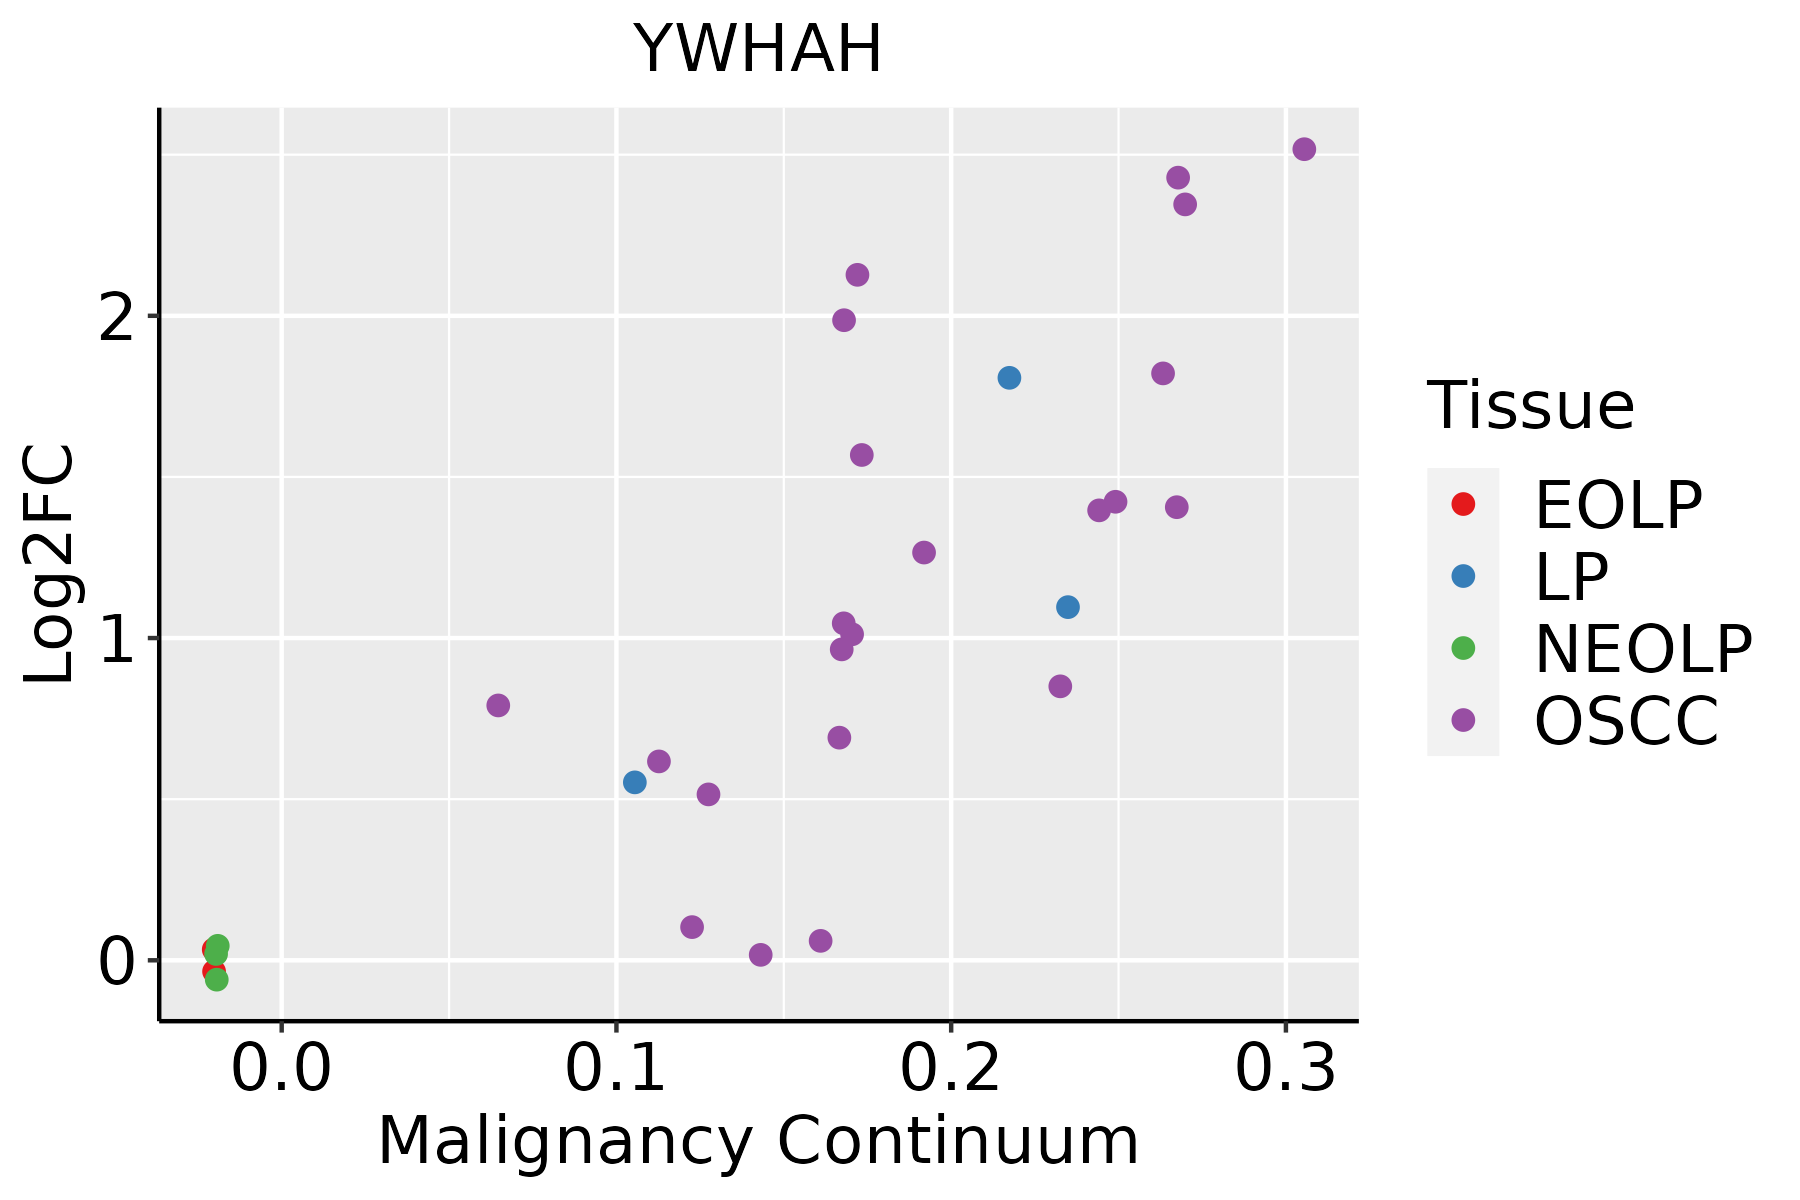 | EOLP: Erosive Oral lichen planus |
| LP: leukoplakia | ||
| NEOLP: Non-erosive oral lichen planus | ||
| OSCC: Oral squamous cell carcinoma | ||
| Prostate | 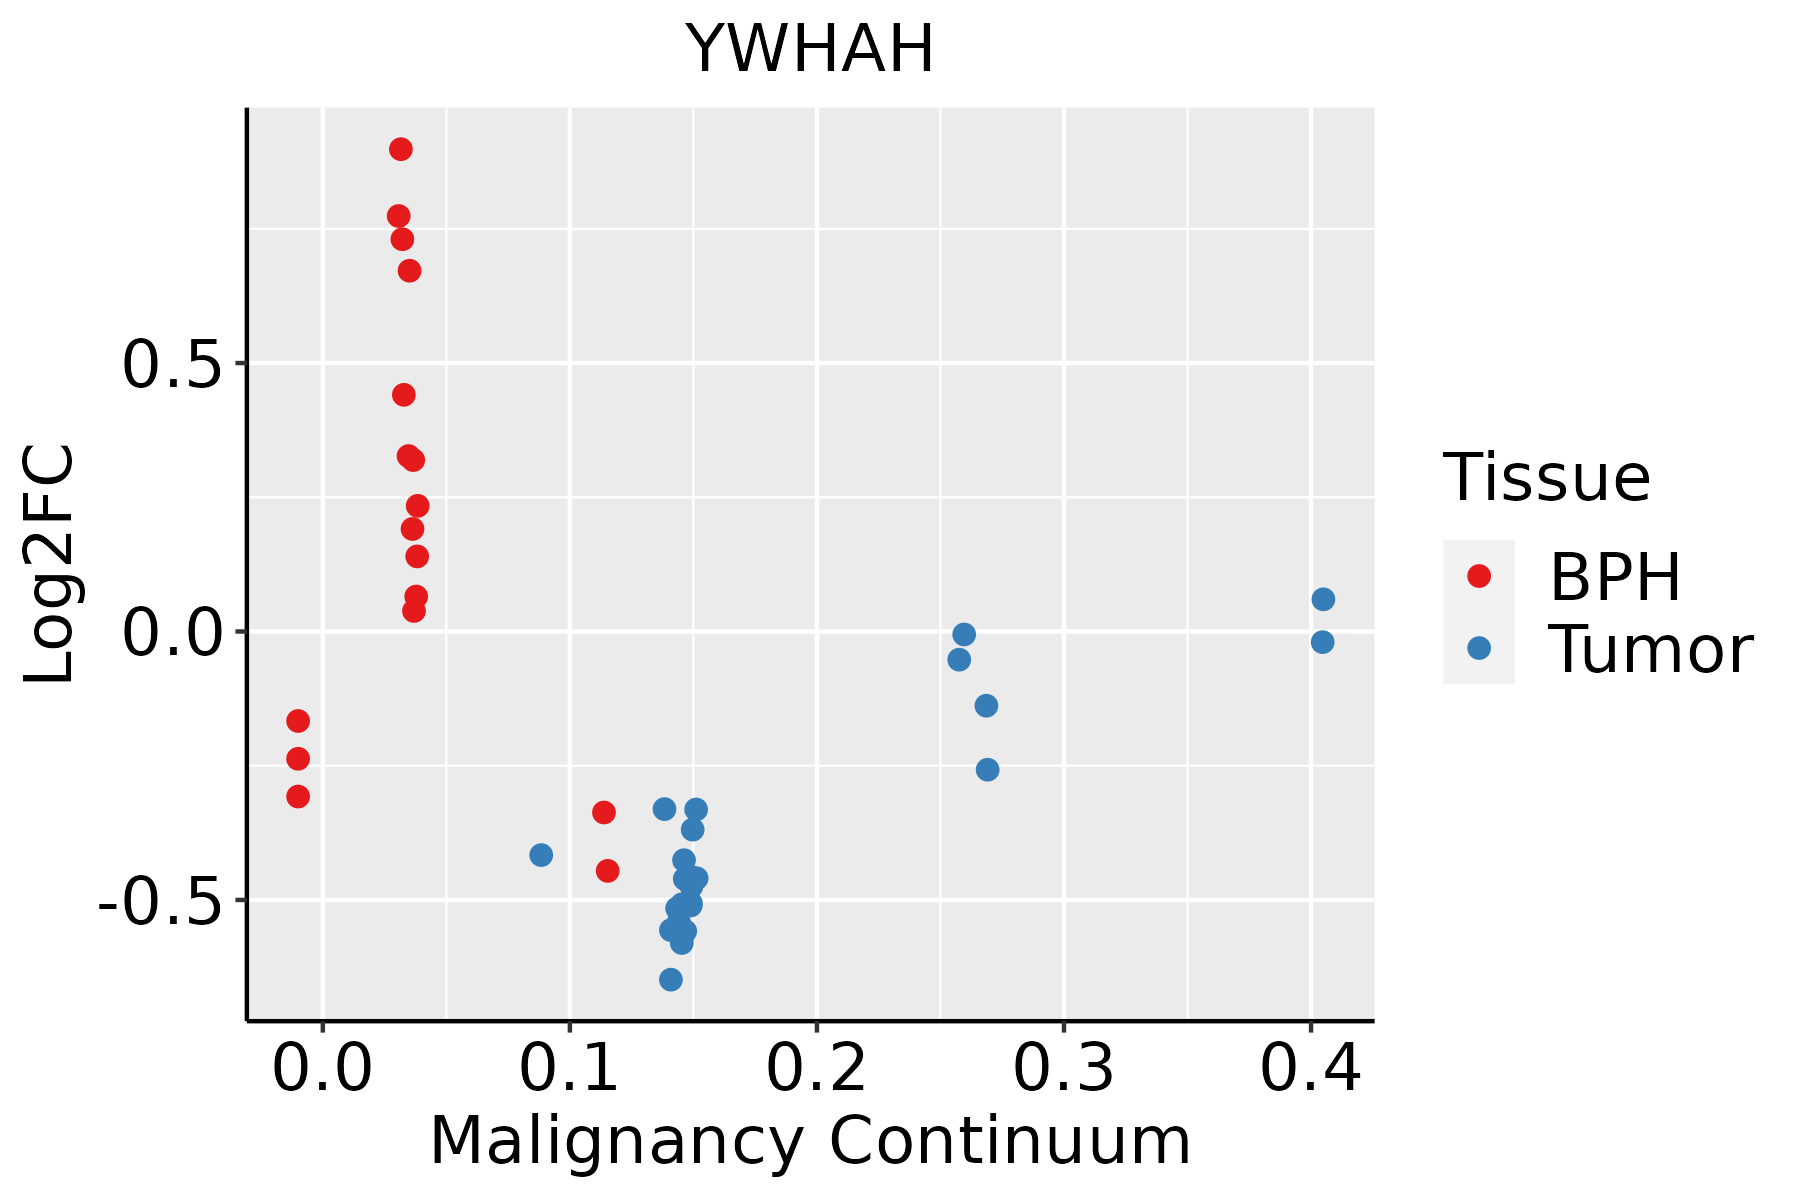 | BPH: Benign Prostatic Hyperplasia |
| Skin | 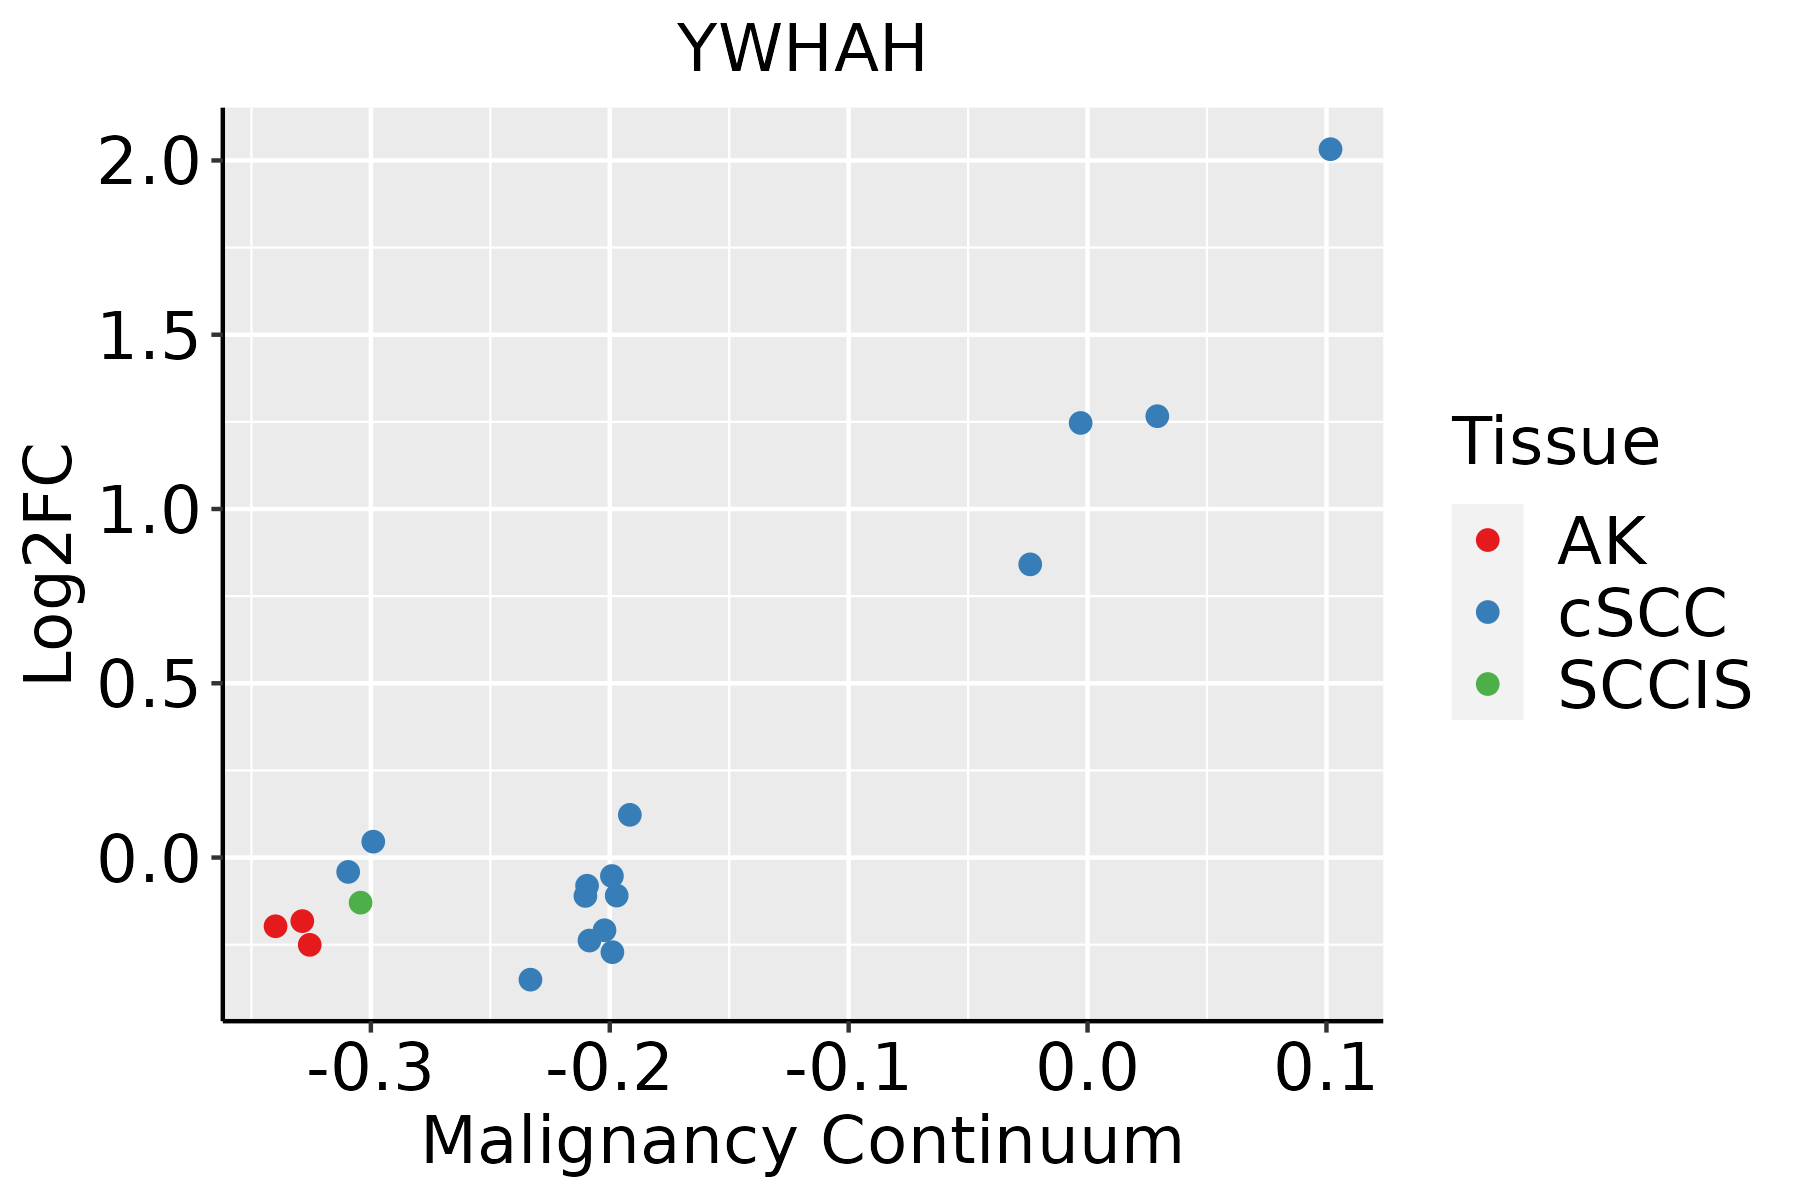 | AK: Actinic keratosis |
| cSCC: Cutaneous squamous cell carcinoma | ||
| SCCIS:squamous cell carcinoma in situ | ||
| Thyroid | 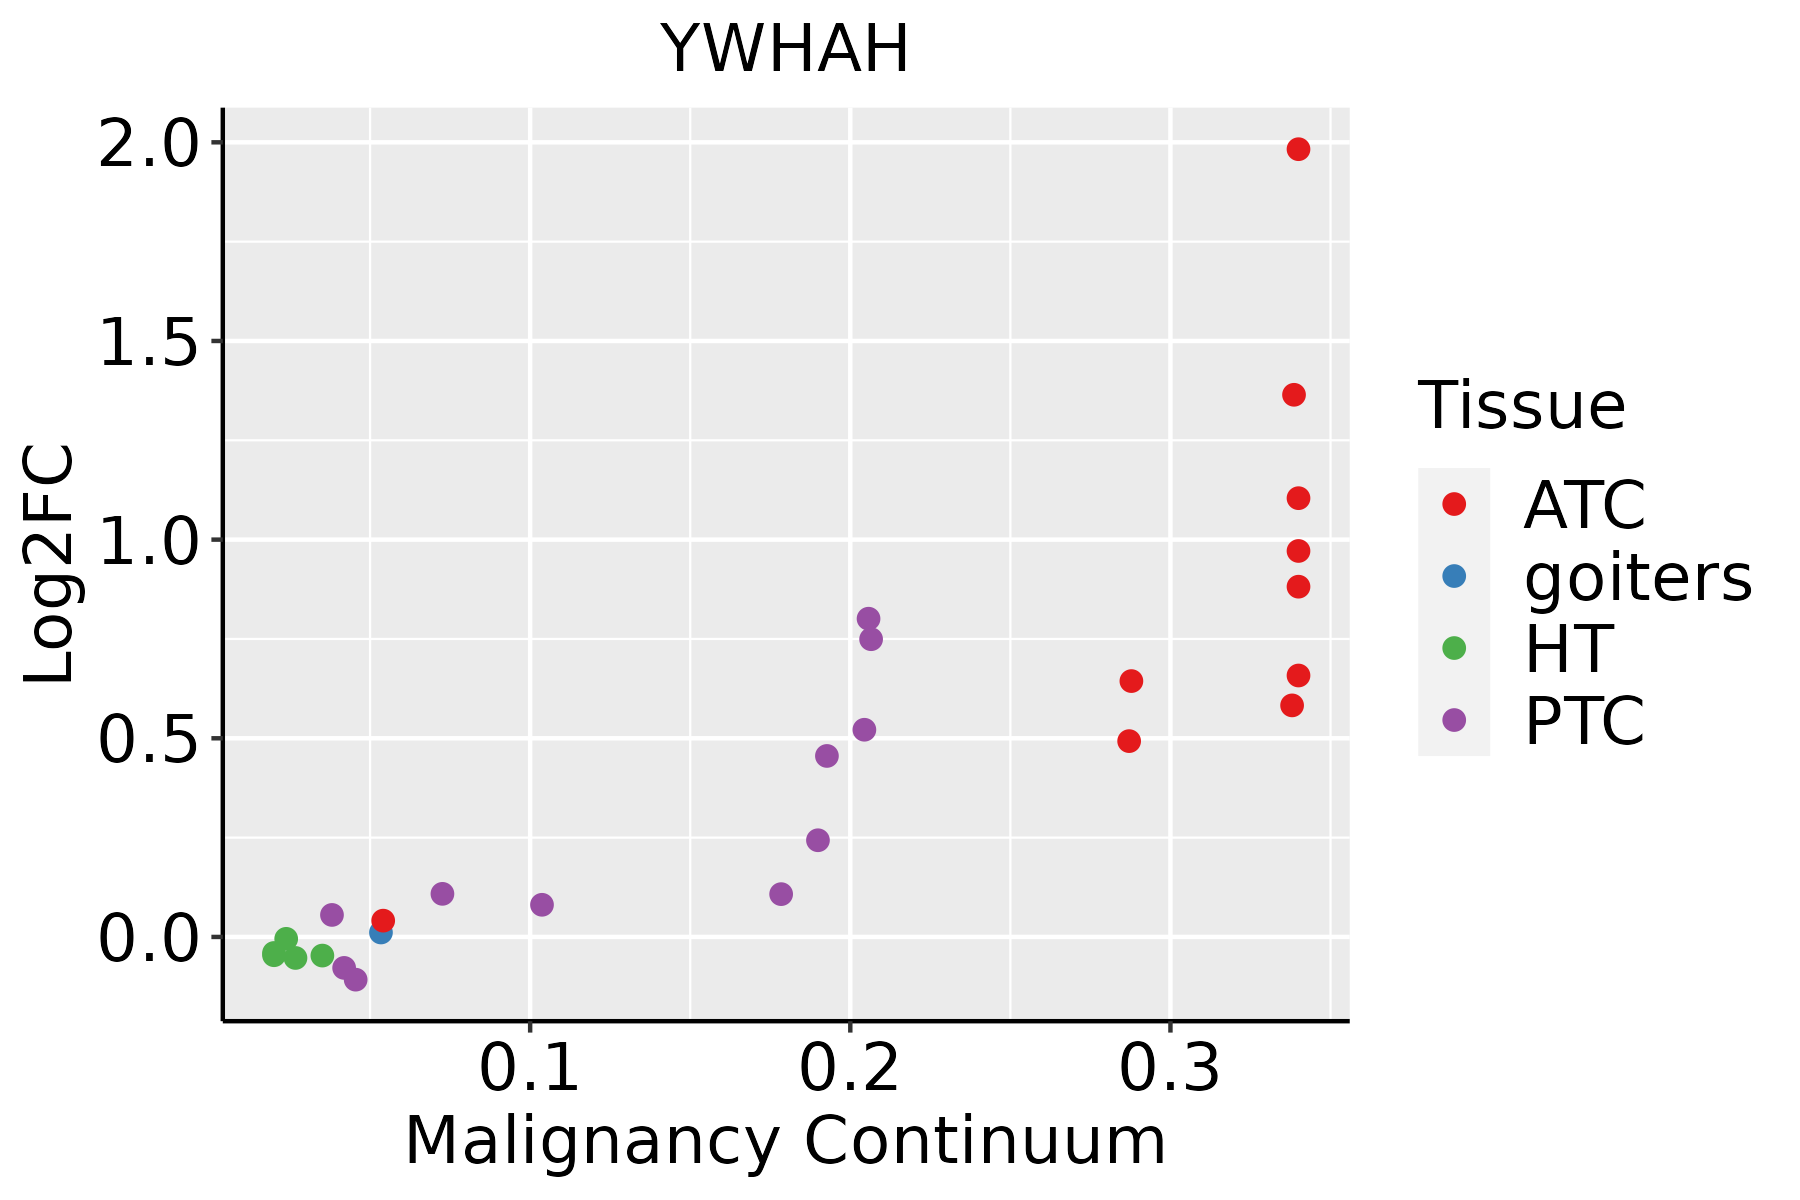 | ATC: Anaplastic thyroid cancer |
| HT: Hashimoto's thyroiditis | ||
| PTC: Papillary thyroid cancer |
| ∗log2FC in expression of this searched gene in stem-like cells from each diseased tissue sample relative to stem-like cells in normal samples in each tissue plotted against the malignancy continuum. Samples are colored based on if they are from different disease stage. |
Top |
Malignant transformation related pathway analysis |
| Find out the enriched GO biological processes and KEGG pathways involved in transition from healthy to precancer to cancer |
| Tissue | Disease Stage | Enriched GO biological Processes |
| Colorectum | AD |  |
| Colorectum | SER |  |
| Colorectum | MSS |  |
| Colorectum | MSI-H |  |
| Colorectum | FAP |  |
| ∗Top 15 enriched GO BP terms are showed in the bar plot of each disease state in each tissue. Each row represents a significant GO biological process which is colored according to the -log10(p.adjust). |
| Page: 1 2 3 4 5 6 7 8 9 |
| GO ID | Tissue | Disease Stage | Description | Gene Ratio | Bg Ratio | pvalue | p.adjust | Count |
| GO:00485459 | Breast | Precancer | response to steroid hormone | 53/1080 | 339/18723 | 3.07e-11 | 3.66e-09 | 53 |
| GO:00217629 | Breast | Precancer | substantia nigra development | 15/1080 | 44/18723 | 1.12e-08 | 7.98e-07 | 15 |
| GO:00309018 | Breast | Precancer | midbrain development | 20/1080 | 90/18723 | 1.50e-07 | 7.93e-06 | 20 |
| GO:00488578 | Breast | Precancer | neural nucleus development | 16/1080 | 64/18723 | 4.76e-07 | 2.11e-05 | 16 |
| GO:00713838 | Breast | Precancer | cellular response to steroid hormone stimulus | 28/1080 | 204/18723 | 1.78e-05 | 4.26e-04 | 28 |
| GO:00305187 | Breast | Precancer | intracellular steroid hormone receptor signaling pathway | 16/1080 | 116/18723 | 1.01e-03 | 1.13e-02 | 16 |
| GO:19013617 | Breast | Precancer | organic cyclic compound catabolic process | 45/1080 | 495/18723 | 1.73e-03 | 1.74e-02 | 45 |
| GO:00305228 | Breast | Precancer | intracellular receptor signaling pathway | 27/1080 | 265/18723 | 2.99e-03 | 2.57e-02 | 27 |
| GO:00109596 | Breast | Precancer | regulation of metal ion transport | 37/1080 | 406/18723 | 4.07e-03 | 3.22e-02 | 37 |
| GO:00434018 | Breast | Precancer | steroid hormone mediated signaling pathway | 16/1080 | 136/18723 | 5.21e-03 | 3.88e-02 | 16 |
| GO:00228985 | Breast | Precancer | regulation of transmembrane transporter activity | 27/1080 | 278/18723 | 5.72e-03 | 4.11e-02 | 27 |
| GO:004854514 | Breast | IDC | response to steroid hormone | 70/1434 | 339/18723 | 1.34e-14 | 4.23e-12 | 70 |
| GO:002176214 | Breast | IDC | substantia nigra development | 18/1434 | 44/18723 | 1.11e-09 | 1.07e-07 | 18 |
| GO:004885713 | Breast | IDC | neural nucleus development | 21/1434 | 64/18723 | 5.35e-09 | 4.28e-07 | 21 |
| GO:003090112 | Breast | IDC | midbrain development | 24/1434 | 90/18723 | 4.35e-08 | 2.87e-06 | 24 |
| GO:007138314 | Breast | IDC | cellular response to steroid hormone stimulus | 35/1434 | 204/18723 | 5.29e-06 | 1.75e-04 | 35 |
| GO:003051813 | Breast | IDC | intracellular steroid hormone receptor signaling pathway | 22/1434 | 116/18723 | 6.16e-05 | 1.28e-03 | 22 |
| GO:001095913 | Breast | IDC | regulation of metal ion transport | 52/1434 | 406/18723 | 1.76e-04 | 2.97e-03 | 52 |
| GO:003052214 | Breast | IDC | intracellular receptor signaling pathway | 37/1434 | 265/18723 | 2.77e-04 | 4.26e-03 | 37 |
| GO:004340113 | Breast | IDC | steroid hormone mediated signaling pathway | 22/1434 | 136/18723 | 6.51e-04 | 8.04e-03 | 22 |
| Page: 1 2 3 4 5 6 7 8 9 10 11 12 13 14 15 16 17 |
| Pathway ID | Tissue | Disease Stage | Description | Gene Ratio | Bg Ratio | pvalue | p.adjust | qvalue | Count |
| hsa052036 | Breast | Precancer | Viral carcinogenesis | 27/684 | 204/8465 | 7.19e-03 | 4.06e-02 | 3.11e-02 | 27 |
| hsa0520312 | Breast | Precancer | Viral carcinogenesis | 27/684 | 204/8465 | 7.19e-03 | 4.06e-02 | 3.11e-02 | 27 |
| hsa0520322 | Breast | IDC | Viral carcinogenesis | 34/867 | 204/8465 | 2.82e-03 | 1.86e-02 | 1.39e-02 | 34 |
| hsa0520332 | Breast | IDC | Viral carcinogenesis | 34/867 | 204/8465 | 2.82e-03 | 1.86e-02 | 1.39e-02 | 34 |
| hsa0520341 | Breast | DCIS | Viral carcinogenesis | 34/846 | 204/8465 | 1.88e-03 | 1.27e-02 | 9.33e-03 | 34 |
| hsa052035 | Breast | DCIS | Viral carcinogenesis | 34/846 | 204/8465 | 1.88e-03 | 1.27e-02 | 9.33e-03 | 34 |
| hsa05160 | Colorectum | AD | Hepatitis C | 54/2092 | 157/8465 | 3.87e-03 | 1.96e-02 | 1.25e-02 | 54 |
| hsa051601 | Colorectum | AD | Hepatitis C | 54/2092 | 157/8465 | 3.87e-03 | 1.96e-02 | 1.25e-02 | 54 |
| hsa051602 | Colorectum | MSS | Hepatitis C | 52/1875 | 157/8465 | 9.29e-04 | 5.58e-03 | 3.42e-03 | 52 |
| hsa04390 | Colorectum | MSS | Hippo signaling pathway | 48/1875 | 157/8465 | 8.32e-03 | 3.10e-02 | 1.90e-02 | 48 |
| hsa051603 | Colorectum | MSS | Hepatitis C | 52/1875 | 157/8465 | 9.29e-04 | 5.58e-03 | 3.42e-03 | 52 |
| hsa043901 | Colorectum | MSS | Hippo signaling pathway | 48/1875 | 157/8465 | 8.32e-03 | 3.10e-02 | 1.90e-02 | 48 |
| hsa0411023 | Esophagus | ESCC | Cell cycle | 126/4205 | 157/8465 | 1.34e-15 | 5.60e-14 | 2.87e-14 | 126 |
| hsa0520325 | Esophagus | ESCC | Viral carcinogenesis | 137/4205 | 204/8465 | 2.47e-07 | 1.88e-06 | 9.62e-07 | 137 |
| hsa051609 | Esophagus | ESCC | Hepatitis C | 107/4205 | 157/8465 | 1.75e-06 | 1.08e-05 | 5.55e-06 | 107 |
| hsa041517 | Esophagus | ESCC | PI3K-Akt signaling pathway | 197/4205 | 354/8465 | 1.24e-02 | 2.83e-02 | 1.45e-02 | 197 |
| hsa0439018 | Esophagus | ESCC | Hippo signaling pathway | 92/4205 | 157/8465 | 1.46e-02 | 3.31e-02 | 1.69e-02 | 92 |
| hsa041146 | Esophagus | ESCC | Oocyte meiosis | 77/4205 | 131/8465 | 2.19e-02 | 4.80e-02 | 2.46e-02 | 77 |
| hsa0411033 | Esophagus | ESCC | Cell cycle | 126/4205 | 157/8465 | 1.34e-15 | 5.60e-14 | 2.87e-14 | 126 |
| hsa0520335 | Esophagus | ESCC | Viral carcinogenesis | 137/4205 | 204/8465 | 2.47e-07 | 1.88e-06 | 9.62e-07 | 137 |
| Page: 1 2 3 4 5 |
Top |
Cell-cell communication analysis |
| Identification of potential cell-cell interactions between two cell types and their ligand-receptor pairs for different disease states |
| Ligand | Receptor | LRpair | Pathway | Tissue | Disease Stage |
| Page: 1 |
Top |
Single-cell gene regulatory network inference analysis |
| Find out the significant the regulons (TFs) and the target genes of each regulon across cell types for different disease states |
| TF | Cell Type | Tissue | Disease Stage | Target Gene | RSS | Regulon Activity |
| ∗The dot plots of a searched regulon are shown for all cell subpopulations in each disease state of each tissue based on the regulon specific score inferred using pySCENIC and by calculating the average expression. |
| Page: 1 |
Top |
Somatic mutation of malignant transformation related genes |
| Annotation of somatic variants for genes involved in malignant transformation |
| Hugo Symbol | Variant Class | Variant Classification | dbSNP RS | HGVSc | HGVSp | HGVSp Short | SWISSPROT | BIOTYPE | SIFT | PolyPhen | Tumor Sample Barcode | Tissue | Histology | Sex | Age | Stage | Therapy Types | Drugs | Outcome |
| YWHAH | insertion | Nonsense_Mutation | novel | c.290_291insTTCCCTCTGGAGGTTCTGTCCTTACAGATTGGTTTAAGTAATAC | p.Asn98SerfsTer12 | p.N98Sfs*12 | Q04917 | protein_coding | TCGA-A8-A0A1-01 | Breast | breast invasive carcinoma | Female | >=65 | I/II | Hormone Therapy | tamoxiphen | SD | ||
| YWHAH | SNV | Missense_Mutation | c.541N>A | p.Val181Met | p.V181M | Q04917 | protein_coding | deleterious_low_confidence(0.01) | probably_damaging(1) | TCGA-F4-6808-01 | Colorectum | colon adenocarcinoma | Female | <65 | I/II | Unknown | Unknown | SD | |
| YWHAH | SNV | Missense_Mutation | c.231N>T | p.Lys77Asn | p.K77N | Q04917 | protein_coding | tolerated_low_confidence(0.07) | probably_damaging(0.999) | TCGA-AG-3892-01 | Colorectum | rectum adenocarcinoma | Female | <65 | I/II | Unknown | Unknown | SD | |
| YWHAH | SNV | Missense_Mutation | novel | c.334T>G | p.Cys112Gly | p.C112G | Q04917 | protein_coding | deleterious_low_confidence(0) | probably_damaging(0.999) | TCGA-AP-A05N-01 | Endometrium | uterine corpus endometrioid carcinoma | Female | <65 | I/II | Unknown | Unknown | SD |
| YWHAH | SNV | Missense_Mutation | c.604G>A | p.Asp202Asn | p.D202N | Q04917 | protein_coding | deleterious_low_confidence(0.01) | probably_damaging(0.997) | TCGA-AP-A0LM-01 | Endometrium | uterine corpus endometrioid carcinoma | Female | <65 | III/IV | Chemotherapy | cisplatin | SD | |
| YWHAH | SNV | Missense_Mutation | c.231G>T | p.Lys77Asn | p.K77N | Q04917 | protein_coding | tolerated_low_confidence(0.07) | probably_damaging(0.999) | TCGA-AX-A0J0-01 | Endometrium | uterine corpus endometrioid carcinoma | Female | <65 | I/II | Unknown | Unknown | SD | |
| YWHAH | SNV | Missense_Mutation | c.125N>A | p.Arg42Gln | p.R42Q | Q04917 | protein_coding | deleterious_low_confidence(0.02) | probably_damaging(0.998) | TCGA-B5-A11E-01 | Endometrium | uterine corpus endometrioid carcinoma | Female | <65 | I/II | Unknown | Unknown | SD | |
| YWHAH | SNV | Missense_Mutation | novel | c.194N>A | p.Ser65Asn | p.S65N | Q04917 | protein_coding | deleterious_low_confidence(0) | probably_damaging(0.972) | TCGA-B5-A3FC-01 | Endometrium | uterine corpus endometrioid carcinoma | Female | <65 | I/II | Unknown | Unknown | SD |
| YWHAH | SNV | Missense_Mutation | novel | c.334N>G | p.Cys112Gly | p.C112G | Q04917 | protein_coding | deleterious_low_confidence(0) | probably_damaging(0.999) | TCGA-D1-A0ZP-01 | Endometrium | uterine corpus endometrioid carcinoma | Female | <65 | III/IV | Chemotherapy | paclitaxel | PD |
| YWHAH | SNV | Missense_Mutation | novel | c.706N>A | p.Asp236Asn | p.D236N | Q04917 | protein_coding | deleterious_low_confidence(0.01) | probably_damaging(0.996) | TCGA-EO-A22R-01 | Endometrium | uterine corpus endometrioid carcinoma | Female | <65 | I/II | Unknown | Unknown | SD |
| Page: 1 2 3 |
Top |
Related drugs of malignant transformation related genes |
| Identification of chemicals and drugs interact with genes involved in malignant transfromation |
| (DGIdb 4.0) |
| Entrez ID | Symbol | Category | Interaction Types | Drug Claim Name | Drug Name | PMIDs |
| Page: 1 |

Copyright 2023-Present -The University of Texas Health Science Center at Houston |