
|
|||||
|
 | |
| |
| |
| |
| |
| |
|
Gene: WSB1 |
Gene summary for WSB1 |
| Gene information | Species | Human | Gene symbol | WSB1 | Gene ID | 26118 |
| Gene name | WD repeat and SOCS box containing 1 | |
| Gene Alias | SWIP1 | |
| Cytomap | 17q11.1 | |
| Gene Type | protein-coding | GO ID | GO:0006464 | UniProtAcc | Q8NC76 |
Top |
Malignant transformation analysis |
| Identification of the aberrant gene expression in precancerous and cancerous lesions by comparing the gene expression of stem-like cells in diseased tissues with normal stem cells |
| Entrez ID | Symbol | Replicates | Species | Organ | Tissue | Adj P-value | Log2FC | Malignancy |
| 26118 | WSB1 | P36T-E | Human | Esophagus | ESCC | 3.66e-36 | 1.67e+00 | 0.1187 |
| 26118 | WSB1 | P37T-E | Human | Esophagus | ESCC | 7.97e-26 | 9.79e-01 | 0.1371 |
| 26118 | WSB1 | P38T-E | Human | Esophagus | ESCC | 6.63e-05 | 1.13e+00 | 0.127 |
| 26118 | WSB1 | P39T-E | Human | Esophagus | ESCC | 1.18e-25 | 8.41e-01 | 0.0894 |
| 26118 | WSB1 | P40T-E | Human | Esophagus | ESCC | 8.04e-04 | 6.28e-01 | 0.109 |
| 26118 | WSB1 | P42T-E | Human | Esophagus | ESCC | 4.49e-36 | 1.62e+00 | 0.1175 |
| 26118 | WSB1 | P44T-E | Human | Esophagus | ESCC | 6.89e-18 | 8.99e-01 | 0.1096 |
| 26118 | WSB1 | P47T-E | Human | Esophagus | ESCC | 3.60e-27 | 1.01e+00 | 0.1067 |
| 26118 | WSB1 | P48T-E | Human | Esophagus | ESCC | 3.03e-36 | 1.20e+00 | 0.0959 |
| 26118 | WSB1 | P49T-E | Human | Esophagus | ESCC | 1.55e-14 | 2.97e+00 | 0.1768 |
| 26118 | WSB1 | P52T-E | Human | Esophagus | ESCC | 6.49e-35 | 1.11e+00 | 0.1555 |
| 26118 | WSB1 | P54T-E | Human | Esophagus | ESCC | 4.67e-76 | 2.71e+00 | 0.0975 |
| 26118 | WSB1 | P56T-E | Human | Esophagus | ESCC | 2.10e-14 | 1.90e+00 | 0.1613 |
| 26118 | WSB1 | P57T-E | Human | Esophagus | ESCC | 9.94e-38 | 1.21e+00 | 0.0926 |
| 26118 | WSB1 | P61T-E | Human | Esophagus | ESCC | 2.28e-59 | 2.16e+00 | 0.099 |
| 26118 | WSB1 | P62T-E | Human | Esophagus | ESCC | 3.08e-61 | 1.68e+00 | 0.1302 |
| 26118 | WSB1 | P65T-E | Human | Esophagus | ESCC | 8.18e-57 | 1.82e+00 | 0.0978 |
| 26118 | WSB1 | P74T-E | Human | Esophagus | ESCC | 1.91e-21 | 1.18e+00 | 0.1479 |
| 26118 | WSB1 | P75T-E | Human | Esophagus | ESCC | 2.13e-56 | 1.55e+00 | 0.1125 |
| 26118 | WSB1 | P76T-E | Human | Esophagus | ESCC | 1.31e-20 | 7.41e-01 | 0.1207 |
| Page: 1 2 3 4 5 6 7 8 9 10 11 12 13 |
| Tissue | Expression Dynamics | Abbreviation |
| Breast | 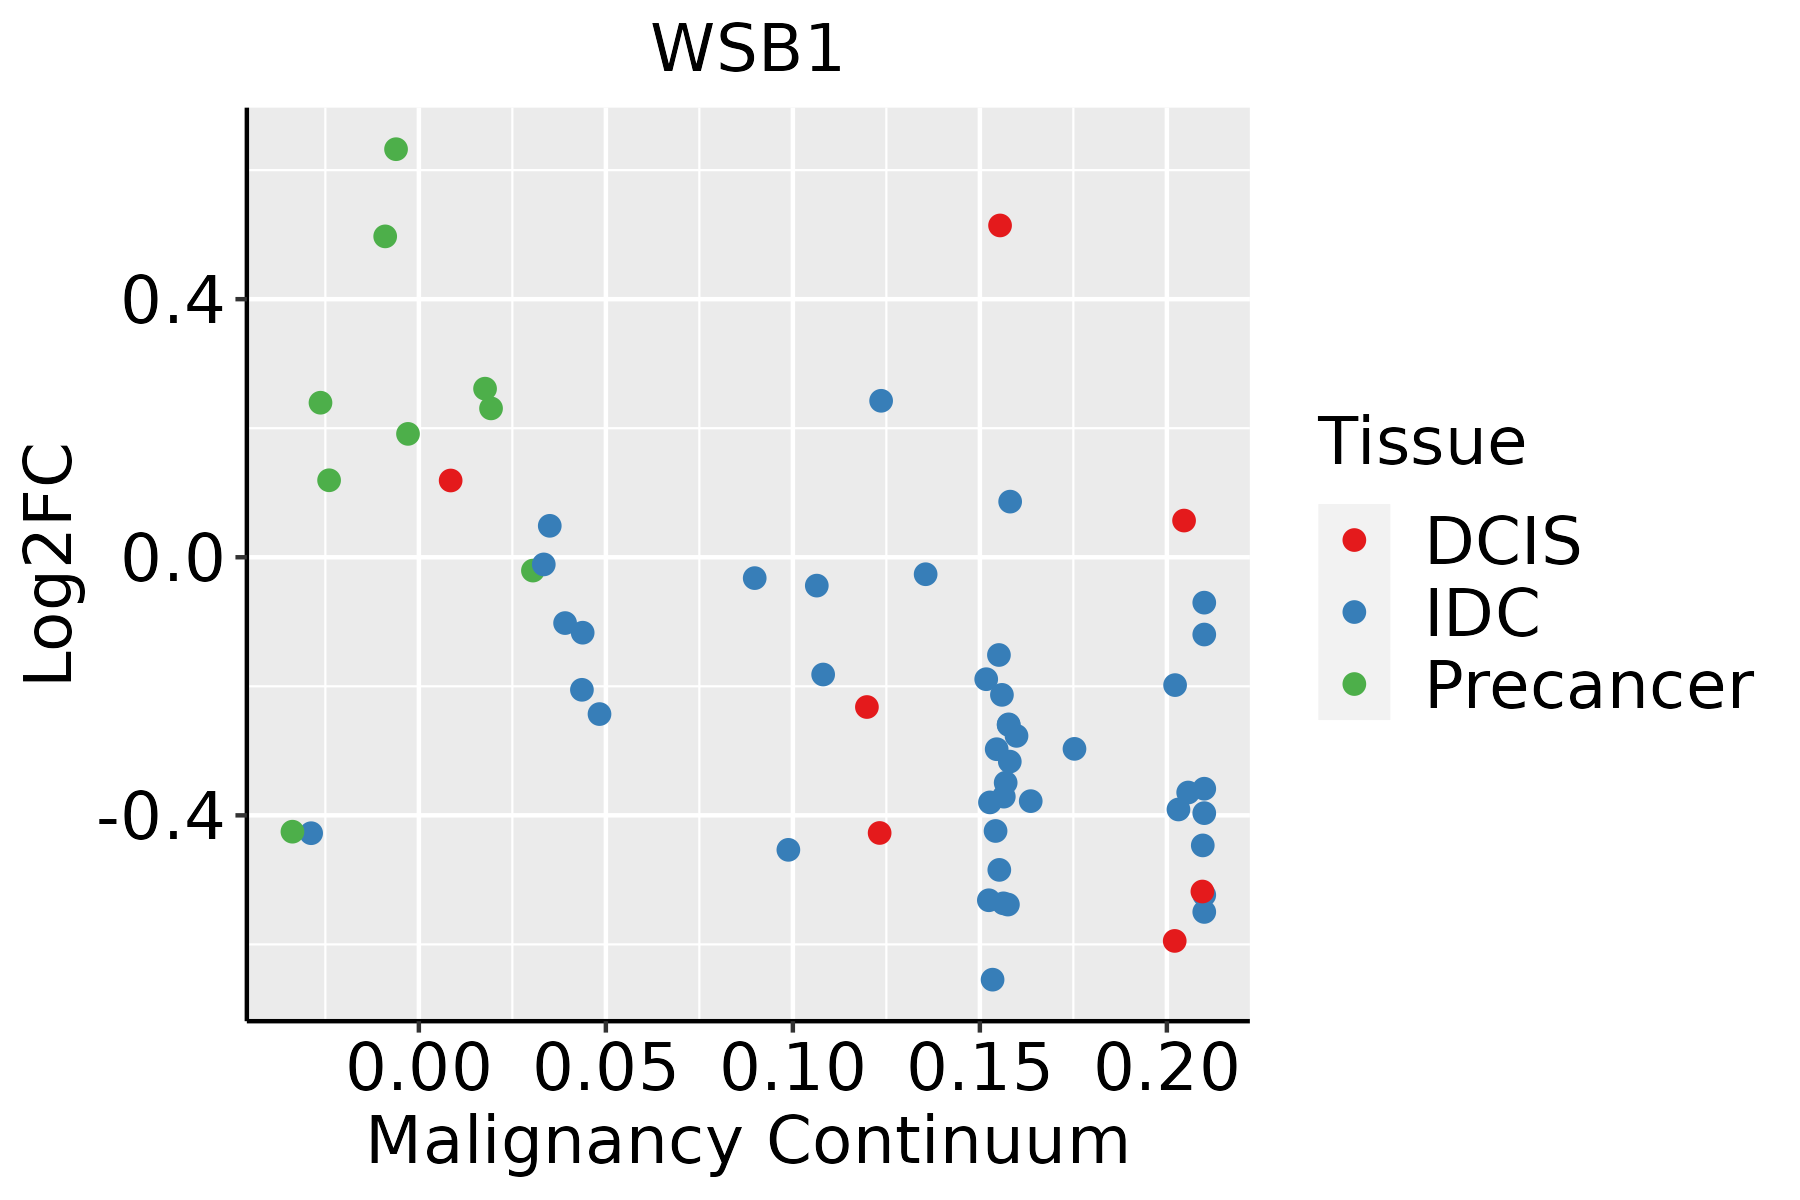 | IDC: Invasive ductal carcinoma |
| DCIS: Ductal carcinoma in situ | ||
| Precancer(BRCA1-mut): Precancerous lesion from BRCA1 mutation carriers | ||
| Colorectum (GSE201348) |  | FAP: Familial adenomatous polyposis |
| CRC: Colorectal cancer | ||
| Colorectum (HTA11) |  | AD: Adenomas |
| SER: Sessile serrated lesions | ||
| MSI-H: Microsatellite-high colorectal cancer | ||
| MSS: Microsatellite stable colorectal cancer | ||
| Endometrium | 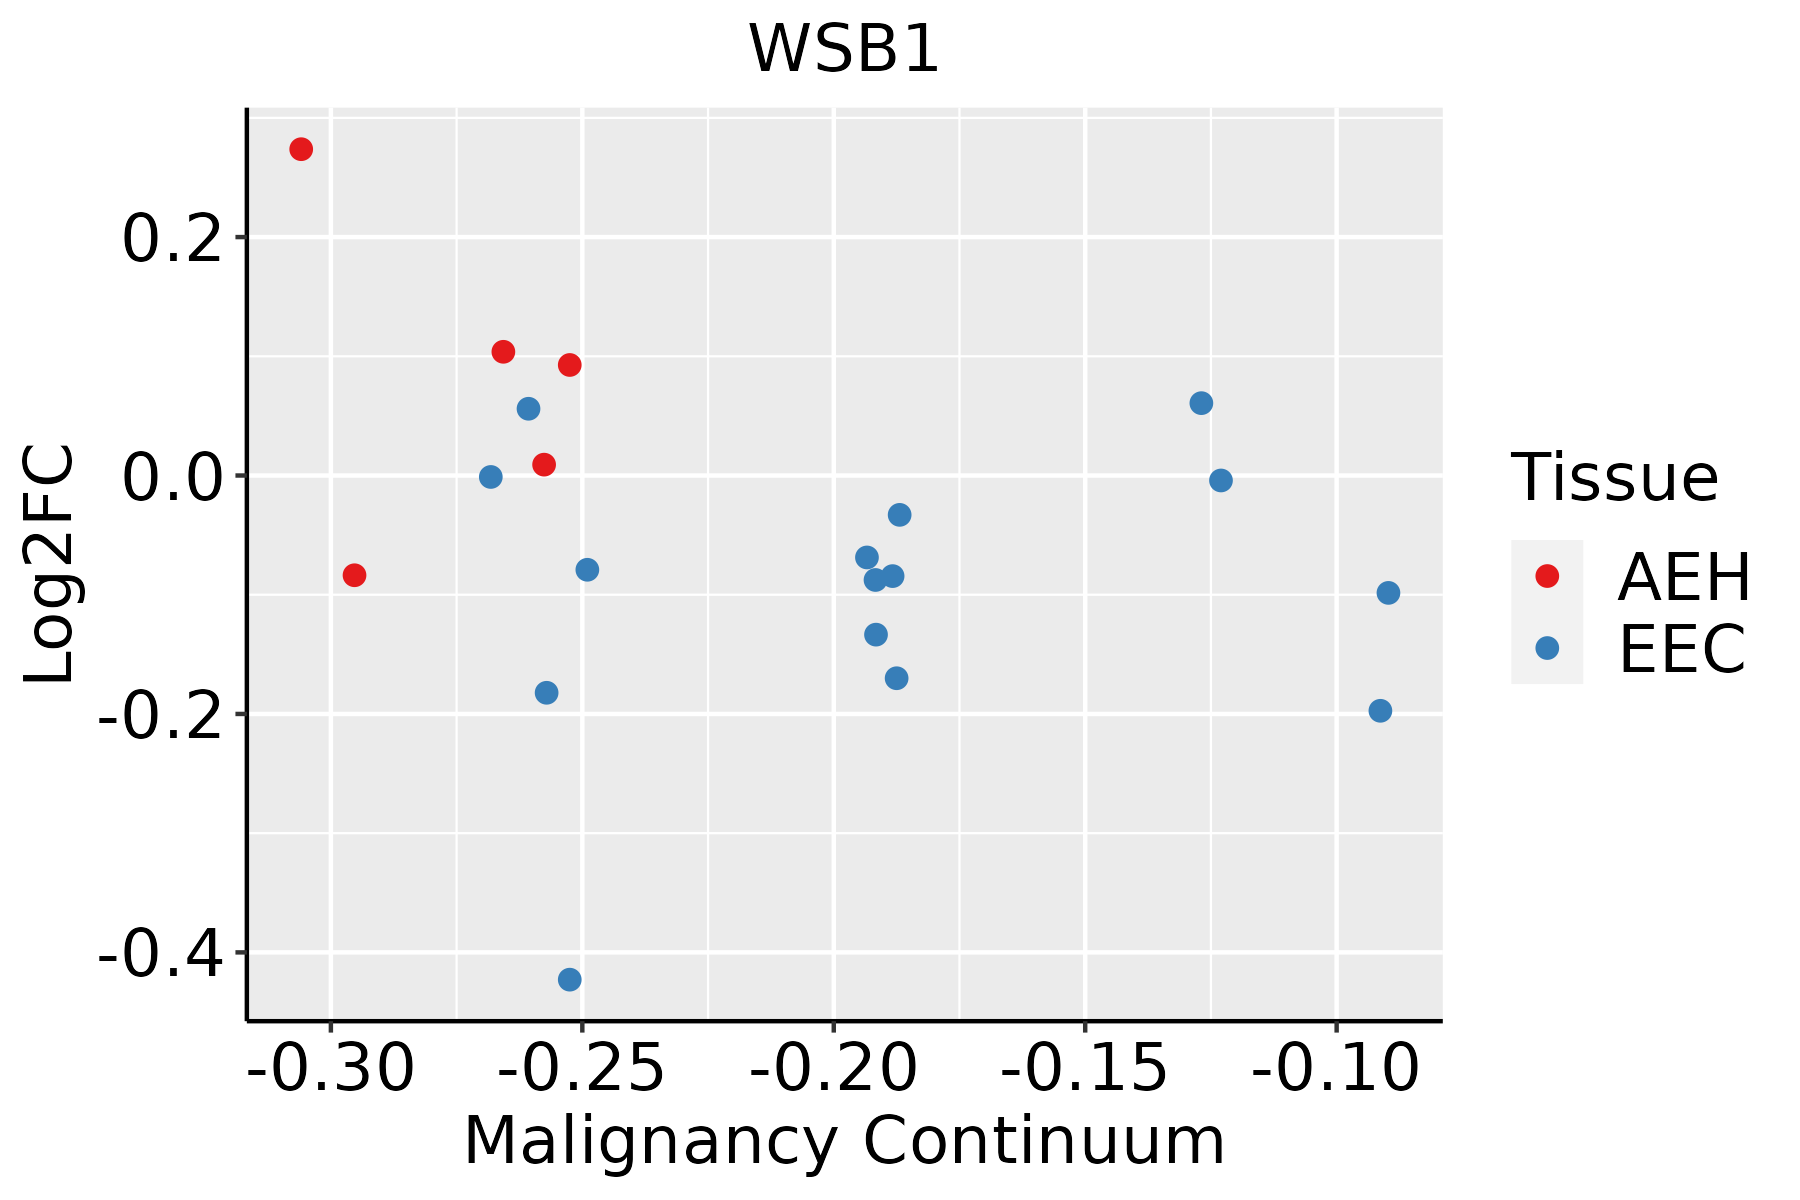 | AEH: Atypical endometrial hyperplasia |
| EEC: Endometrioid Cancer | ||
| Esophagus | 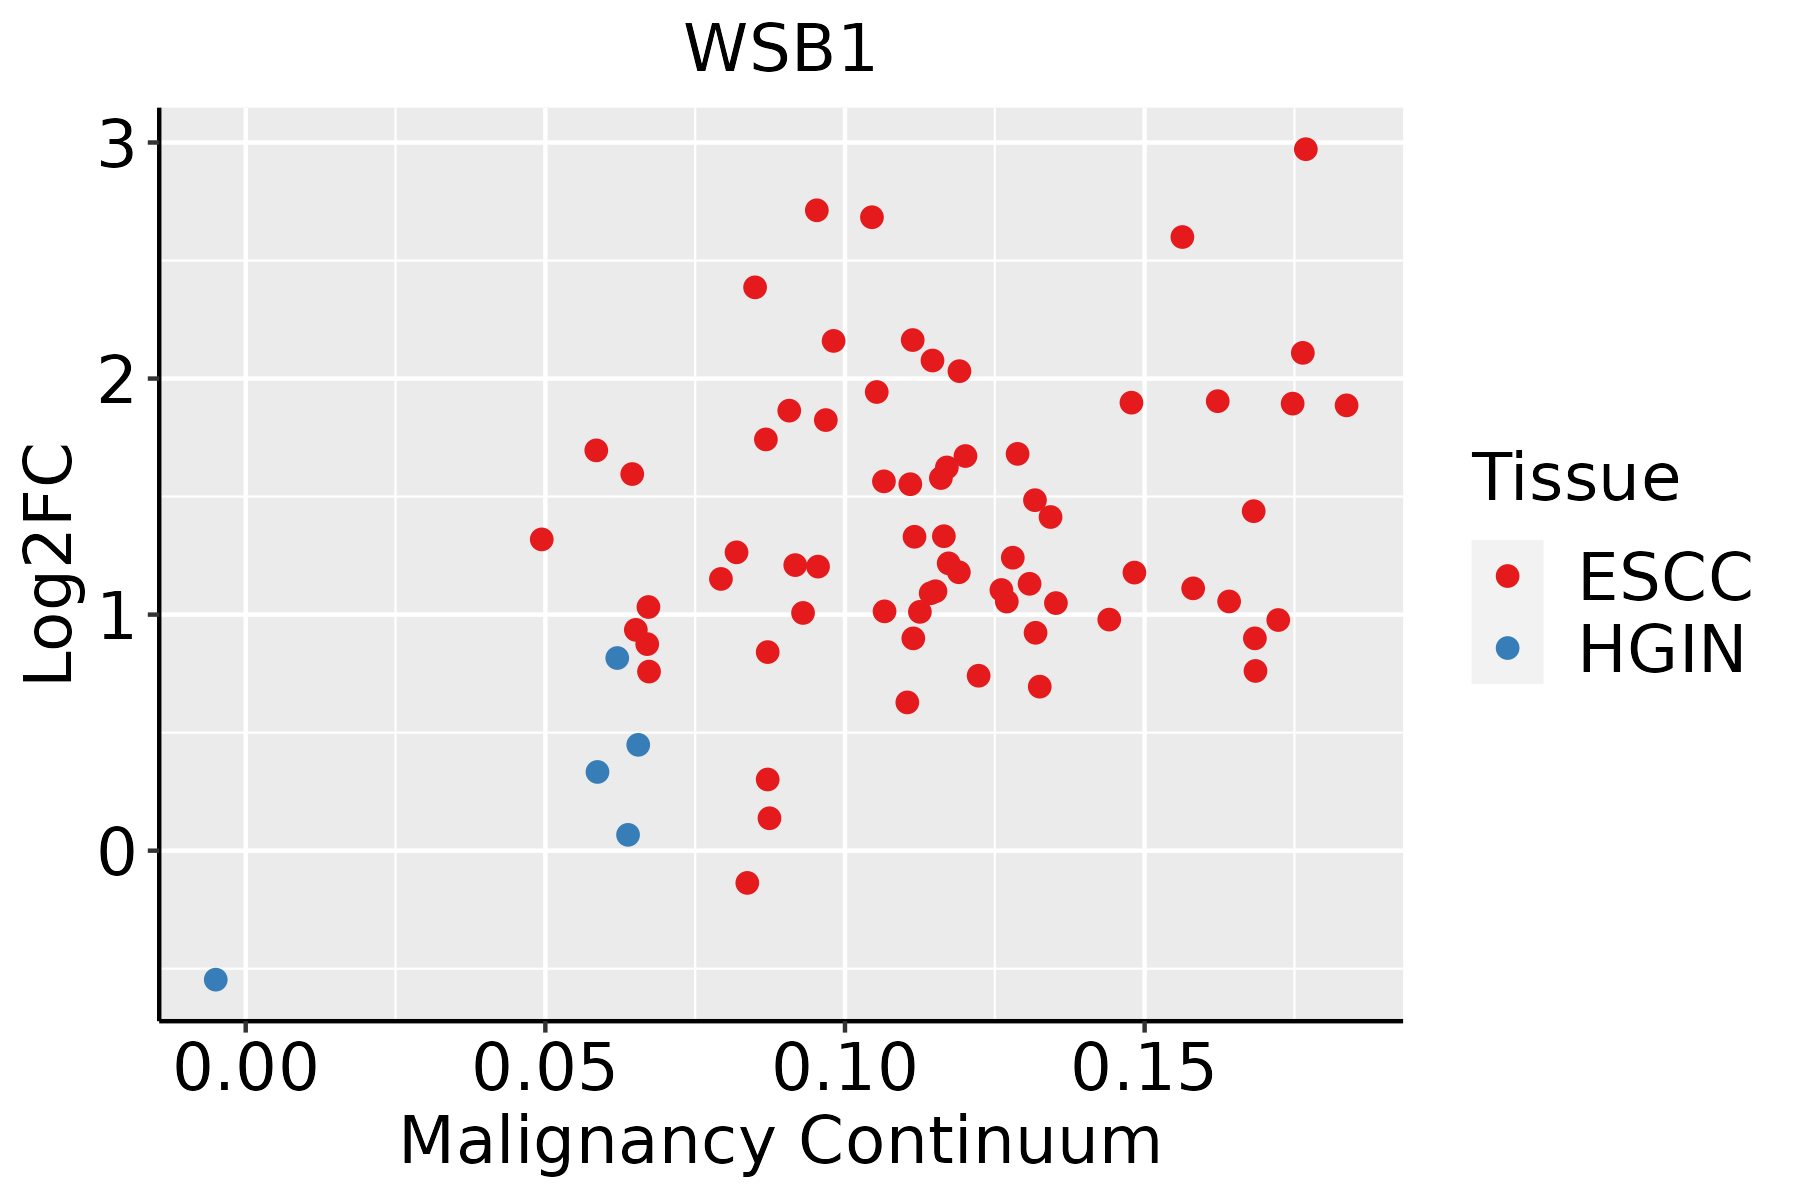 | ESCC: Esophageal squamous cell carcinoma |
| HGIN: High-grade intraepithelial neoplasias | ||
| LGIN: Low-grade intraepithelial neoplasias | ||
| Liver |  | HCC: Hepatocellular carcinoma |
| NAFLD: Non-alcoholic fatty liver disease | ||
| Lung | 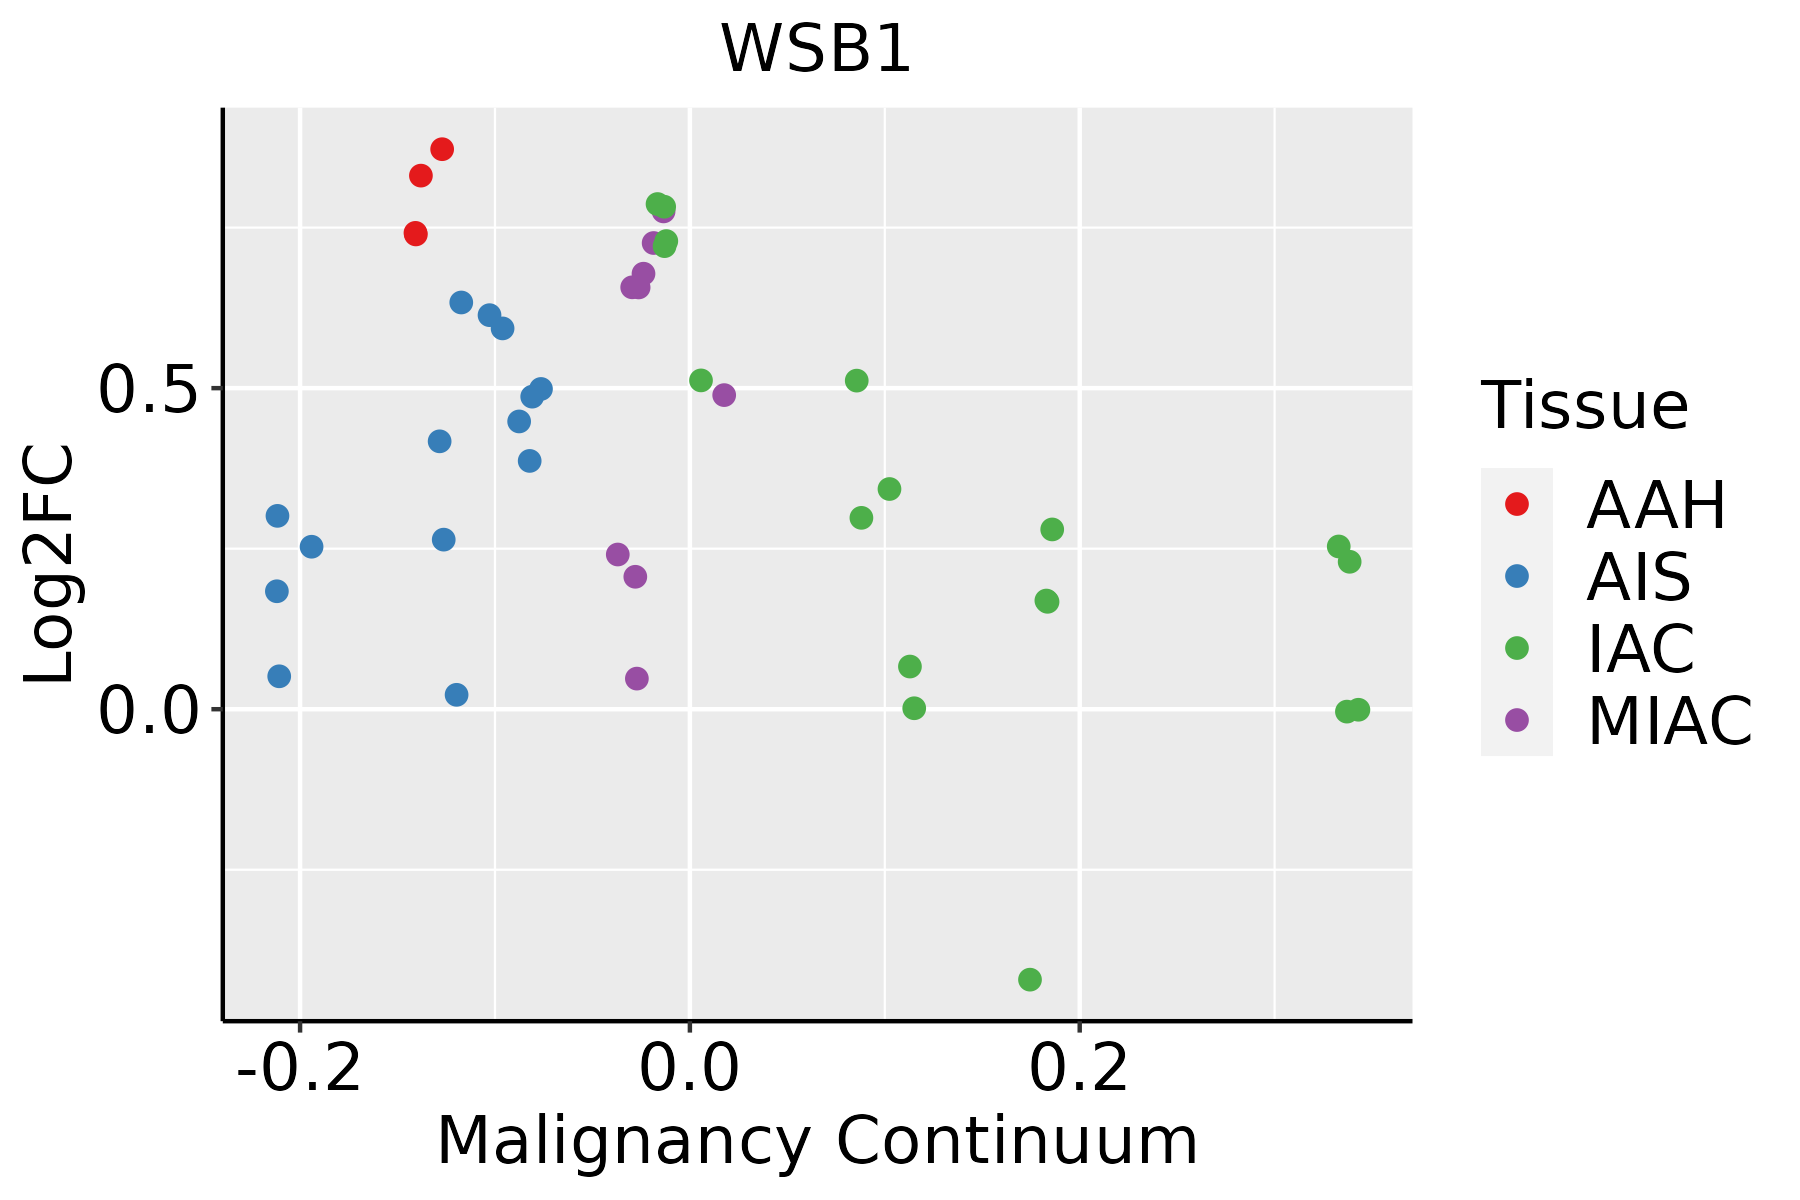 | AAH: Atypical adenomatous hyperplasia |
| AIS: Adenocarcinoma in situ | ||
| IAC: Invasive lung adenocarcinoma | ||
| MIA: Minimally invasive adenocarcinoma | ||
| Oral Cavity | 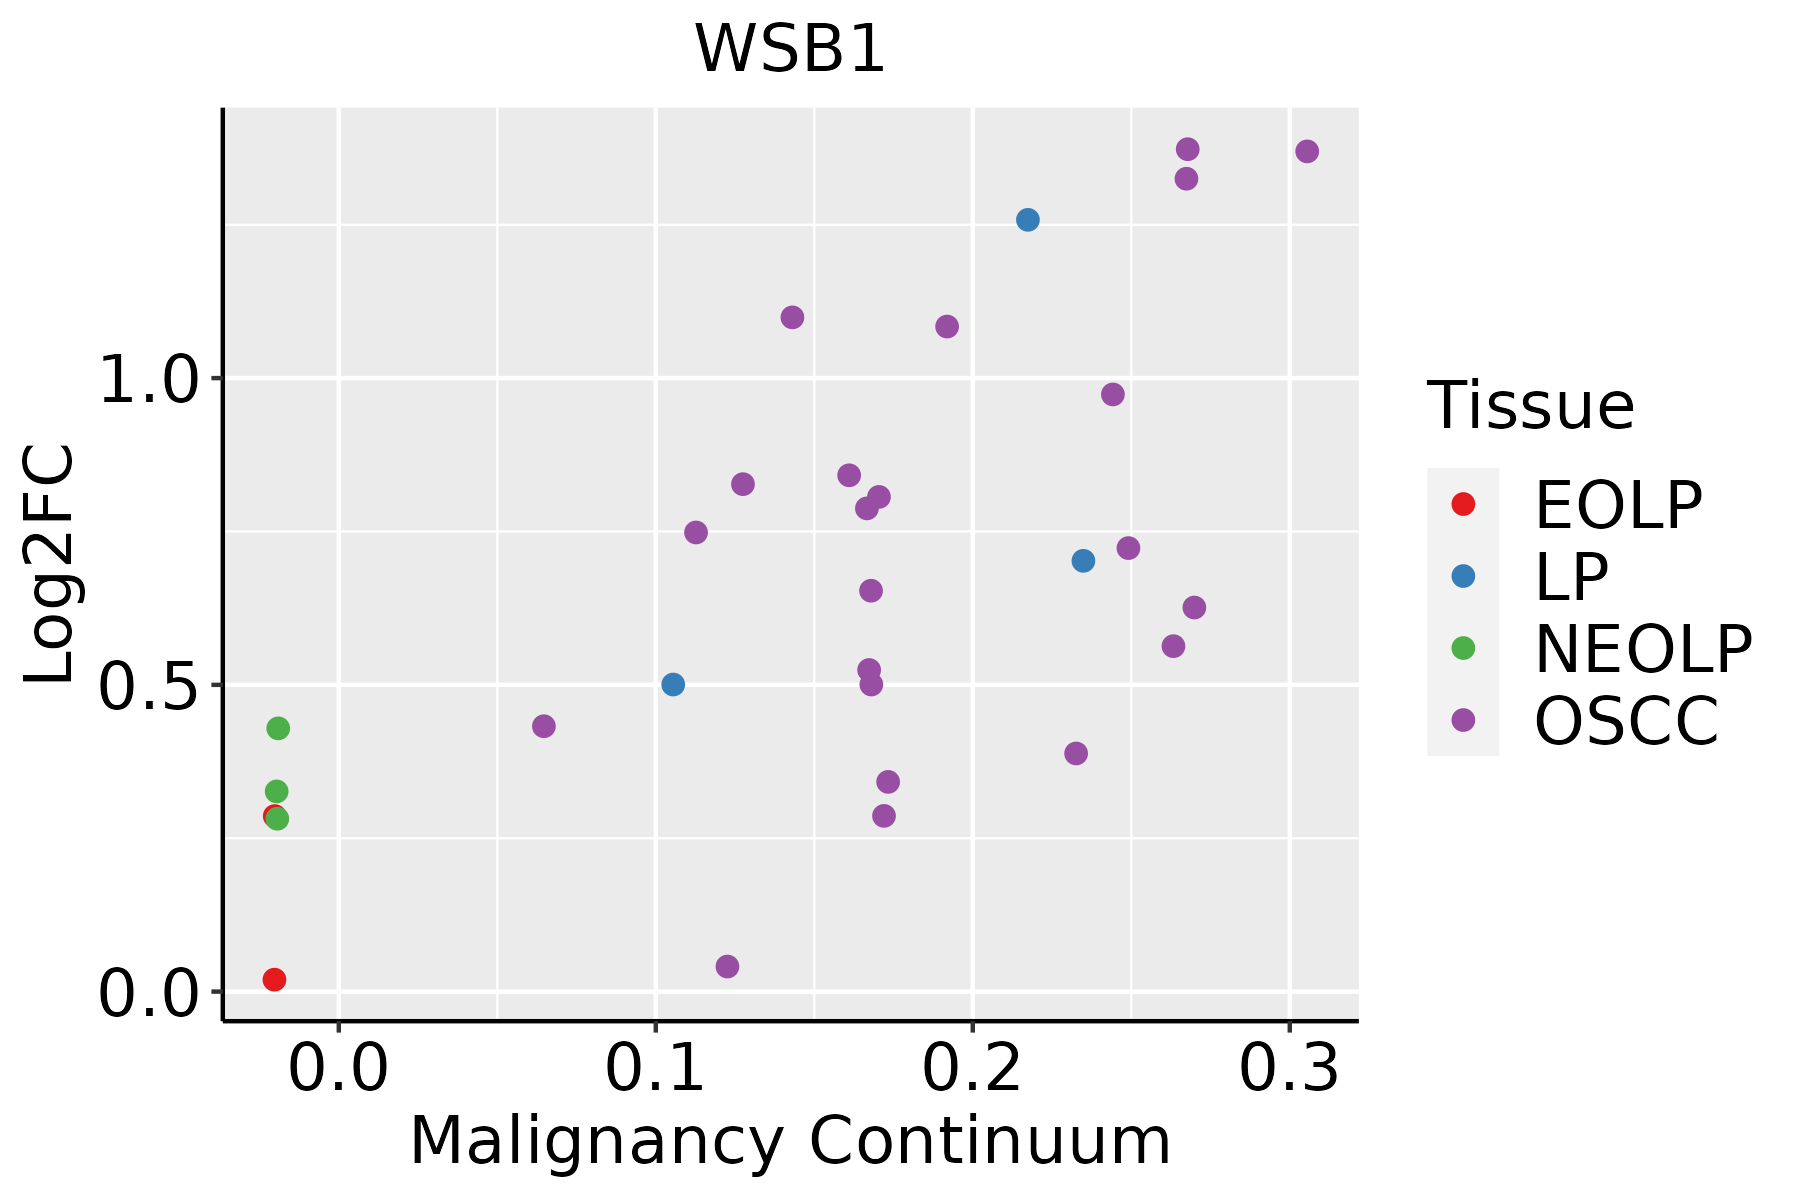 | EOLP: Erosive Oral lichen planus |
| LP: leukoplakia | ||
| NEOLP: Non-erosive oral lichen planus | ||
| OSCC: Oral squamous cell carcinoma | ||
| Prostate |  | BPH: Benign Prostatic Hyperplasia |
| Skin | 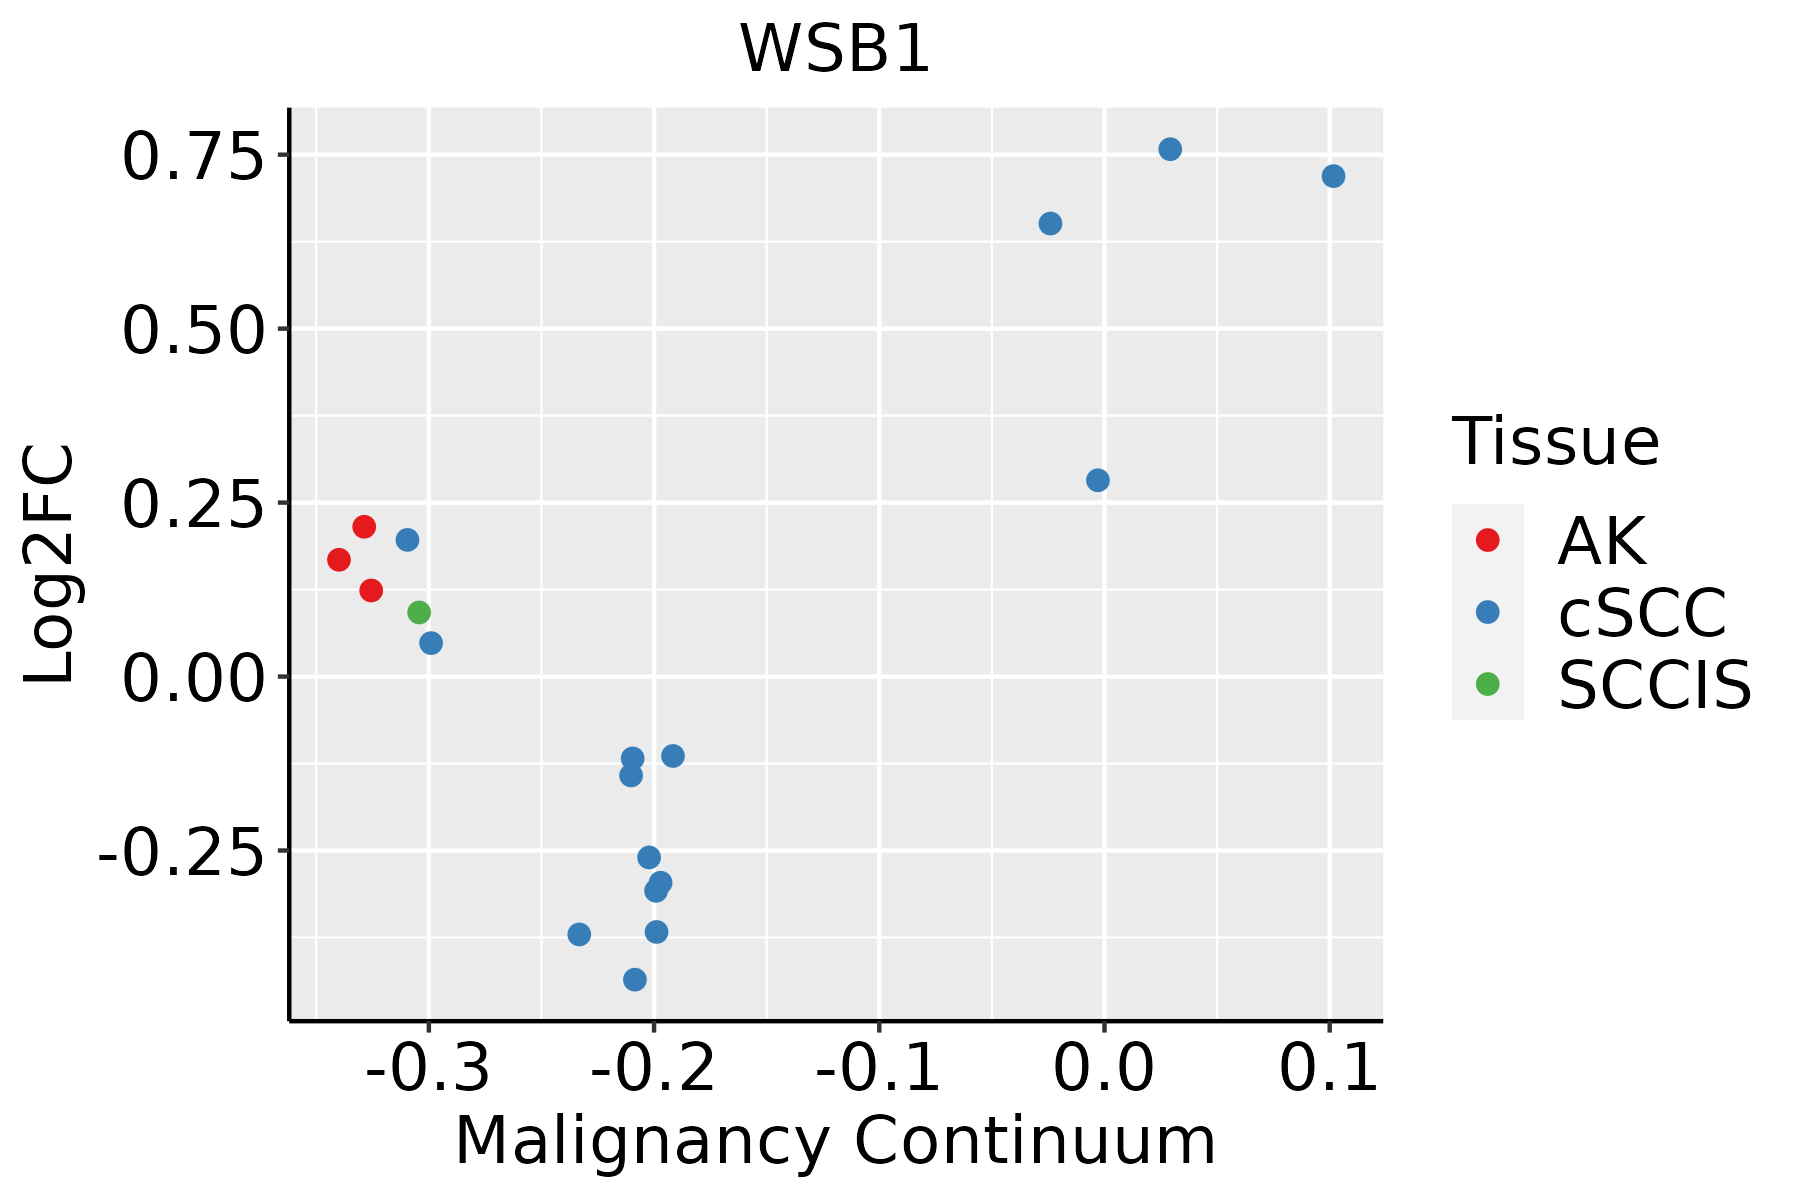 | AK: Actinic keratosis |
| cSCC: Cutaneous squamous cell carcinoma | ||
| SCCIS:squamous cell carcinoma in situ | ||
| Thyroid | 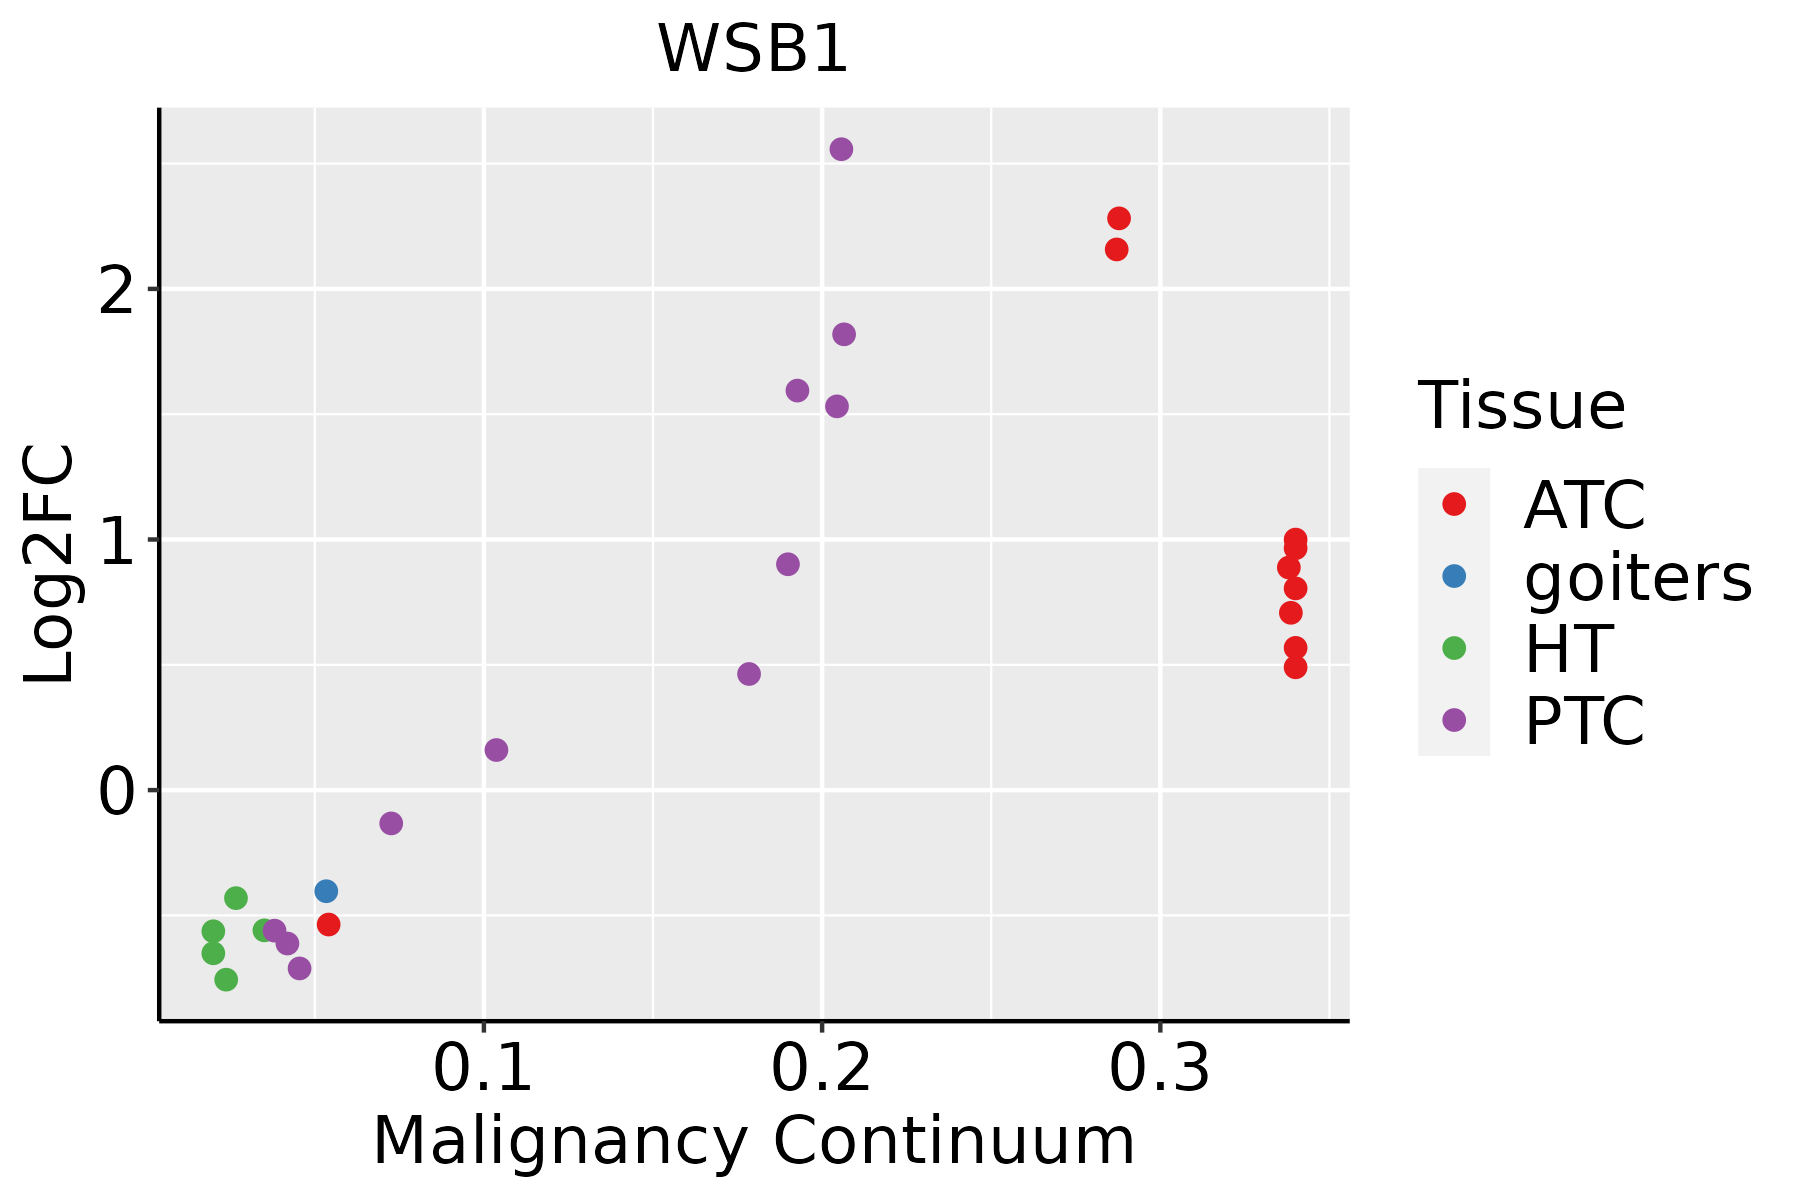 | ATC: Anaplastic thyroid cancer |
| HT: Hashimoto's thyroiditis | ||
| PTC: Papillary thyroid cancer |
| ∗log2FC in expression of this searched gene in stem-like cells from each diseased tissue sample relative to stem-like cells in normal samples in each tissue plotted against the malignancy continuum. Samples are colored based on if they are from different disease stage. |
Top |
Malignant transformation related pathway analysis |
| Find out the enriched GO biological processes and KEGG pathways involved in transition from healthy to precancer to cancer |
| Tissue | Disease Stage | Enriched GO biological Processes |
| Colorectum | AD |  |
| Colorectum | SER |  |
| Colorectum | MSS |  |
| Colorectum | MSI-H |  |
| Colorectum | FAP |  |
| ∗Top 15 enriched GO BP terms are showed in the bar plot of each disease state in each tissue. Each row represents a significant GO biological process which is colored according to the -log10(p.adjust). |
| Page: 1 2 3 4 5 6 7 8 9 |
| GO ID | Tissue | Disease Stage | Description | Gene Ratio | Bg Ratio | pvalue | p.adjust | Count |
| Page: 1 |
| Pathway ID | Tissue | Disease Stage | Description | Gene Ratio | Bg Ratio | pvalue | p.adjust | qvalue | Count |
| Page: 1 |
Top |
Cell-cell communication analysis |
| Identification of potential cell-cell interactions between two cell types and their ligand-receptor pairs for different disease states |
| Ligand | Receptor | LRpair | Pathway | Tissue | Disease Stage |
| Page: 1 |
Top |
Single-cell gene regulatory network inference analysis |
| Find out the significant the regulons (TFs) and the target genes of each regulon across cell types for different disease states |
| TF | Cell Type | Tissue | Disease Stage | Target Gene | RSS | Regulon Activity |
| ∗The dot plots of a searched regulon are shown for all cell subpopulations in each disease state of each tissue based on the regulon specific score inferred using pySCENIC and by calculating the average expression. |
| Page: 1 |
Top |
Somatic mutation of malignant transformation related genes |
| Annotation of somatic variants for genes involved in malignant transformation |
| Hugo Symbol | Variant Class | Variant Classification | dbSNP RS | HGVSc | HGVSp | HGVSp Short | SWISSPROT | BIOTYPE | SIFT | PolyPhen | Tumor Sample Barcode | Tissue | Histology | Sex | Age | Stage | Therapy Types | Drugs | Outcome |
| WSB1 | SNV | Missense_Mutation | novel | c.883G>T | p.Gly295Trp | p.G295W | Q9Y6I7 | protein_coding | tolerated(0.1) | probably_damaging(0.998) | TCGA-A2-A25E-01 | Breast | breast invasive carcinoma | Female | <65 | III/IV | Chemotherapy | cytoxan | PD |
| WSB1 | SNV | Missense_Mutation | novel | c.361N>C | p.Glu121Gln | p.E121Q | Q9Y6I7 | protein_coding | tolerated(0.18) | benign(0.229) | TCGA-A2-A3Y0-01 | Breast | breast invasive carcinoma | Female | <65 | I/II | Chemotherapy | adriamycin | CR |
| WSB1 | SNV | Missense_Mutation | c.953N>A | p.Ser318Tyr | p.S318Y | Q9Y6I7 | protein_coding | tolerated(0.13) | possibly_damaging(0.876) | TCGA-EW-A1OZ-01 | Breast | breast invasive carcinoma | Female | <65 | I/II | Targeted Molecular therapy | trastuzumab | SD | |
| WSB1 | SNV | Missense_Mutation | novel | c.1021G>A | p.Asp341Asn | p.D341N | Q9Y6I7 | protein_coding | tolerated(0.07) | benign(0.005) | TCGA-EW-A6SB-01 | Breast | breast invasive carcinoma | Female | <65 | I/II | Unknown | Unknown | SD |
| WSB1 | SNV | Missense_Mutation | c.572G>C | p.Arg191Thr | p.R191T | Q9Y6I7 | protein_coding | deleterious(0.05) | benign(0.114) | TCGA-IR-A3LK-01 | Cervix | cervical & endocervical cancer | Female | >=65 | I/II | Chemotherapy | cisplatin | PD | |
| WSB1 | SNV | Missense_Mutation | rs780700572 | c.1103C>T | p.Ala368Val | p.A368V | Q9Y6I7 | protein_coding | tolerated(0.1) | benign(0.228) | TCGA-AA-A010-01 | Colorectum | colon adenocarcinoma | Female | <65 | I/II | Chemotherapy | folinic | CR |
| WSB1 | SNV | Missense_Mutation | c.257N>C | p.Leu86Ser | p.L86S | Q9Y6I7 | protein_coding | tolerated(0.82) | possibly_damaging(0.69) | TCGA-AZ-4615-01 | Colorectum | colon adenocarcinoma | Male | >=65 | III/IV | Chemotherapy | xeloda | PD | |
| WSB1 | SNV | Missense_Mutation | c.341N>T | p.Ala114Val | p.A114V | Q9Y6I7 | protein_coding | deleterious(0) | possibly_damaging(0.575) | TCGA-A5-A0G2-01 | Endometrium | uterine corpus endometrioid carcinoma | Female | <65 | III/IV | Unknown | Unknown | SD | |
| WSB1 | SNV | Missense_Mutation | novel | c.595N>A | p.Asp199Asn | p.D199N | Q9Y6I7 | protein_coding | deleterious(0.01) | possibly_damaging(0.492) | TCGA-A5-A0G2-01 | Endometrium | uterine corpus endometrioid carcinoma | Female | <65 | III/IV | Unknown | Unknown | SD |
| WSB1 | SNV | Missense_Mutation | rs773398485 | c.103N>T | p.Arg35Cys | p.R35C | Q9Y6I7 | protein_coding | tolerated(0.18) | benign(0) | TCGA-A5-A0VP-01 | Endometrium | uterine corpus endometrioid carcinoma | Female | >=65 | I/II | Unknown | Unknown | SD |
| Page: 1 2 3 4 5 |
Top |
Related drugs of malignant transformation related genes |
| Identification of chemicals and drugs interact with genes involved in malignant transfromation |
| (DGIdb 4.0) |
| Entrez ID | Symbol | Category | Interaction Types | Drug Claim Name | Drug Name | PMIDs |
| Page: 1 |

Copyright 2023-Present -The University of Texas Health Science Center at Houston |