
|
|||||
|
 | |
| |
| |
| |
| |
| |
|
Gene: WIPI2 |
Gene summary for WIPI2 |
| Gene information | Species | Human | Gene symbol | WIPI2 | Gene ID | 26100 |
| Gene name | WD repeat domain, phosphoinositide interacting 2 | |
| Gene Alias | ATG18B | |
| Cytomap | 7p22.1 | |
| Gene Type | protein-coding | GO ID | GO:0000045 | UniProtAcc | Q9Y4P8 |
Top |
Malignant transformation analysis |
| Identification of the aberrant gene expression in precancerous and cancerous lesions by comparing the gene expression of stem-like cells in diseased tissues with normal stem cells |
| Entrez ID | Symbol | Replicates | Species | Organ | Tissue | Adj P-value | Log2FC | Malignancy |
| 26100 | WIPI2 | C38 | Human | Oral cavity | OSCC | 3.03e-18 | 1.46e+00 | 0.172 |
| 26100 | WIPI2 | C43 | Human | Oral cavity | OSCC | 2.45e-26 | 6.43e-01 | 0.1704 |
| 26100 | WIPI2 | C46 | Human | Oral cavity | OSCC | 1.60e-30 | 7.58e-01 | 0.1673 |
| 26100 | WIPI2 | C51 | Human | Oral cavity | OSCC | 3.90e-15 | 7.53e-01 | 0.2674 |
| 26100 | WIPI2 | C57 | Human | Oral cavity | OSCC | 2.03e-20 | 7.50e-01 | 0.1679 |
| 26100 | WIPI2 | C06 | Human | Oral cavity | OSCC | 1.52e-09 | 1.33e+00 | 0.2699 |
| 26100 | WIPI2 | C07 | Human | Oral cavity | OSCC | 3.76e-02 | 7.50e-01 | 0.2491 |
| 26100 | WIPI2 | C08 | Human | Oral cavity | OSCC | 8.07e-50 | 9.86e-01 | 0.1919 |
| 26100 | WIPI2 | C09 | Human | Oral cavity | OSCC | 1.05e-06 | 3.89e-01 | 0.1431 |
| 26100 | WIPI2 | LN38 | Human | Oral cavity | OSCC | 4.39e-03 | 9.04e-01 | 0.168 |
| 26100 | WIPI2 | LN46 | Human | Oral cavity | OSCC | 1.90e-13 | 7.03e-01 | 0.1666 |
| 26100 | WIPI2 | LP15 | Human | Oral cavity | LP | 7.62e-08 | 1.32e+00 | 0.2174 |
| 26100 | WIPI2 | LP17 | Human | Oral cavity | LP | 4.21e-03 | 5.93e-01 | 0.2349 |
| 26100 | WIPI2 | SYSMH1 | Human | Oral cavity | OSCC | 6.11e-17 | 4.96e-01 | 0.1127 |
| 26100 | WIPI2 | SYSMH2 | Human | Oral cavity | OSCC | 4.18e-20 | 7.35e-01 | 0.2326 |
| 26100 | WIPI2 | SYSMH3 | Human | Oral cavity | OSCC | 1.58e-25 | 7.42e-01 | 0.2442 |
| 26100 | WIPI2 | SYSMH4 | Human | Oral cavity | OSCC | 5.78e-10 | 1.48e-01 | 0.1226 |
| 26100 | WIPI2 | SYSMH5 | Human | Oral cavity | OSCC | 3.60e-09 | 3.22e-01 | 0.0647 |
| 26100 | WIPI2 | SYSMH6 | Human | Oral cavity | OSCC | 1.21e-11 | 4.42e-01 | 0.1275 |
| 26100 | WIPI2 | P4_S8_cSCC | Human | Skin | cSCC | 5.22e-06 | 1.06e-01 | -0.3095 |
| Page: 1 2 3 4 5 6 7 8 |
| Tissue | Expression Dynamics | Abbreviation |
| Colorectum (GSE201348) | 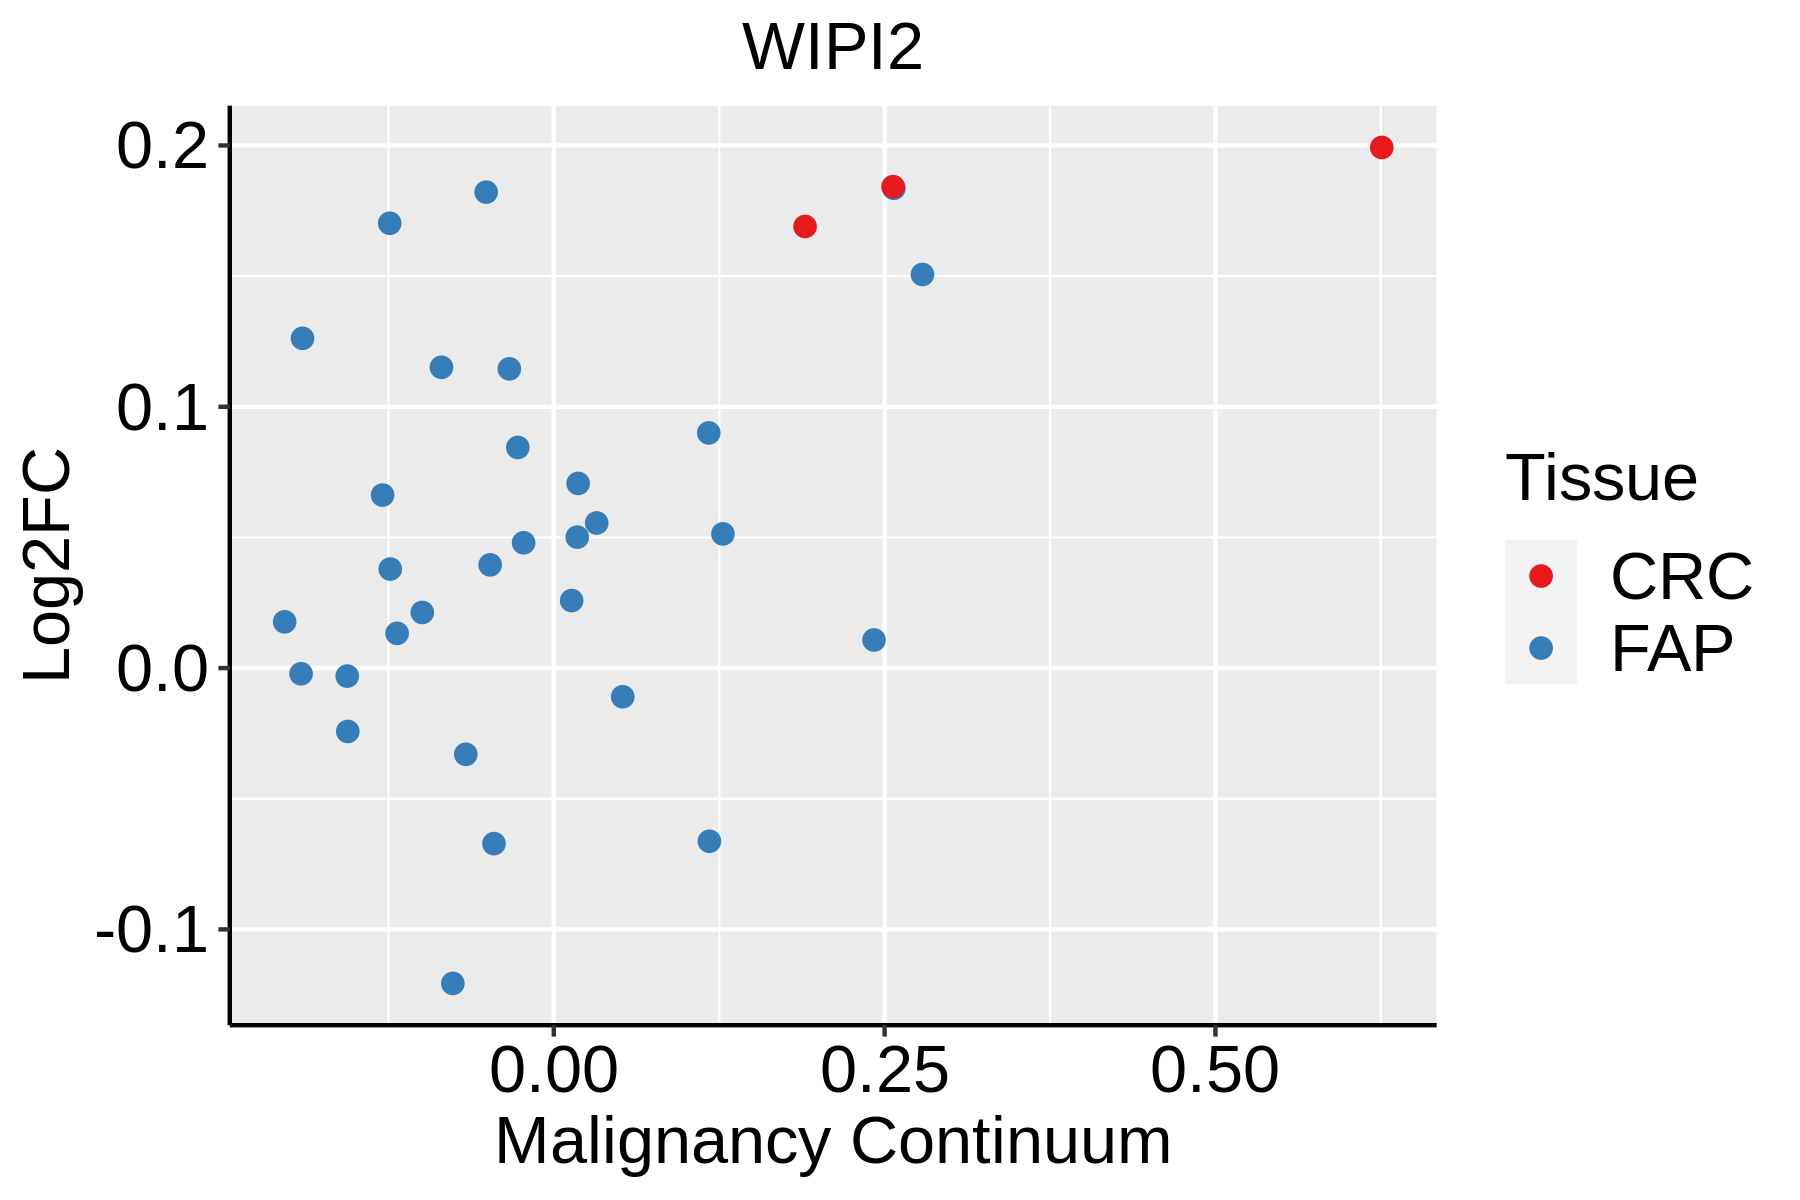 | FAP: Familial adenomatous polyposis |
| CRC: Colorectal cancer | ||
| Colorectum (HTA11) | 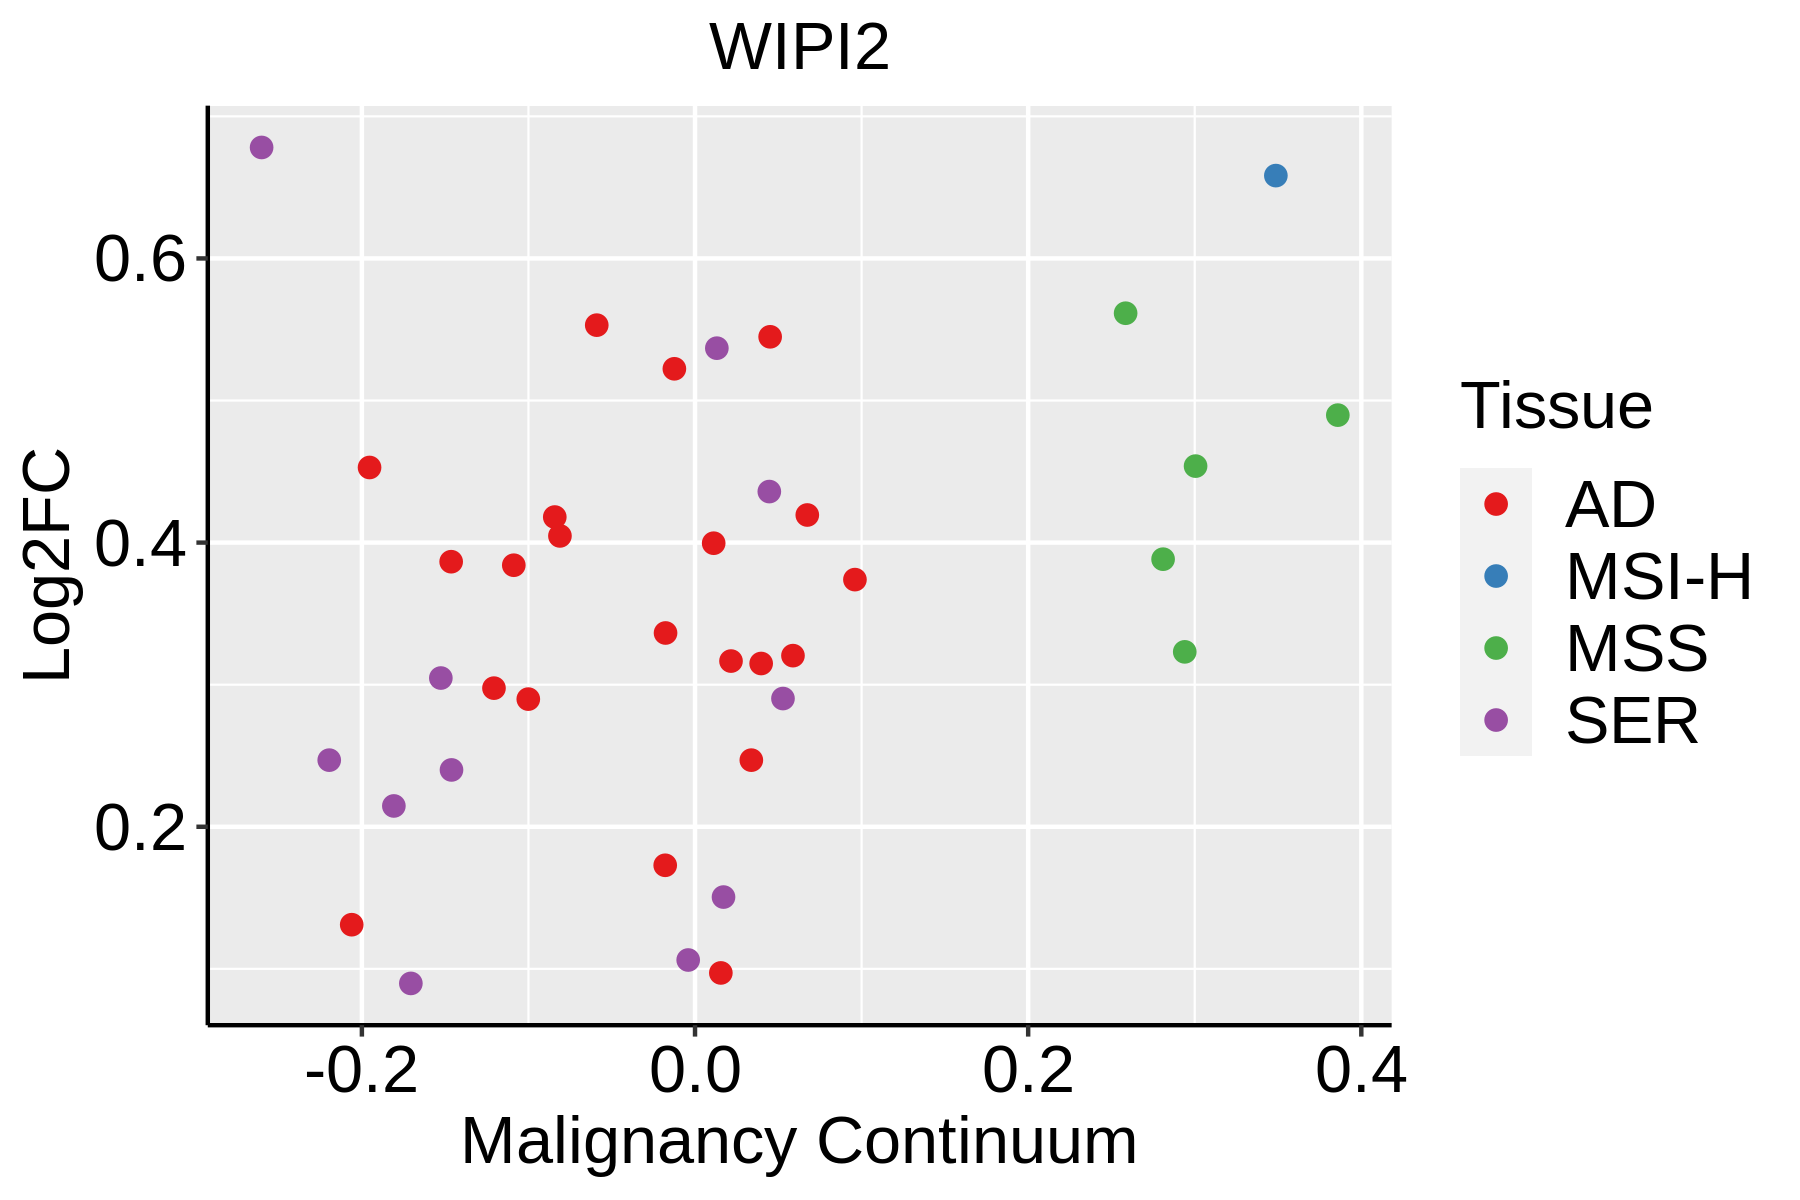 | AD: Adenomas |
| SER: Sessile serrated lesions | ||
| MSI-H: Microsatellite-high colorectal cancer | ||
| MSS: Microsatellite stable colorectal cancer | ||
| Esophagus | 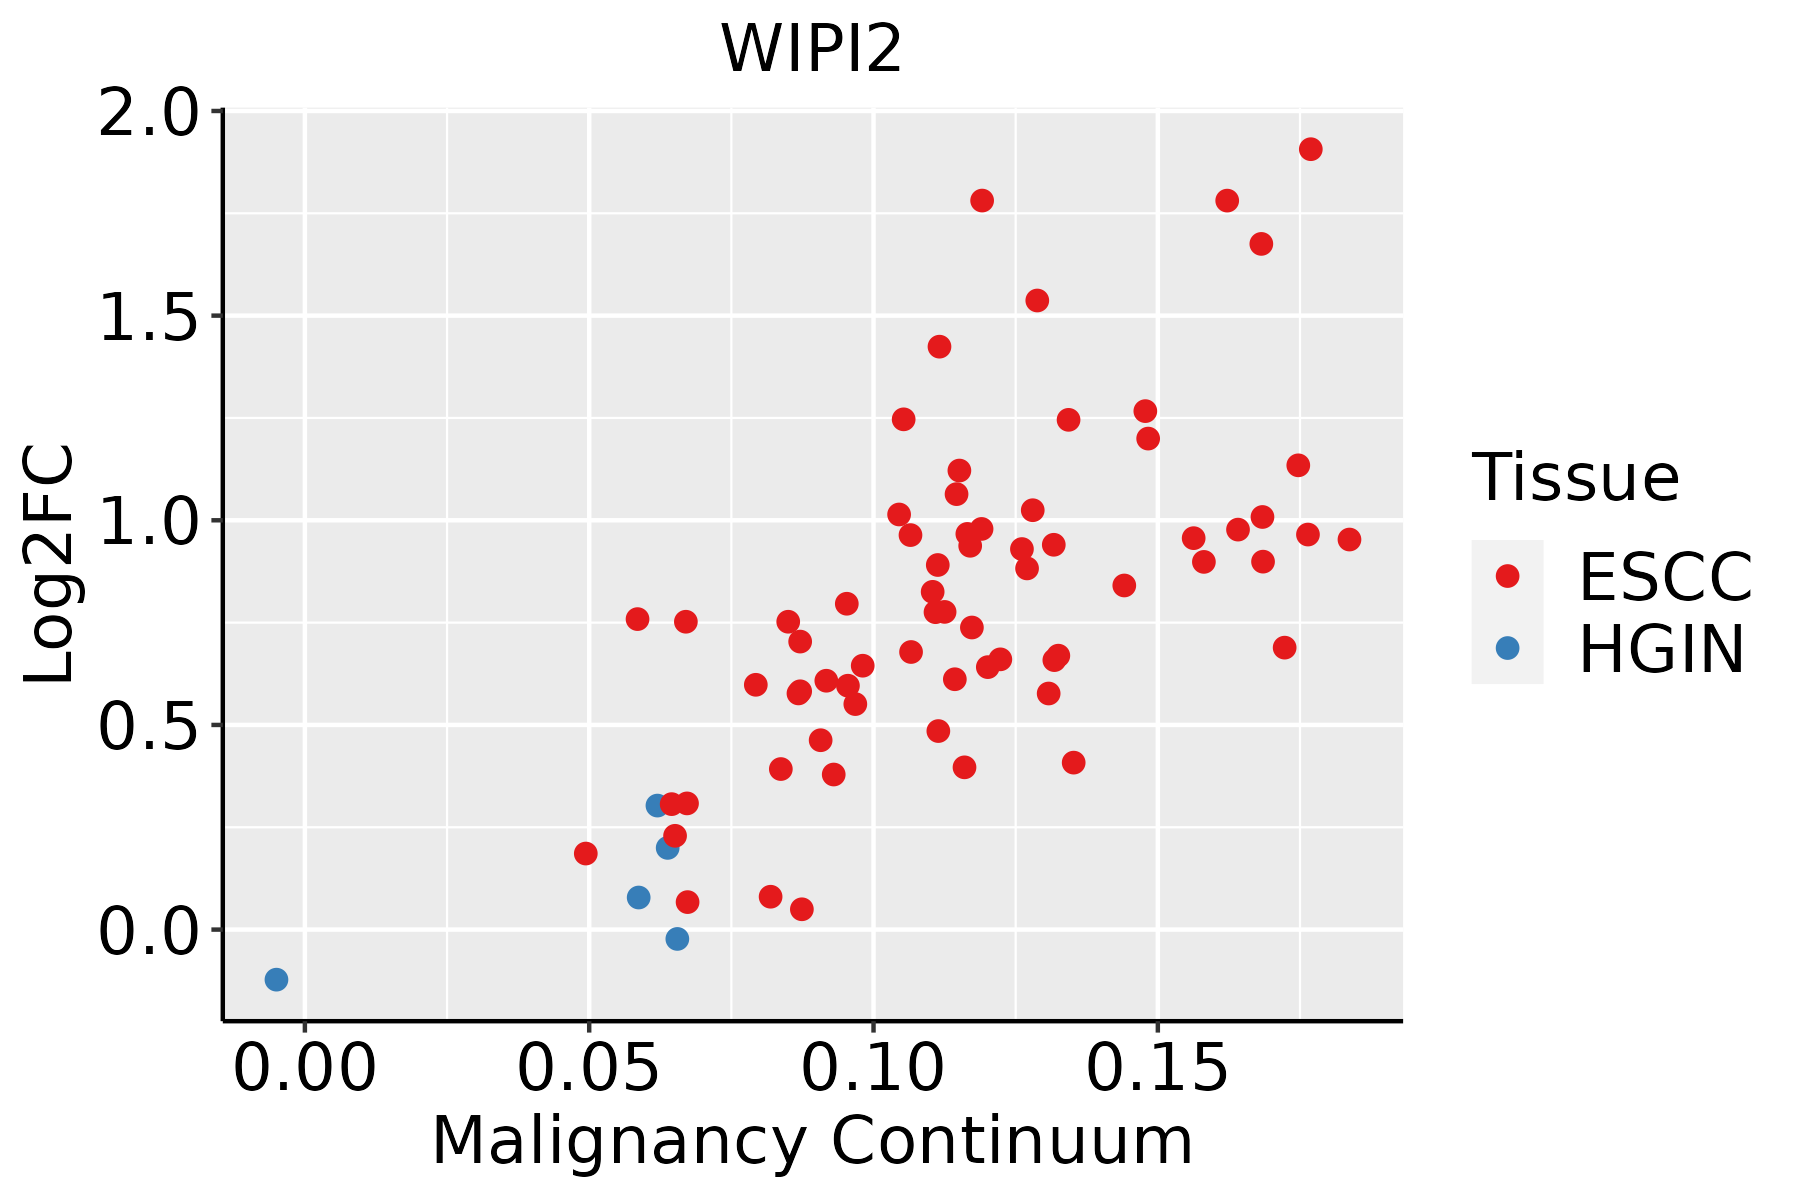 | ESCC: Esophageal squamous cell carcinoma |
| HGIN: High-grade intraepithelial neoplasias | ||
| LGIN: Low-grade intraepithelial neoplasias | ||
| Liver | 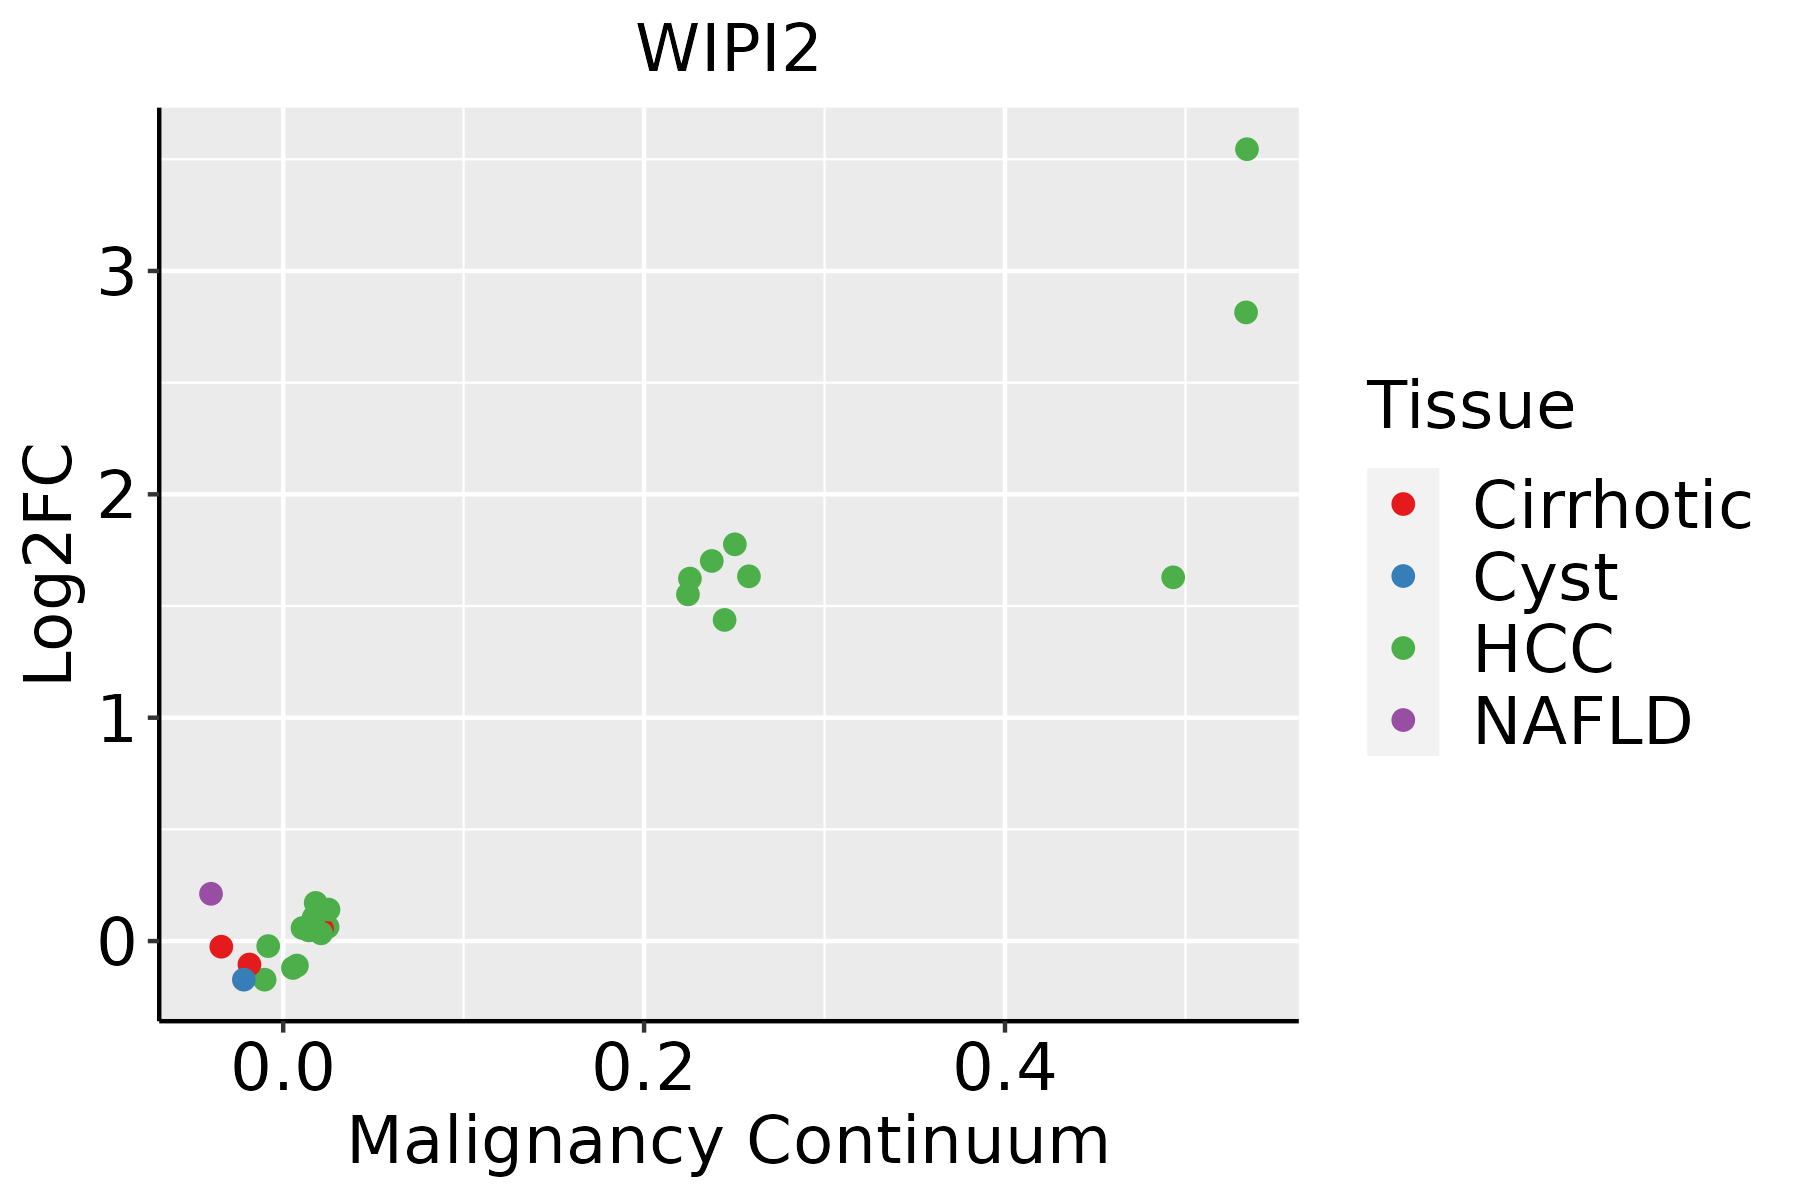 | HCC: Hepatocellular carcinoma |
| NAFLD: Non-alcoholic fatty liver disease | ||
| Oral Cavity | 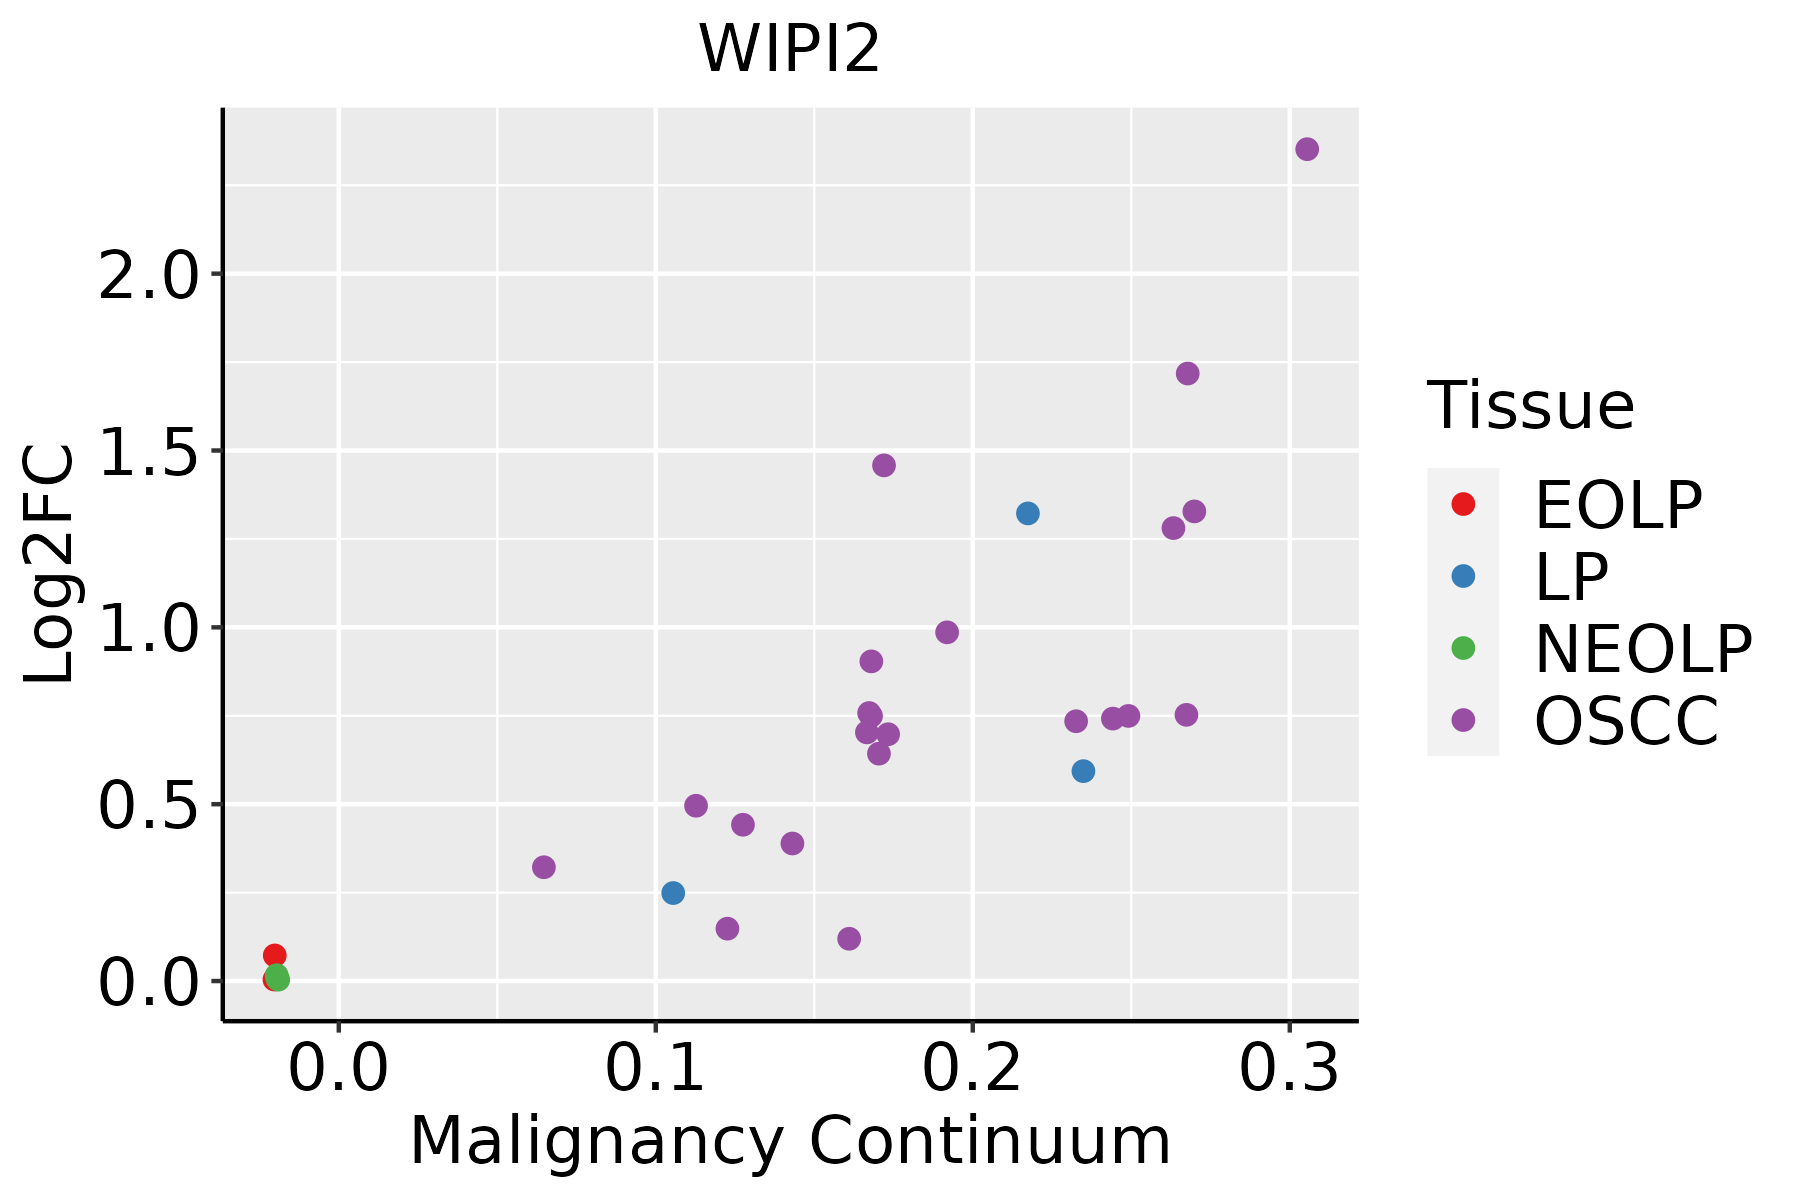 | EOLP: Erosive Oral lichen planus |
| LP: leukoplakia | ||
| NEOLP: Non-erosive oral lichen planus | ||
| OSCC: Oral squamous cell carcinoma | ||
| Prostate |  | BPH: Benign Prostatic Hyperplasia |
| Skin |  | AK: Actinic keratosis |
| cSCC: Cutaneous squamous cell carcinoma | ||
| SCCIS:squamous cell carcinoma in situ | ||
| Thyroid | 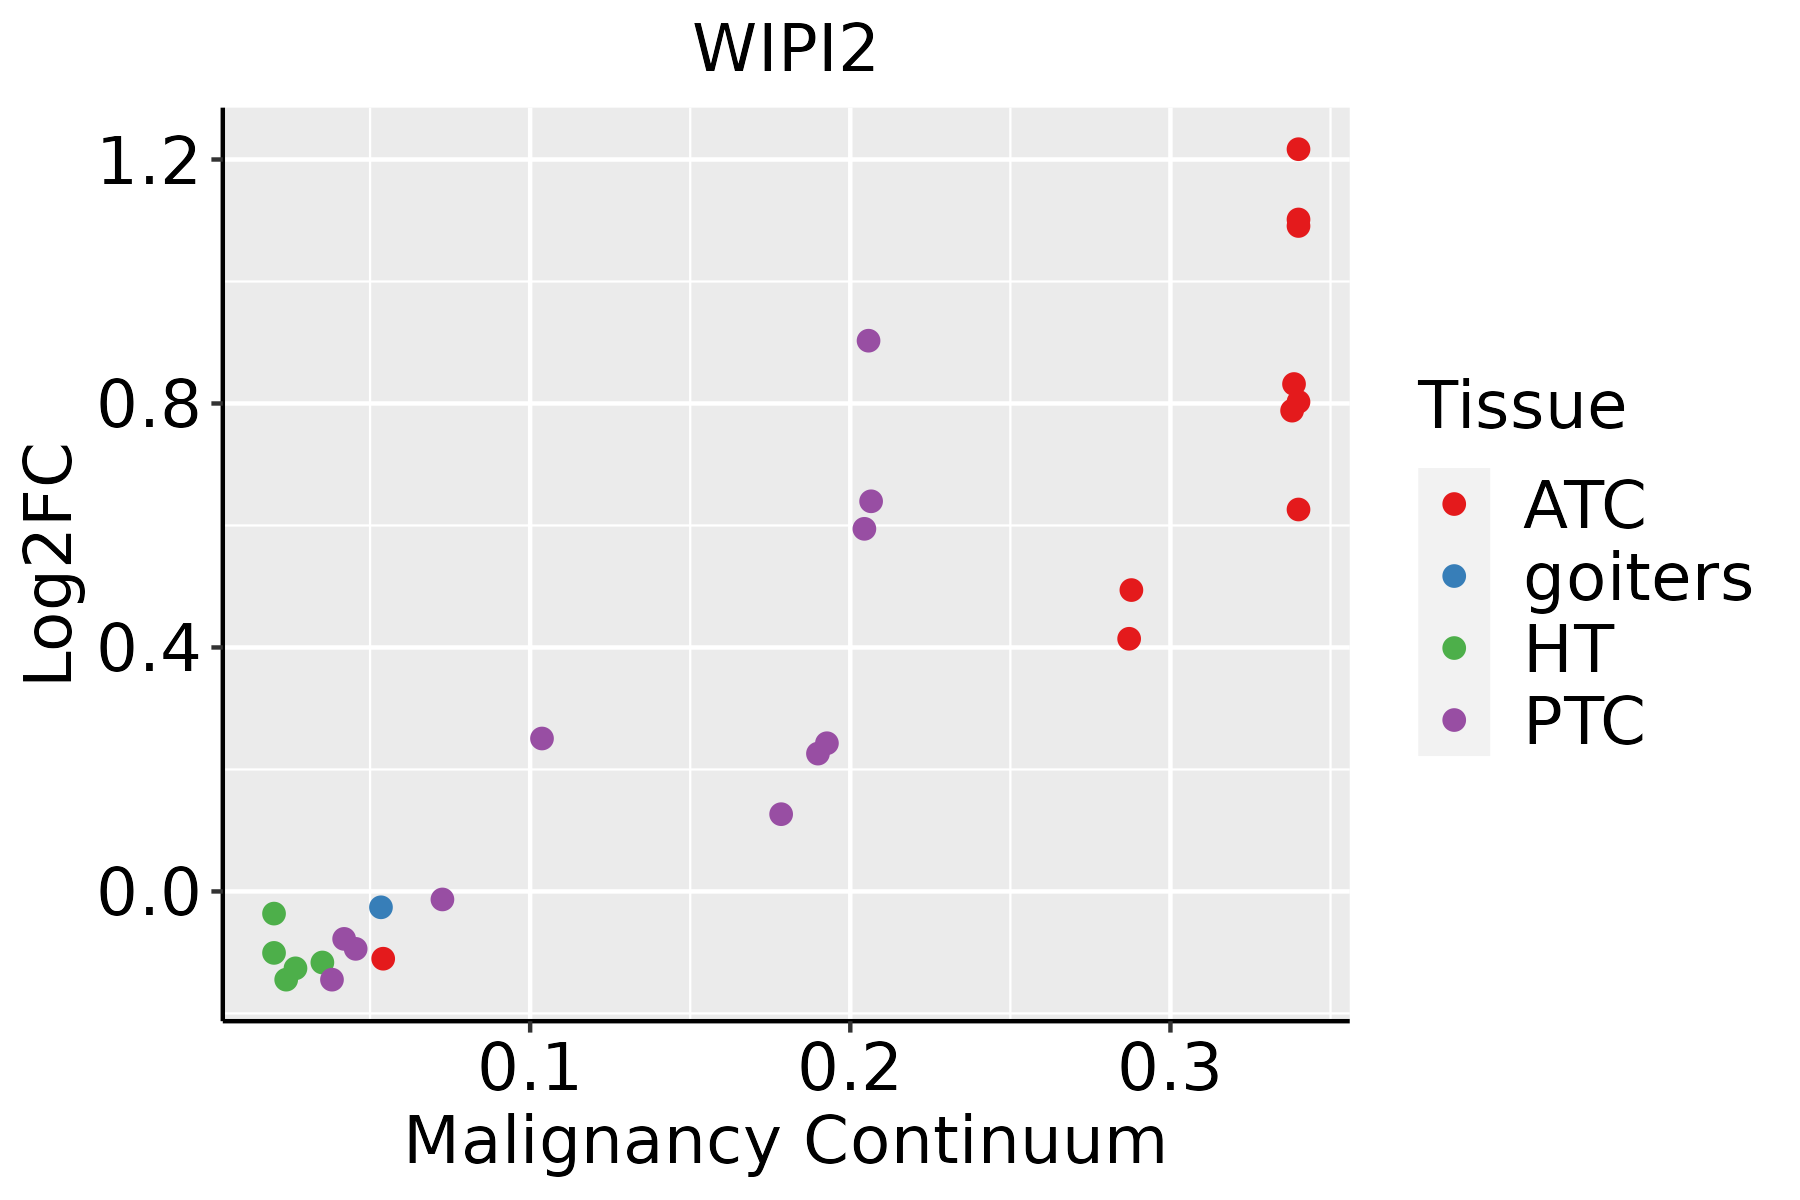 | ATC: Anaplastic thyroid cancer |
| HT: Hashimoto's thyroiditis | ||
| PTC: Papillary thyroid cancer |
| ∗log2FC in expression of this searched gene in stem-like cells from each diseased tissue sample relative to stem-like cells in normal samples in each tissue plotted against the malignancy continuum. Samples are colored based on if they are from different disease stage. |
Top |
Malignant transformation related pathway analysis |
| Find out the enriched GO biological processes and KEGG pathways involved in transition from healthy to precancer to cancer |
| Tissue | Disease Stage | Enriched GO biological Processes |
| Colorectum | AD |  |
| Colorectum | SER |  |
| Colorectum | MSS |  |
| Colorectum | MSI-H |  |
| Colorectum | FAP |  |
| ∗Top 15 enriched GO BP terms are showed in the bar plot of each disease state in each tissue. Each row represents a significant GO biological process which is colored according to the -log10(p.adjust). |
| Page: 1 2 3 4 5 6 7 8 9 |
| GO ID | Tissue | Disease Stage | Description | Gene Ratio | Bg Ratio | pvalue | p.adjust | Count |
| GO:0022411 | Colorectum | AD | cellular component disassembly | 147/3918 | 443/18723 | 8.53e-10 | 6.76e-08 | 147 |
| GO:0016236 | Colorectum | AD | macroautophagy | 103/3918 | 291/18723 | 6.76e-09 | 4.15e-07 | 103 |
| GO:1903008 | Colorectum | AD | organelle disassembly | 46/3918 | 114/18723 | 1.81e-06 | 5.48e-05 | 46 |
| GO:0000422 | Colorectum | AD | autophagy of mitochondrion | 35/3918 | 81/18723 | 4.94e-06 | 1.29e-04 | 35 |
| GO:0061726 | Colorectum | AD | mitochondrion disassembly | 35/3918 | 81/18723 | 4.94e-06 | 1.29e-04 | 35 |
| GO:0031667 | Colorectum | AD | response to nutrient levels | 138/3918 | 474/18723 | 1.22e-05 | 2.68e-04 | 138 |
| GO:0061912 | Colorectum | AD | selective autophagy | 29/3918 | 68/18723 | 4.20e-05 | 7.39e-04 | 29 |
| GO:0042594 | Colorectum | AD | response to starvation | 63/3918 | 197/18723 | 1.77e-04 | 2.38e-03 | 63 |
| GO:0071496 | Colorectum | AD | cellular response to external stimulus | 94/3918 | 320/18723 | 1.98e-04 | 2.64e-03 | 94 |
| GO:0009267 | Colorectum | AD | cellular response to starvation | 51/3918 | 156/18723 | 3.90e-04 | 4.44e-03 | 51 |
| GO:0031668 | Colorectum | AD | cellular response to extracellular stimulus | 71/3918 | 246/18723 | 1.86e-03 | 1.52e-02 | 71 |
| GO:0031669 | Colorectum | AD | cellular response to nutrient levels | 63/3918 | 215/18723 | 2.19e-03 | 1.73e-02 | 63 |
| GO:0007033 | Colorectum | AD | vacuole organization | 53/3918 | 180/18723 | 4.18e-03 | 2.89e-02 | 53 |
| GO:00224111 | Colorectum | SER | cellular component disassembly | 114/2897 | 443/18723 | 1.17e-08 | 9.59e-07 | 114 |
| GO:00162361 | Colorectum | SER | macroautophagy | 79/2897 | 291/18723 | 1.97e-07 | 1.10e-05 | 79 |
| GO:00004221 | Colorectum | SER | autophagy of mitochondrion | 29/2897 | 81/18723 | 5.61e-06 | 2.01e-04 | 29 |
| GO:00617261 | Colorectum | SER | mitochondrion disassembly | 29/2897 | 81/18723 | 5.61e-06 | 2.01e-04 | 29 |
| GO:19030081 | Colorectum | SER | organelle disassembly | 36/2897 | 114/18723 | 1.22e-05 | 3.89e-04 | 36 |
| GO:00316671 | Colorectum | SER | response to nutrient levels | 106/2897 | 474/18723 | 3.94e-05 | 1.00e-03 | 106 |
| GO:00619121 | Colorectum | SER | selective autophagy | 24/2897 | 68/18723 | 4.60e-05 | 1.15e-03 | 24 |
| Page: 1 2 3 4 5 6 7 8 9 10 11 |
| Pathway ID | Tissue | Disease Stage | Description | Gene Ratio | Bg Ratio | pvalue | p.adjust | qvalue | Count |
| hsa05010 | Colorectum | AD | Alzheimer disease | 174/2092 | 384/8465 | 1.82e-19 | 9.26e-18 | 5.91e-18 | 174 |
| hsa05016 | Colorectum | AD | Huntington disease | 147/2092 | 306/8465 | 1.93e-19 | 9.26e-18 | 5.91e-18 | 147 |
| hsa05014 | Colorectum | AD | Amyotrophic lateral sclerosis | 164/2092 | 364/8465 | 4.28e-18 | 1.27e-16 | 8.09e-17 | 164 |
| hsa05022 | Colorectum | AD | Pathways of neurodegeneration - multiple diseases | 201/2092 | 476/8465 | 4.54e-18 | 1.27e-16 | 8.09e-17 | 201 |
| hsa05131 | Colorectum | AD | Shigellosis | 109/2092 | 247/8465 | 1.09e-11 | 2.44e-10 | 1.55e-10 | 109 |
| hsa05017 | Colorectum | AD | Spinocerebellar ataxia | 60/2092 | 143/8465 | 3.78e-06 | 4.35e-05 | 2.78e-05 | 60 |
| hsa04140 | Colorectum | AD | Autophagy - animal | 49/2092 | 141/8465 | 4.58e-03 | 2.20e-02 | 1.40e-02 | 49 |
| hsa050101 | Colorectum | AD | Alzheimer disease | 174/2092 | 384/8465 | 1.82e-19 | 9.26e-18 | 5.91e-18 | 174 |
| hsa050161 | Colorectum | AD | Huntington disease | 147/2092 | 306/8465 | 1.93e-19 | 9.26e-18 | 5.91e-18 | 147 |
| hsa050141 | Colorectum | AD | Amyotrophic lateral sclerosis | 164/2092 | 364/8465 | 4.28e-18 | 1.27e-16 | 8.09e-17 | 164 |
| hsa050221 | Colorectum | AD | Pathways of neurodegeneration - multiple diseases | 201/2092 | 476/8465 | 4.54e-18 | 1.27e-16 | 8.09e-17 | 201 |
| hsa051311 | Colorectum | AD | Shigellosis | 109/2092 | 247/8465 | 1.09e-11 | 2.44e-10 | 1.55e-10 | 109 |
| hsa050171 | Colorectum | AD | Spinocerebellar ataxia | 60/2092 | 143/8465 | 3.78e-06 | 4.35e-05 | 2.78e-05 | 60 |
| hsa041401 | Colorectum | AD | Autophagy - animal | 49/2092 | 141/8465 | 4.58e-03 | 2.20e-02 | 1.40e-02 | 49 |
| hsa050162 | Colorectum | SER | Huntington disease | 127/1580 | 306/8465 | 3.29e-21 | 1.37e-19 | 9.92e-20 | 127 |
| hsa050102 | Colorectum | SER | Alzheimer disease | 146/1580 | 384/8465 | 6.52e-20 | 2.40e-18 | 1.75e-18 | 146 |
| hsa050222 | Colorectum | SER | Pathways of neurodegeneration - multiple diseases | 168/1580 | 476/8465 | 6.23e-19 | 2.07e-17 | 1.50e-17 | 168 |
| hsa050142 | Colorectum | SER | Amyotrophic lateral sclerosis | 138/1580 | 364/8465 | 9.89e-19 | 2.99e-17 | 2.17e-17 | 138 |
| hsa051312 | Colorectum | SER | Shigellosis | 87/1580 | 247/8465 | 3.07e-10 | 7.27e-09 | 5.28e-09 | 87 |
| hsa050172 | Colorectum | SER | Spinocerebellar ataxia | 46/1580 | 143/8465 | 6.78e-05 | 7.51e-04 | 5.45e-04 | 46 |
| Page: 1 2 3 4 5 6 7 8 |
Top |
Cell-cell communication analysis |
| Identification of potential cell-cell interactions between two cell types and their ligand-receptor pairs for different disease states |
| Ligand | Receptor | LRpair | Pathway | Tissue | Disease Stage |
| Page: 1 |
Top |
Single-cell gene regulatory network inference analysis |
| Find out the significant the regulons (TFs) and the target genes of each regulon across cell types for different disease states |
| TF | Cell Type | Tissue | Disease Stage | Target Gene | RSS | Regulon Activity |
| ∗The dot plots of a searched regulon are shown for all cell subpopulations in each disease state of each tissue based on the regulon specific score inferred using pySCENIC and by calculating the average expression. |
| Page: 1 |
Top |
Somatic mutation of malignant transformation related genes |
| Annotation of somatic variants for genes involved in malignant transformation |
| Hugo Symbol | Variant Class | Variant Classification | dbSNP RS | HGVSc | HGVSp | HGVSp Short | SWISSPROT | BIOTYPE | SIFT | PolyPhen | Tumor Sample Barcode | Tissue | Histology | Sex | Age | Stage | Therapy Types | Drugs | Outcome |
| WIPI2 | SNV | Missense_Mutation | rs371973214 | c.725N>A | p.Arg242Gln | p.R242Q | Q9Y4P8 | protein_coding | deleterious(0.02) | possibly_damaging(0.751) | TCGA-C8-A132-01 | Breast | breast invasive carcinoma | Female | <65 | I/II | Unknown | Unknown | SD |
| WIPI2 | SNV | Missense_Mutation | rs375365426 | c.1028C>T | p.Pro343Leu | p.P343L | Q9Y4P8 | protein_coding | tolerated(0.57) | benign(0.012) | TCGA-2W-A8YY-01 | Cervix | cervical & endocervical cancer | Female | <65 | I/II | Chemotherapy | cisplatin | CR |
| WIPI2 | SNV | Missense_Mutation | c.544N>A | p.Gly182Arg | p.G182R | Q9Y4P8 | protein_coding | deleterious(0) | probably_damaging(0.997) | TCGA-A6-5666-01 | Colorectum | colon adenocarcinoma | Male | >=65 | I/II | Unknown | Unknown | PD | |
| WIPI2 | SNV | Missense_Mutation | c.724N>T | p.Arg242Trp | p.R242W | Q9Y4P8 | protein_coding | deleterious(0) | benign(0.104) | TCGA-AA-3510-01 | Colorectum | colon adenocarcinoma | Male | >=65 | I/II | Unknown | Unknown | SD | |
| WIPI2 | SNV | Missense_Mutation | c.1229N>C | p.Val410Ala | p.V410A | Q9Y4P8 | protein_coding | tolerated(0.86) | benign(0) | TCGA-AA-3831-01 | Colorectum | colon adenocarcinoma | Male | >=65 | I/II | Unknown | Unknown | SD | |
| WIPI2 | SNV | Missense_Mutation | c.328N>C | p.Ile110Leu | p.I110L | Q9Y4P8 | protein_coding | tolerated(0.09) | possibly_damaging(0.452) | TCGA-AZ-6598-01 | Colorectum | colon adenocarcinoma | Female | >=65 | I/II | Unknown | Unknown | SD | |
| WIPI2 | SNV | Missense_Mutation | rs375365426 | c.1028N>T | p.Pro343Leu | p.P343L | Q9Y4P8 | protein_coding | tolerated(0.57) | benign(0.012) | TCGA-D5-6530-01 | Colorectum | colon adenocarcinoma | Male | <65 | I/II | Unknown | Unknown | SD |
| WIPI2 | SNV | Missense_Mutation | rs759604469 | c.488C>T | p.Ala163Val | p.A163V | Q9Y4P8 | protein_coding | deleterious(0.04) | benign(0.245) | TCGA-F4-6856-01 | Colorectum | colon adenocarcinoma | Male | <65 | I/II | Ancillary | leucovorin | CR |
| WIPI2 | insertion | Frame_Shift_Ins | novel | c.682dupA | p.Arg228LysfsTer13 | p.R228Kfs*13 | Q9Y4P8 | protein_coding | TCGA-EI-6509-01 | Colorectum | rectum adenocarcinoma | Male | <65 | III/IV | Chemotherapy | folfox | PD | ||
| WIPI2 | SNV | Missense_Mutation | rs759604469 | c.488C>T | p.Ala163Val | p.A163V | Q9Y4P8 | protein_coding | deleterious(0.04) | benign(0.245) | TCGA-A5-A0G2-01 | Endometrium | uterine corpus endometrioid carcinoma | Female | <65 | III/IV | Unknown | Unknown | SD |
| Page: 1 2 3 4 |
Top |
Related drugs of malignant transformation related genes |
| Identification of chemicals and drugs interact with genes involved in malignant transfromation |
| (DGIdb 4.0) |
| Entrez ID | Symbol | Category | Interaction Types | Drug Claim Name | Drug Name | PMIDs |
| Page: 1 |

Copyright 2023-Present -The University of Texas Health Science Center at Houston |