
|
|||||
|
 | |
| |
| |
| |
| |
| |
|
Gene: UBE2Q2 |
Gene summary for UBE2Q2 |
| Gene information | Species | Human | Gene symbol | UBE2Q2 | Gene ID | 92912 |
| Gene name | ubiquitin conjugating enzyme E2 Q2 | |
| Gene Alias | UBE2Q2 | |
| Cytomap | 15q24.2 | |
| Gene Type | protein-coding | GO ID | GO:0000209 | UniProtAcc | Q8WVN8 |
Top |
Malignant transformation analysis |
| Identification of the aberrant gene expression in precancerous and cancerous lesions by comparing the gene expression of stem-like cells in diseased tissues with normal stem cells |
| Entrez ID | Symbol | Replicates | Species | Organ | Tissue | Adj P-value | Log2FC | Malignancy |
| 92912 | UBE2Q2 | PTC06 | Human | Thyroid | PTC | 1.65e-17 | 4.06e-01 | 0.2057 |
| 92912 | UBE2Q2 | PTC07 | Human | Thyroid | PTC | 4.03e-19 | 2.55e-01 | 0.2044 |
| 92912 | UBE2Q2 | ATC09 | Human | Thyroid | ATC | 1.11e-06 | 1.14e-01 | 0.2871 |
| 92912 | UBE2Q2 | ATC11 | Human | Thyroid | ATC | 6.36e-10 | 5.35e-01 | 0.3386 |
| 92912 | UBE2Q2 | ATC12 | Human | Thyroid | ATC | 3.48e-22 | 3.38e-01 | 0.34 |
| 92912 | UBE2Q2 | ATC13 | Human | Thyroid | ATC | 1.39e-32 | 5.98e-01 | 0.34 |
| 92912 | UBE2Q2 | ATC1 | Human | Thyroid | ATC | 1.29e-06 | 1.42e-01 | 0.2878 |
| 92912 | UBE2Q2 | ATC2 | Human | Thyroid | ATC | 1.05e-17 | 9.58e-01 | 0.34 |
| 92912 | UBE2Q2 | ATC3 | Human | Thyroid | ATC | 8.25e-08 | 4.31e-01 | 0.338 |
| 92912 | UBE2Q2 | ATC4 | Human | Thyroid | ATC | 3.21e-27 | 4.50e-01 | 0.34 |
| 92912 | UBE2Q2 | ATC5 | Human | Thyroid | ATC | 7.71e-30 | 6.68e-01 | 0.34 |
| Page: 1 2 3 4 5 6 |
| Tissue | Expression Dynamics | Abbreviation |
| Esophagus | 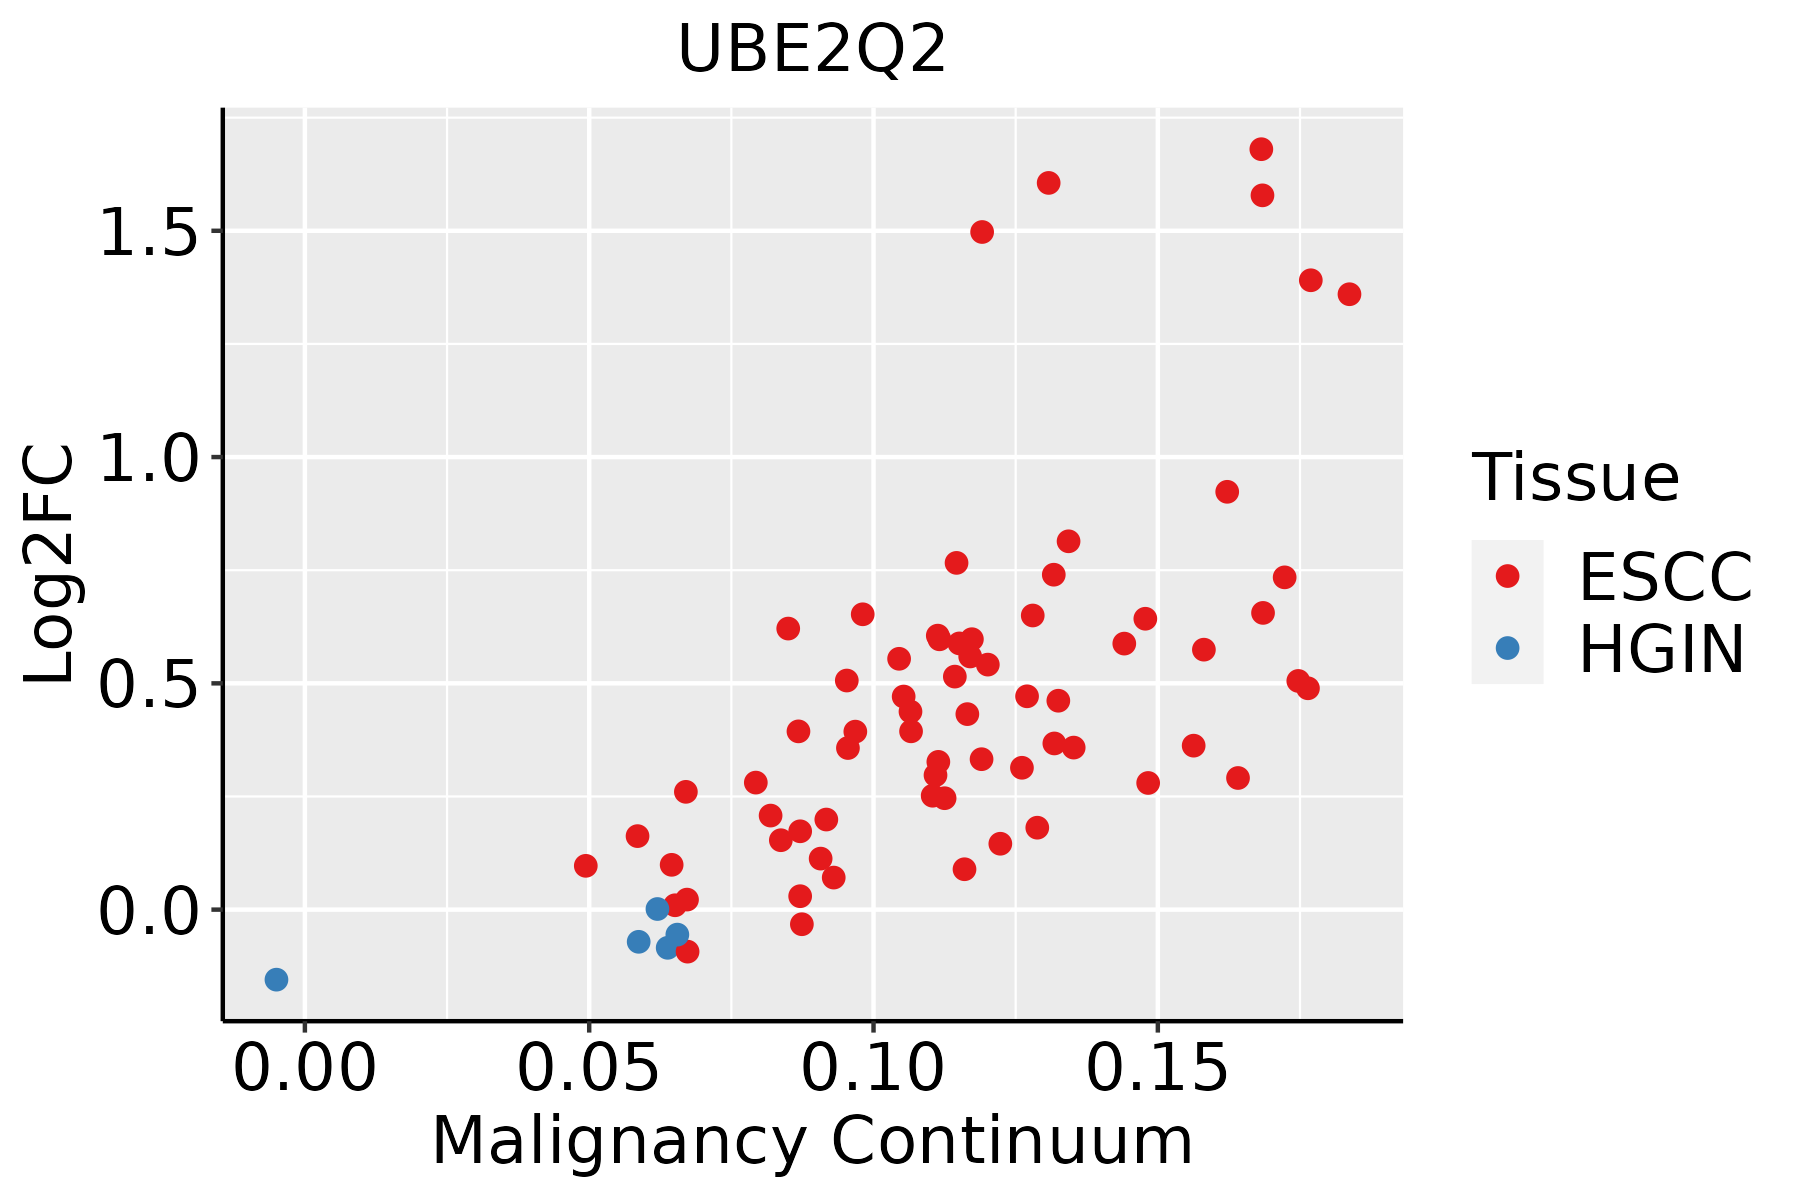 | ESCC: Esophageal squamous cell carcinoma |
| HGIN: High-grade intraepithelial neoplasias | ||
| LGIN: Low-grade intraepithelial neoplasias | ||
| Liver | 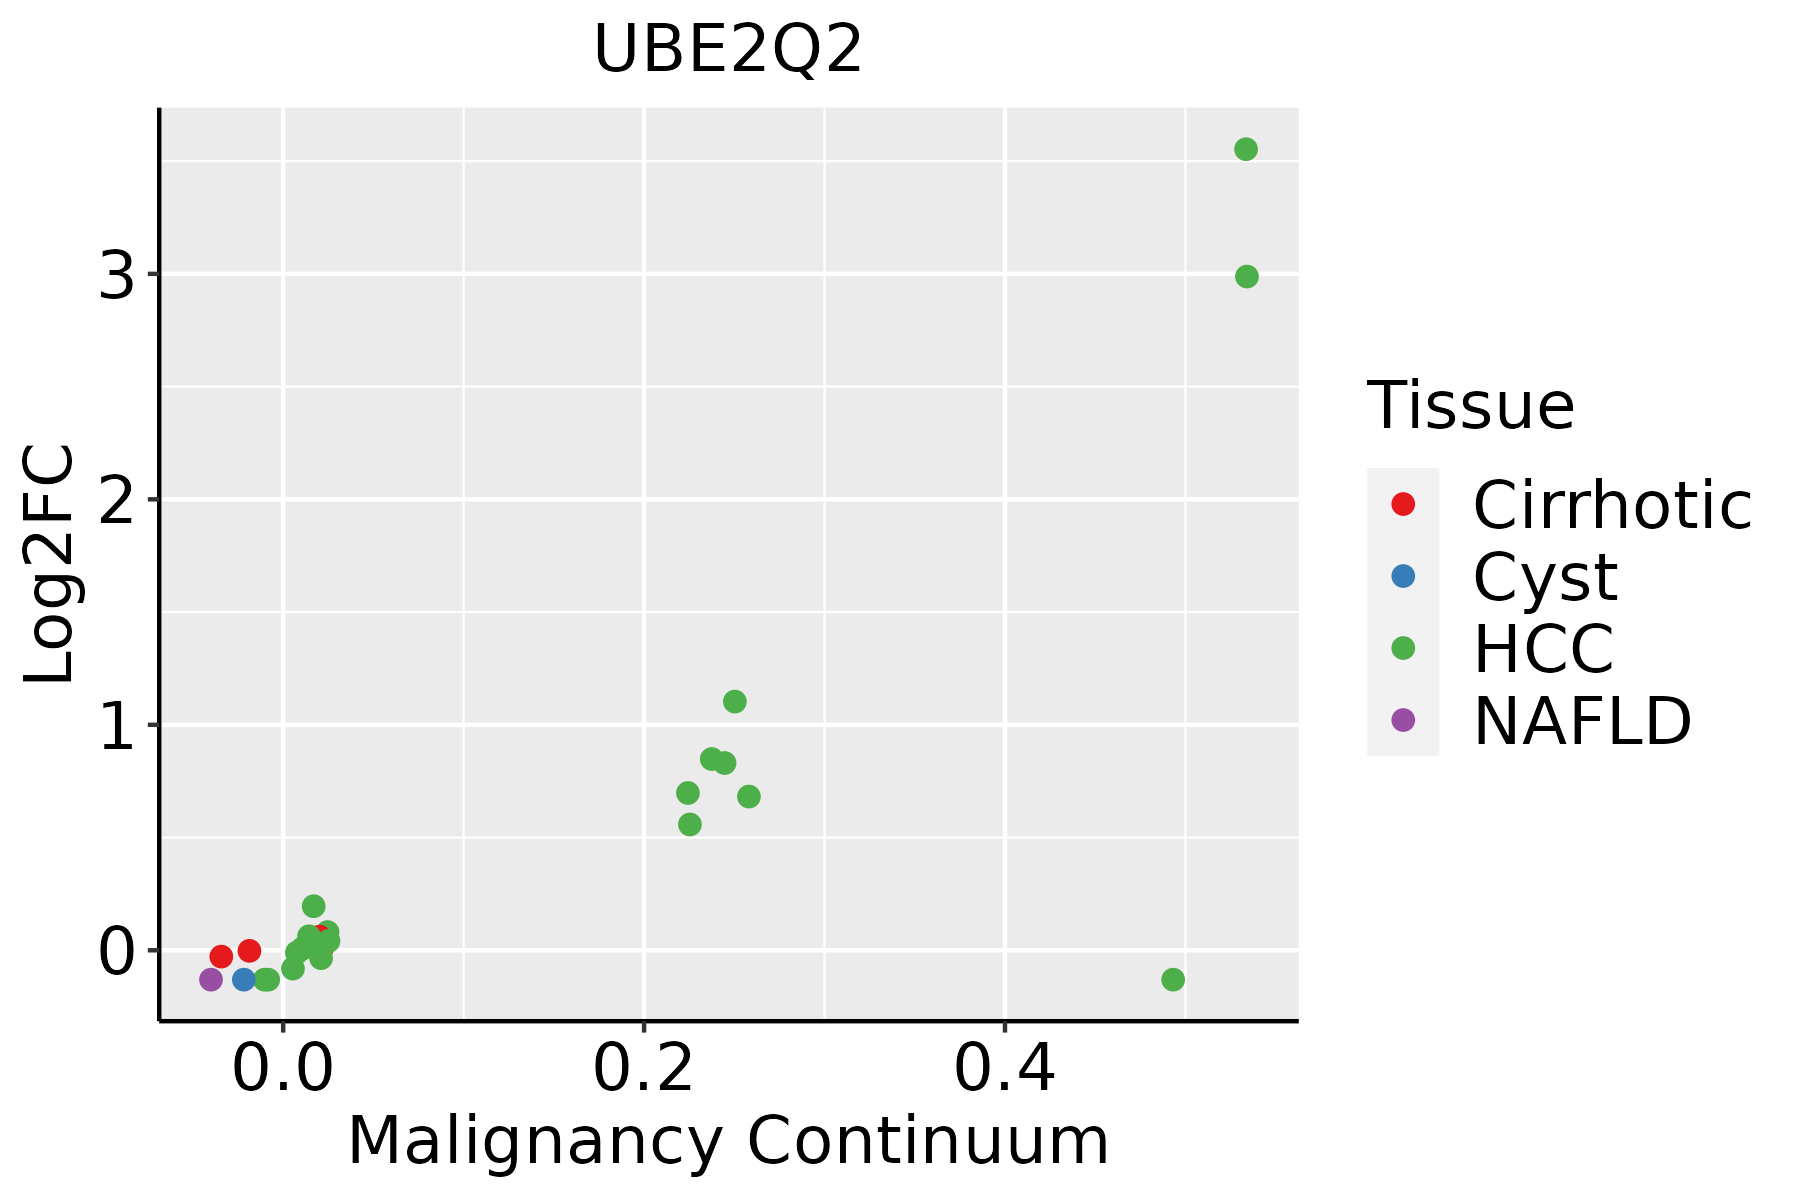 | HCC: Hepatocellular carcinoma |
| NAFLD: Non-alcoholic fatty liver disease | ||
| Oral Cavity |  | EOLP: Erosive Oral lichen planus |
| LP: leukoplakia | ||
| NEOLP: Non-erosive oral lichen planus | ||
| OSCC: Oral squamous cell carcinoma | ||
| Skin | 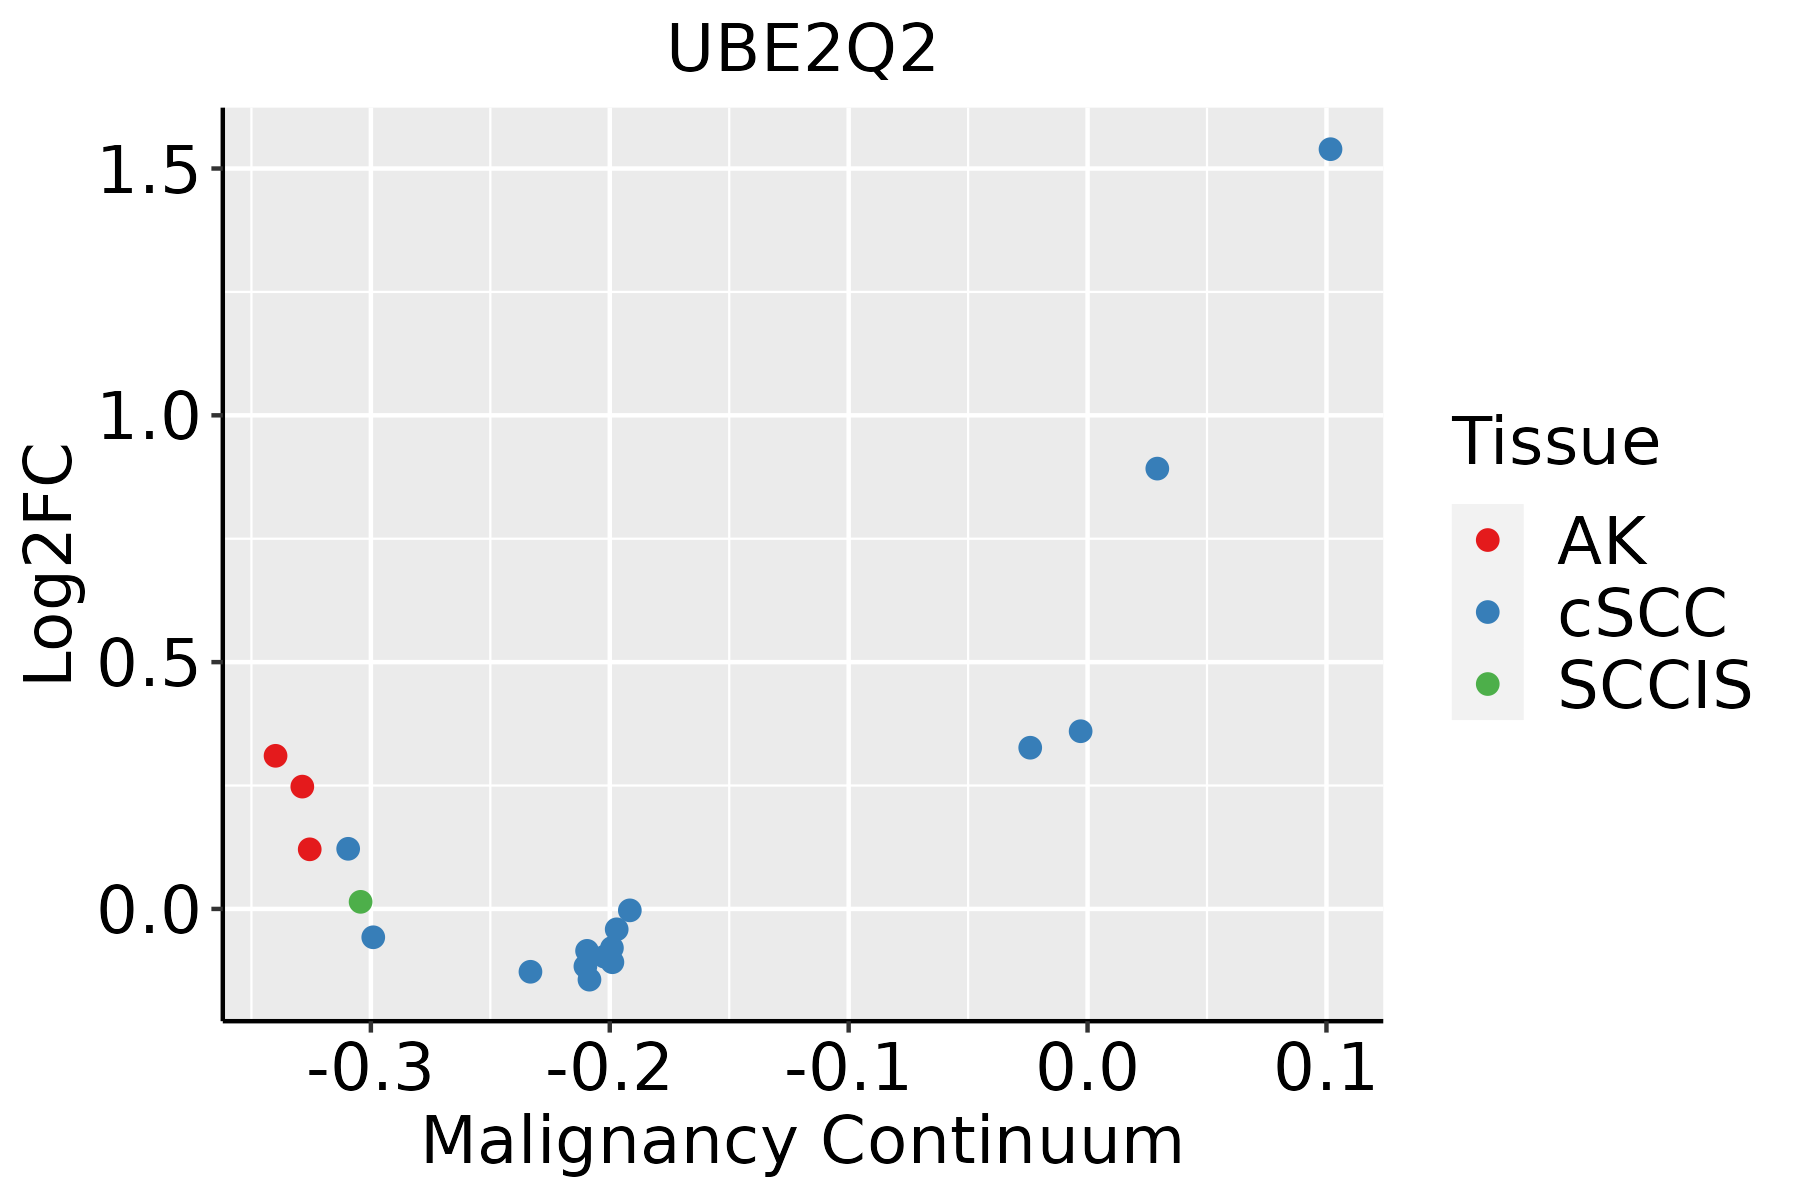 | AK: Actinic keratosis |
| cSCC: Cutaneous squamous cell carcinoma | ||
| SCCIS:squamous cell carcinoma in situ | ||
| Thyroid | 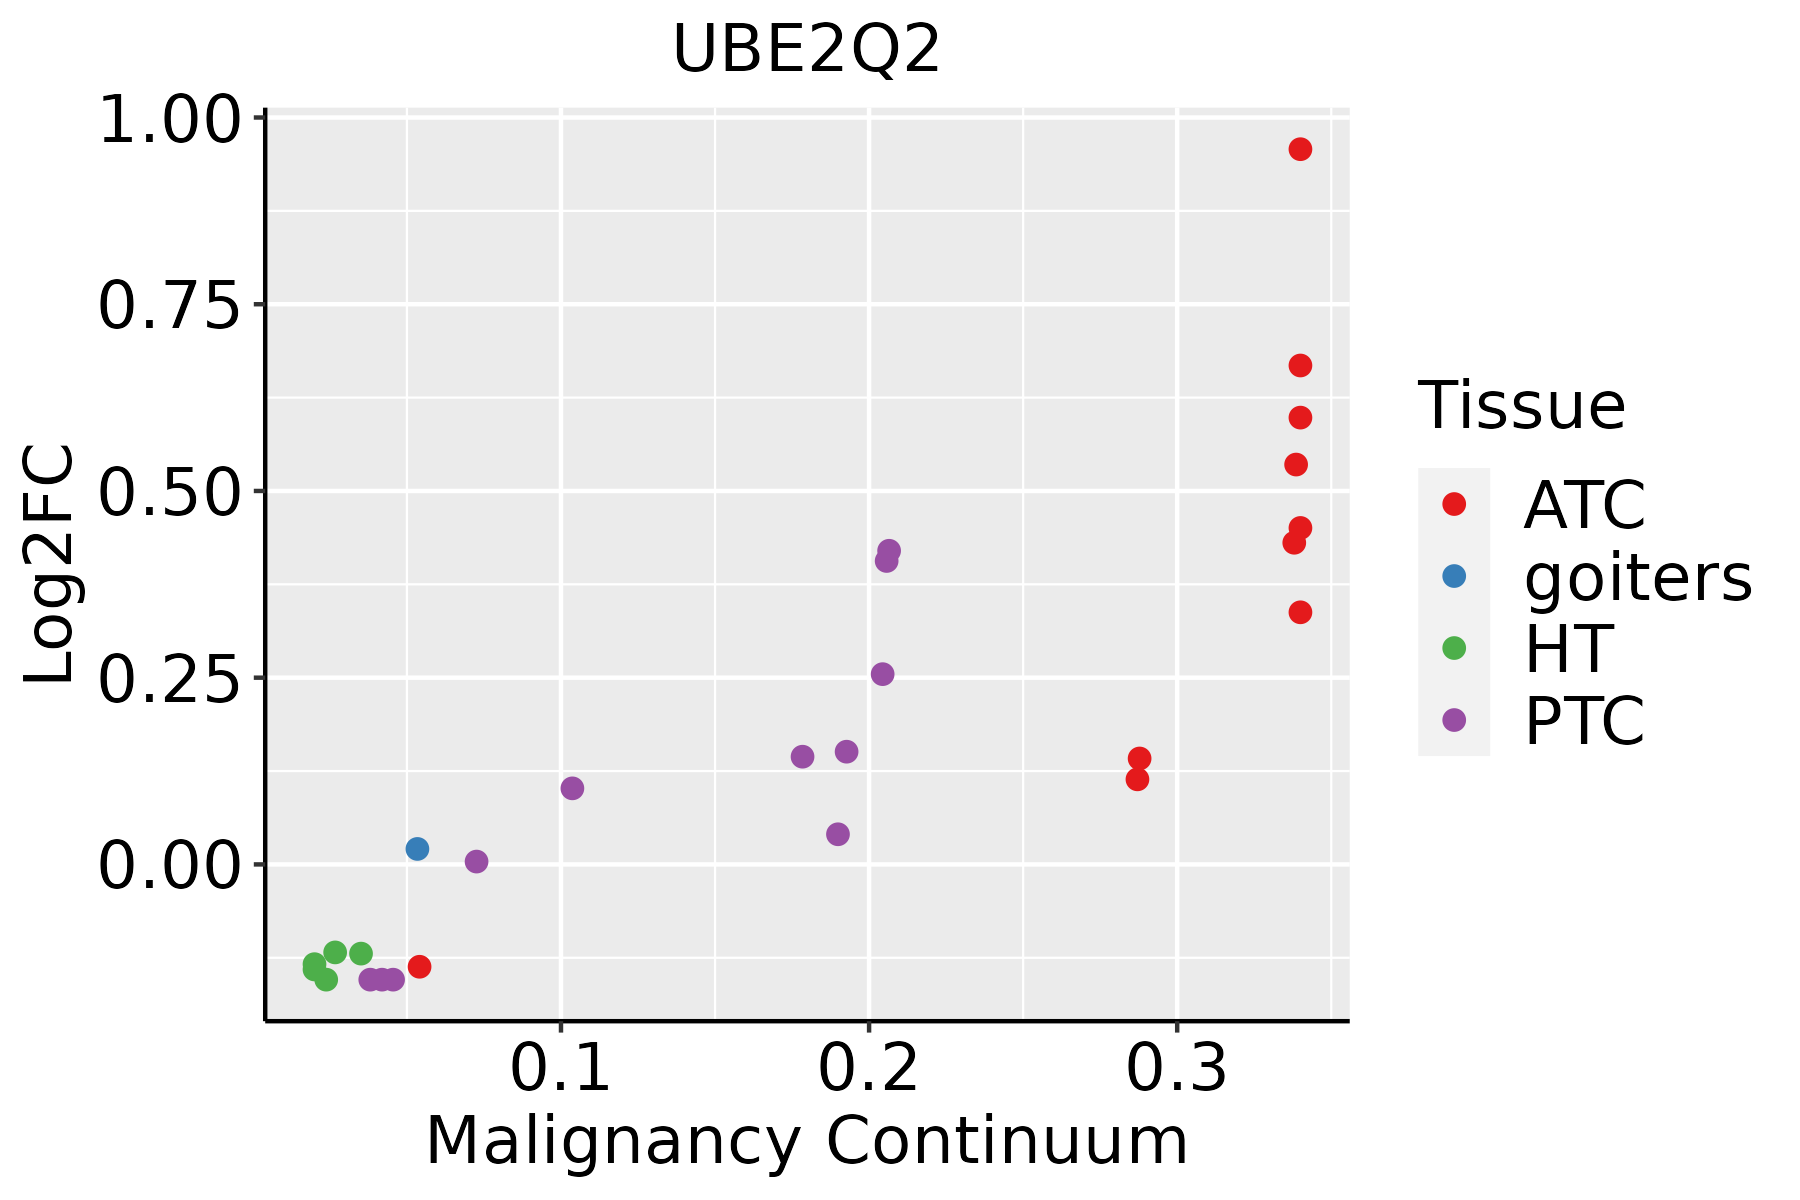 | ATC: Anaplastic thyroid cancer |
| HT: Hashimoto's thyroiditis | ||
| PTC: Papillary thyroid cancer |
| ∗log2FC in expression of this searched gene in stem-like cells from each diseased tissue sample relative to stem-like cells in normal samples in each tissue plotted against the malignancy continuum. Samples are colored based on if they are from different disease stage. |
Top |
Malignant transformation related pathway analysis |
| Find out the enriched GO biological processes and KEGG pathways involved in transition from healthy to precancer to cancer |
| Tissue | Disease Stage | Enriched GO biological Processes |
| Colorectum | AD |  |
| Colorectum | SER |  |
| Colorectum | MSS |  |
| Colorectum | MSI-H |  |
| Colorectum | FAP |  |
| ∗Top 15 enriched GO BP terms are showed in the bar plot of each disease state in each tissue. Each row represents a significant GO biological process which is colored according to the -log10(p.adjust). |
| Page: 1 2 3 4 5 6 7 8 9 |
| GO ID | Tissue | Disease Stage | Description | Gene Ratio | Bg Ratio | pvalue | p.adjust | Count |
| GO:000020917 | Esophagus | ESCC | protein polyubiquitination | 170/8552 | 236/18723 | 1.40e-16 | 1.09e-14 | 170 |
| GO:007093617 | Esophagus | ESCC | protein K48-linked ubiquitination | 55/8552 | 65/18723 | 8.42e-11 | 2.58e-09 | 55 |
| GO:000020921 | Liver | HCC | protein polyubiquitination | 151/7958 | 236/18723 | 1.90e-11 | 7.59e-10 | 151 |
| GO:007093621 | Liver | HCC | protein K48-linked ubiquitination | 52/7958 | 65/18723 | 6.70e-10 | 2.11e-08 | 52 |
| GO:000020910 | Oral cavity | OSCC | protein polyubiquitination | 150/7305 | 236/18723 | 1.59e-14 | 9.27e-13 | 150 |
| GO:00709369 | Oral cavity | OSCC | protein K48-linked ubiquitination | 53/7305 | 65/18723 | 2.47e-12 | 1.02e-10 | 53 |
| GO:007093622 | Oral cavity | EOLP | protein K48-linked ubiquitination | 31/2218 | 65/18723 | 9.08e-13 | 2.27e-10 | 31 |
| GO:000020923 | Oral cavity | EOLP | protein polyubiquitination | 62/2218 | 236/18723 | 7.88e-10 | 5.90e-08 | 62 |
| GO:007093631 | Oral cavity | NEOLP | protein K48-linked ubiquitination | 27/2005 | 65/18723 | 1.33e-10 | 1.34e-08 | 27 |
| GO:000020931 | Oral cavity | NEOLP | protein polyubiquitination | 53/2005 | 236/18723 | 1.22e-07 | 4.38e-06 | 53 |
| GO:007093618 | Skin | AK | protein K48-linked ubiquitination | 21/1910 | 65/18723 | 9.85e-07 | 3.17e-05 | 21 |
| GO:000020918 | Skin | AK | protein polyubiquitination | 41/1910 | 236/18723 | 4.78e-04 | 4.44e-03 | 41 |
| GO:007093623 | Skin | cSCC | protein K48-linked ubiquitination | 41/4864 | 65/18723 | 3.34e-10 | 1.37e-08 | 41 |
| GO:000020924 | Skin | cSCC | protein polyubiquitination | 103/4864 | 236/18723 | 2.57e-09 | 9.09e-08 | 103 |
| GO:000020920 | Thyroid | PTC | protein polyubiquitination | 128/5968 | 236/18723 | 7.81e-13 | 3.65e-11 | 128 |
| GO:007093620 | Thyroid | PTC | protein K48-linked ubiquitination | 45/5968 | 65/18723 | 6.91e-10 | 2.08e-08 | 45 |
| GO:0000209110 | Thyroid | ATC | protein polyubiquitination | 134/6293 | 236/18723 | 1.86e-13 | 9.20e-12 | 134 |
| GO:0070936110 | Thyroid | ATC | protein K48-linked ubiquitination | 47/6293 | 65/18723 | 1.98e-10 | 5.86e-09 | 47 |
| Page: 1 |
| Pathway ID | Tissue | Disease Stage | Description | Gene Ratio | Bg Ratio | pvalue | p.adjust | qvalue | Count |
| hsa0412027 | Esophagus | ESCC | Ubiquitin mediated proteolysis | 122/4205 | 142/8465 | 6.53e-20 | 7.29e-18 | 3.74e-18 | 122 |
| hsa0412036 | Esophagus | ESCC | Ubiquitin mediated proteolysis | 122/4205 | 142/8465 | 6.53e-20 | 7.29e-18 | 3.74e-18 | 122 |
| hsa0412041 | Liver | HCC | Ubiquitin mediated proteolysis | 110/4020 | 142/8465 | 1.67e-13 | 3.74e-12 | 2.08e-12 | 110 |
| hsa0412051 | Liver | HCC | Ubiquitin mediated proteolysis | 110/4020 | 142/8465 | 1.67e-13 | 3.74e-12 | 2.08e-12 | 110 |
| hsa0412020 | Oral cavity | OSCC | Ubiquitin mediated proteolysis | 105/3704 | 142/8465 | 1.83e-13 | 4.37e-12 | 2.23e-12 | 105 |
| hsa04120110 | Oral cavity | OSCC | Ubiquitin mediated proteolysis | 105/3704 | 142/8465 | 1.83e-13 | 4.37e-12 | 2.23e-12 | 105 |
| hsa0412043 | Oral cavity | EOLP | Ubiquitin mediated proteolysis | 48/1218 | 142/8465 | 3.55e-09 | 6.74e-08 | 3.98e-08 | 48 |
| hsa0412053 | Oral cavity | EOLP | Ubiquitin mediated proteolysis | 48/1218 | 142/8465 | 3.55e-09 | 6.74e-08 | 3.98e-08 | 48 |
| hsa0412061 | Oral cavity | NEOLP | Ubiquitin mediated proteolysis | 43/1112 | 142/8465 | 5.78e-08 | 9.19e-07 | 5.78e-07 | 43 |
| hsa0412071 | Oral cavity | NEOLP | Ubiquitin mediated proteolysis | 43/1112 | 142/8465 | 5.78e-08 | 9.19e-07 | 5.78e-07 | 43 |
| Page: 1 |
Top |
Cell-cell communication analysis |
| Identification of potential cell-cell interactions between two cell types and their ligand-receptor pairs for different disease states |
| Ligand | Receptor | LRpair | Pathway | Tissue | Disease Stage |
| Page: 1 |
Top |
Single-cell gene regulatory network inference analysis |
| Find out the significant the regulons (TFs) and the target genes of each regulon across cell types for different disease states |
| TF | Cell Type | Tissue | Disease Stage | Target Gene | RSS | Regulon Activity |
| ∗The dot plots of a searched regulon are shown for all cell subpopulations in each disease state of each tissue based on the regulon specific score inferred using pySCENIC and by calculating the average expression. |
| Page: 1 |
Top |
Somatic mutation of malignant transformation related genes |
| Annotation of somatic variants for genes involved in malignant transformation |
| Hugo Symbol | Variant Class | Variant Classification | dbSNP RS | HGVSc | HGVSp | HGVSp Short | SWISSPROT | BIOTYPE | SIFT | PolyPhen | Tumor Sample Barcode | Tissue | Histology | Sex | Age | Stage | Therapy Types | Drugs | Outcome |
| UBE2Q2 | SNV | Missense_Mutation | novel | c.968T>A | p.Ile323Asn | p.I323N | Q8WVN8 | protein_coding | deleterious(0) | probably_damaging(0.989) | TCGA-A1-A0SO-01 | Breast | breast invasive carcinoma | Female | >=65 | I/II | Chemotherapy | SD | |
| UBE2Q2 | SNV | Missense_Mutation | rs772156143 | c.203N>T | p.Pro68Leu | p.P68L | Q8WVN8 | protein_coding | deleterious(0) | possibly_damaging(0.864) | TCGA-A8-A09B-01 | Breast | breast invasive carcinoma | Female | <65 | III/IV | Chemotherapy | 5-fluorouracil | SD |
| UBE2Q2 | SNV | Missense_Mutation | c.289C>G | p.Gln97Glu | p.Q97E | Q8WVN8 | protein_coding | tolerated(0.11) | possibly_damaging(0.674) | TCGA-AC-A23H-01 | Breast | breast invasive carcinoma | Female | >=65 | I/II | Unknown | Unknown | PD | |
| UBE2Q2 | SNV | Missense_Mutation | novel | c.796N>A | p.Glu266Lys | p.E266K | Q8WVN8 | protein_coding | deleterious(0) | benign(0.159) | TCGA-2W-A8YY-01 | Cervix | cervical & endocervical cancer | Female | <65 | I/II | Chemotherapy | cisplatin | CR |
| UBE2Q2 | SNV | Missense_Mutation | c.48N>G | p.Ile16Met | p.I16M | Q8WVN8 | protein_coding | tolerated(0.08) | probably_damaging(0.963) | TCGA-IR-A3LA-01 | Cervix | cervical & endocervical cancer | Female | <65 | I/II | Chemotherapy | cisplatin | CR | |
| UBE2Q2 | SNV | Missense_Mutation | rs183750720 | c.287G>A | p.Arg96His | p.R96H | Q8WVN8 | protein_coding | tolerated(0.1) | benign(0.005) | TCGA-AA-3713-01 | Colorectum | colon adenocarcinoma | Male | >=65 | III/IV | Chemotherapy | 5-fluorouracil | PR |
| UBE2Q2 | SNV | Missense_Mutation | rs183750720 | c.287G>A | p.Arg96His | p.R96H | Q8WVN8 | protein_coding | tolerated(0.1) | benign(0.005) | TCGA-AA-3977-01 | Colorectum | colon adenocarcinoma | Male | >=65 | I/II | Unknown | Unknown | SD |
| UBE2Q2 | SNV | Missense_Mutation | novel | c.232N>C | p.Asn78His | p.N78H | Q8WVN8 | protein_coding | tolerated(0.11) | possibly_damaging(0.726) | TCGA-F5-6814-01 | Colorectum | rectum adenocarcinoma | Male | <65 | I/II | Unknown | Unknown | SD |
| UBE2Q2 | insertion | In_Frame_Ins | novel | c.413_414insAGA | p.Glu146dup | p.E146dup | Q8WVN8 | protein_coding | TCGA-G4-6304-01 | Colorectum | colon adenocarcinoma | Female | >=65 | I/II | Chemotherapy | fluorouracil | PD | ||
| UBE2Q2 | SNV | Missense_Mutation | novel | c.476N>C | p.Met159Thr | p.M159T | Q8WVN8 | protein_coding | deleterious(0.04) | benign(0.015) | TCGA-A5-A0G2-01 | Endometrium | uterine corpus endometrioid carcinoma | Female | <65 | III/IV | Unknown | Unknown | SD |
| Page: 1 2 3 |
Top |
Related drugs of malignant transformation related genes |
| Identification of chemicals and drugs interact with genes involved in malignant transfromation |
| (DGIdb 4.0) |
| Entrez ID | Symbol | Category | Interaction Types | Drug Claim Name | Drug Name | PMIDs |
| Page: 1 |

Copyright 2023-Present -The University of Texas Health Science Center at Houston |