
|
|||||
|
 | |
| |
| |
| |
| |
| |
|
Gene: UBE2I |
Gene summary for UBE2I |
| Gene information | Species | Human | Gene symbol | UBE2I | Gene ID | 7329 |
| Gene name | ubiquitin conjugating enzyme E2 I | |
| Gene Alias | C358B7.1 | |
| Cytomap | 16p13.3 | |
| Gene Type | protein-coding | GO ID | GO:0000122 | UniProtAcc | A8K503 |
Top |
Malignant transformation analysis |
| Identification of the aberrant gene expression in precancerous and cancerous lesions by comparing the gene expression of stem-like cells in diseased tissues with normal stem cells |
| Entrez ID | Symbol | Replicates | Species | Organ | Tissue | Adj P-value | Log2FC | Malignancy |
| 7329 | UBE2I | P107T-E | Human | Esophagus | ESCC | 1.35e-71 | 2.28e+00 | 0.171 |
| 7329 | UBE2I | P126T-E | Human | Esophagus | ESCC | 1.02e-18 | 2.26e+00 | 0.1125 |
| 7329 | UBE2I | P127T-E | Human | Esophagus | ESCC | 4.95e-50 | 1.12e+00 | 0.0826 |
| 7329 | UBE2I | P128T-E | Human | Esophagus | ESCC | 6.75e-50 | 2.08e+00 | 0.1241 |
| 7329 | UBE2I | P130T-E | Human | Esophagus | ESCC | 4.31e-96 | 2.22e+00 | 0.1676 |
| 7329 | UBE2I | S43 | Human | Liver | Cirrhotic | 2.22e-15 | -3.81e-01 | -0.0187 |
| 7329 | UBE2I | HCC1_Meng | Human | Liver | HCC | 2.76e-89 | 3.92e-03 | 0.0246 |
| 7329 | UBE2I | HCC2_Meng | Human | Liver | HCC | 5.24e-50 | 1.22e-01 | 0.0107 |
| 7329 | UBE2I | cirrhotic1 | Human | Liver | Cirrhotic | 9.53e-16 | 2.25e-01 | 0.0202 |
| 7329 | UBE2I | cirrhotic2 | Human | Liver | Cirrhotic | 1.85e-18 | 1.30e-01 | 0.0201 |
| 7329 | UBE2I | cirrhotic3 | Human | Liver | Cirrhotic | 1.96e-13 | 1.65e-01 | 0.0215 |
| 7329 | UBE2I | HCC1 | Human | Liver | HCC | 4.88e-02 | 3.71e+00 | 0.5336 |
| 7329 | UBE2I | HCC5 | Human | Liver | HCC | 2.39e-04 | 5.93e-01 | 0.4932 |
| 7329 | UBE2I | Pt13.b | Human | Liver | HCC | 1.12e-31 | 2.82e-01 | 0.0251 |
| 7329 | UBE2I | Pt14.b | Human | Liver | HCC | 4.17e-02 | 2.61e-02 | 0.018 |
| 7329 | UBE2I | S014 | Human | Liver | HCC | 5.22e-29 | 1.50e+00 | 0.2254 |
| 7329 | UBE2I | S015 | Human | Liver | HCC | 1.55e-22 | 1.56e+00 | 0.2375 |
| 7329 | UBE2I | S016 | Human | Liver | HCC | 1.31e-28 | 1.55e+00 | 0.2243 |
| 7329 | UBE2I | S027 | Human | Liver | HCC | 5.42e-18 | 1.75e+00 | 0.2446 |
| 7329 | UBE2I | S028 | Human | Liver | HCC | 2.27e-26 | 2.01e+00 | 0.2503 |
| Page: 1 2 3 4 5 6 7 8 9 |
| Tissue | Expression Dynamics | Abbreviation |
| Colorectum (GSE201348) |  | FAP: Familial adenomatous polyposis |
| CRC: Colorectal cancer | ||
| Colorectum (HTA11) |  | AD: Adenomas |
| SER: Sessile serrated lesions | ||
| MSI-H: Microsatellite-high colorectal cancer | ||
| MSS: Microsatellite stable colorectal cancer | ||
| Endometrium | 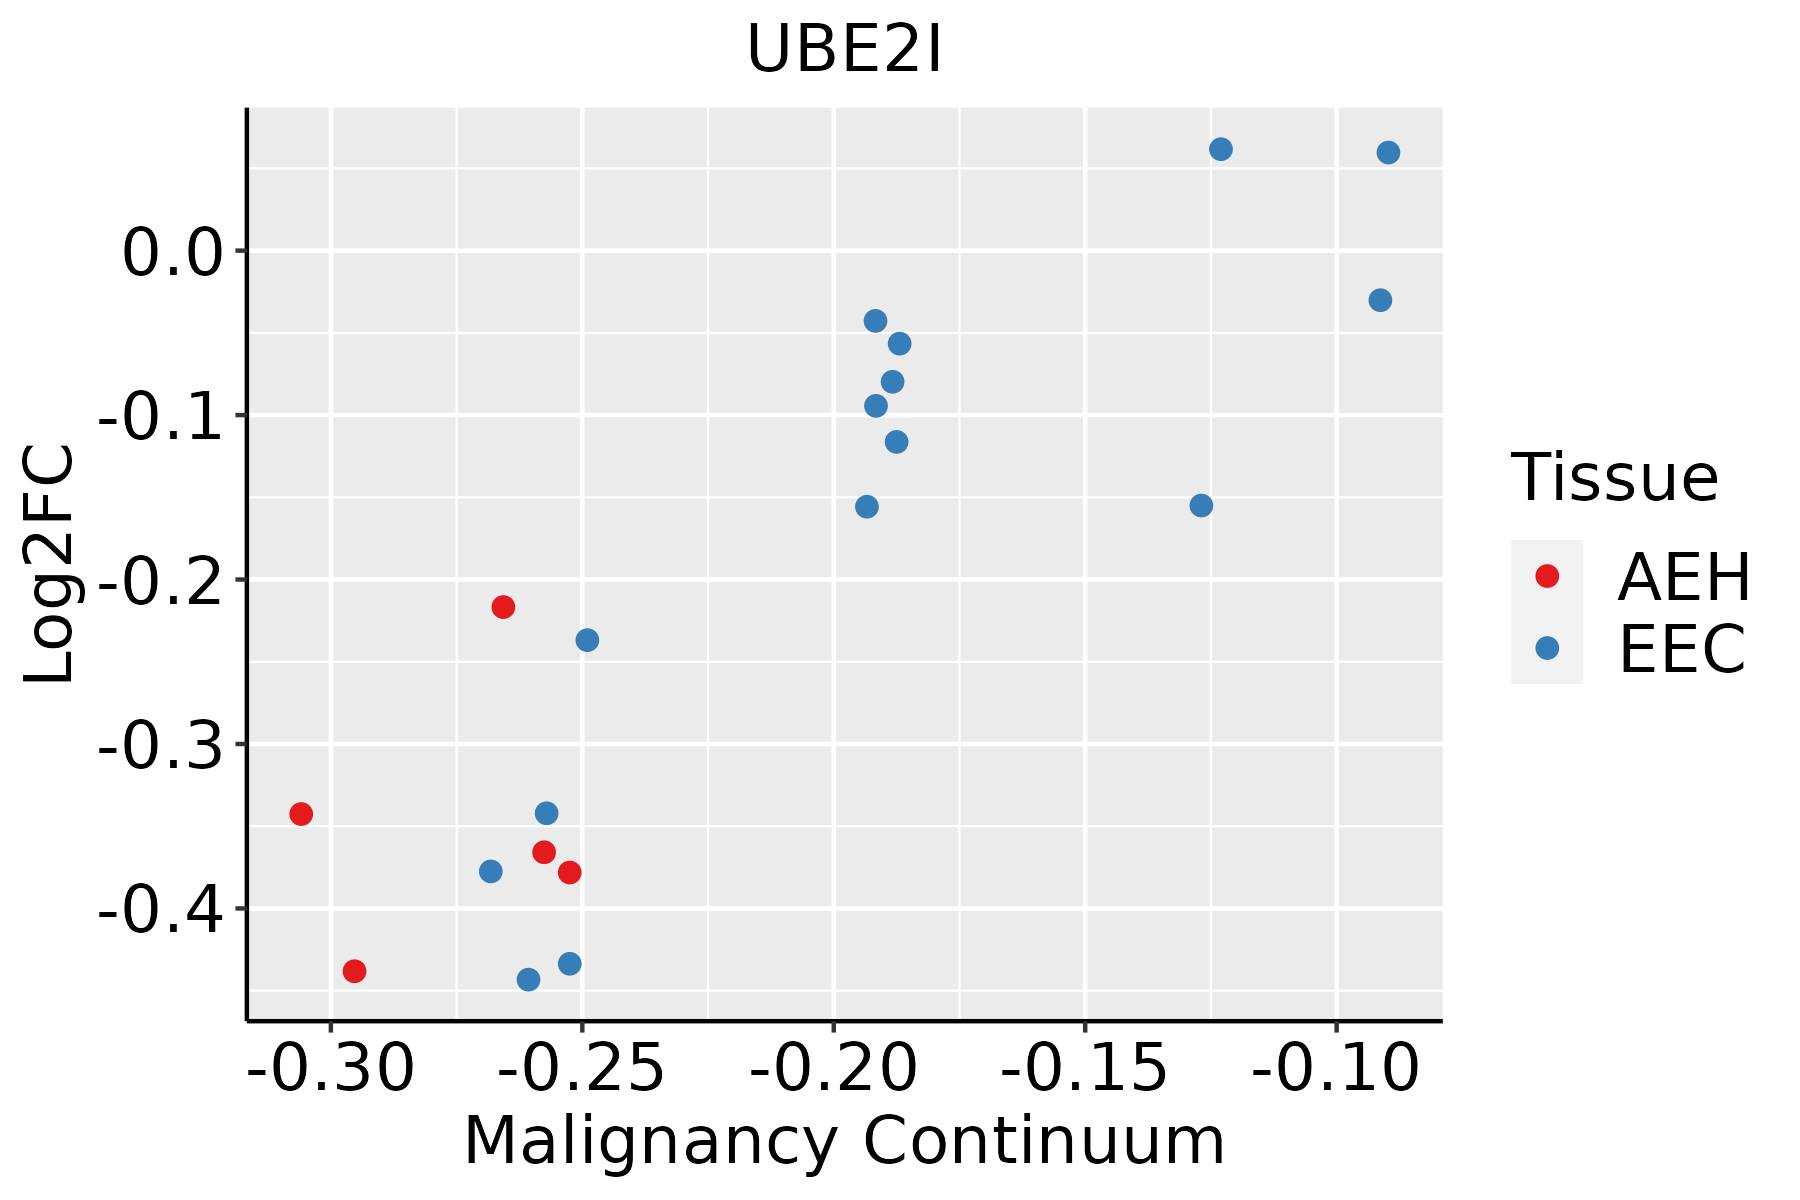 | AEH: Atypical endometrial hyperplasia |
| EEC: Endometrioid Cancer | ||
| Esophagus |  | ESCC: Esophageal squamous cell carcinoma |
| HGIN: High-grade intraepithelial neoplasias | ||
| LGIN: Low-grade intraepithelial neoplasias | ||
| Liver | 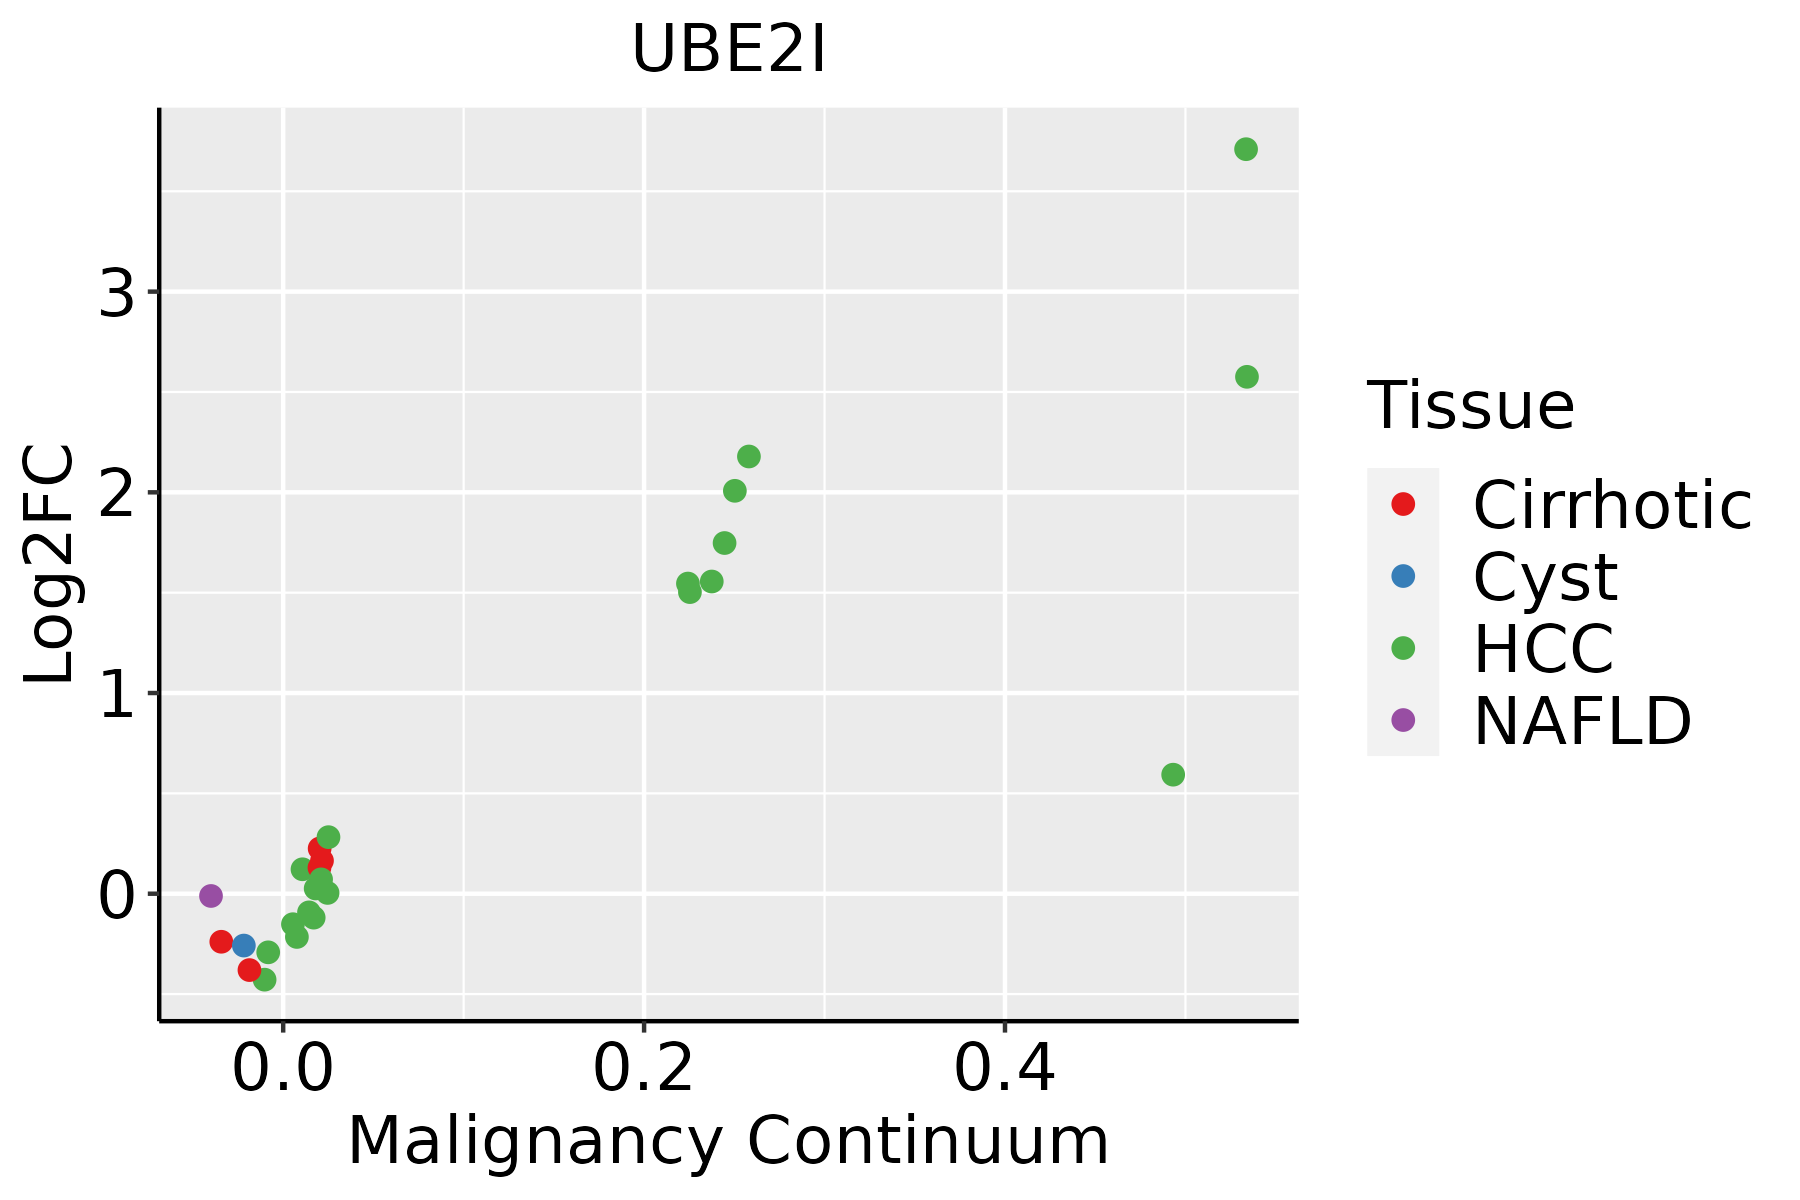 | HCC: Hepatocellular carcinoma |
| NAFLD: Non-alcoholic fatty liver disease | ||
| Oral Cavity | 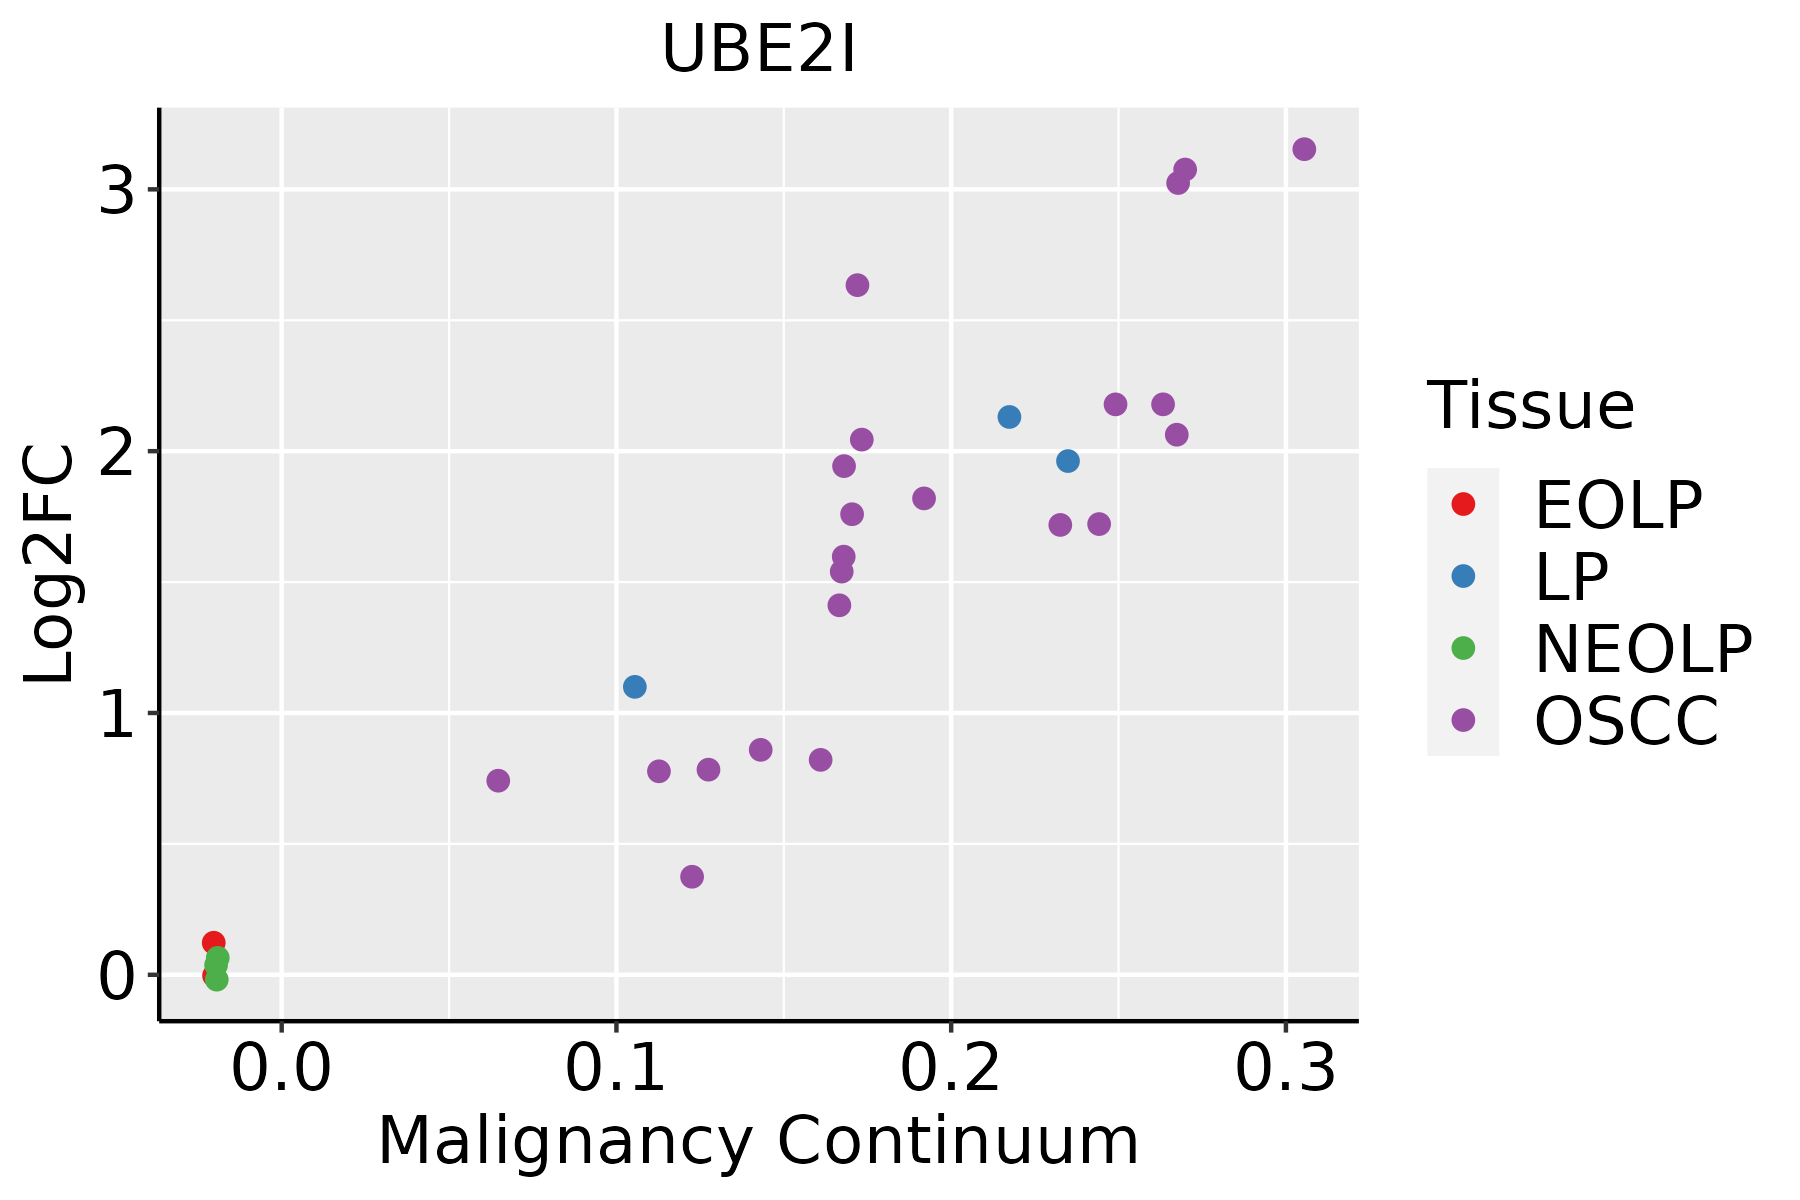 | EOLP: Erosive Oral lichen planus |
| LP: leukoplakia | ||
| NEOLP: Non-erosive oral lichen planus | ||
| OSCC: Oral squamous cell carcinoma | ||
| Prostate | 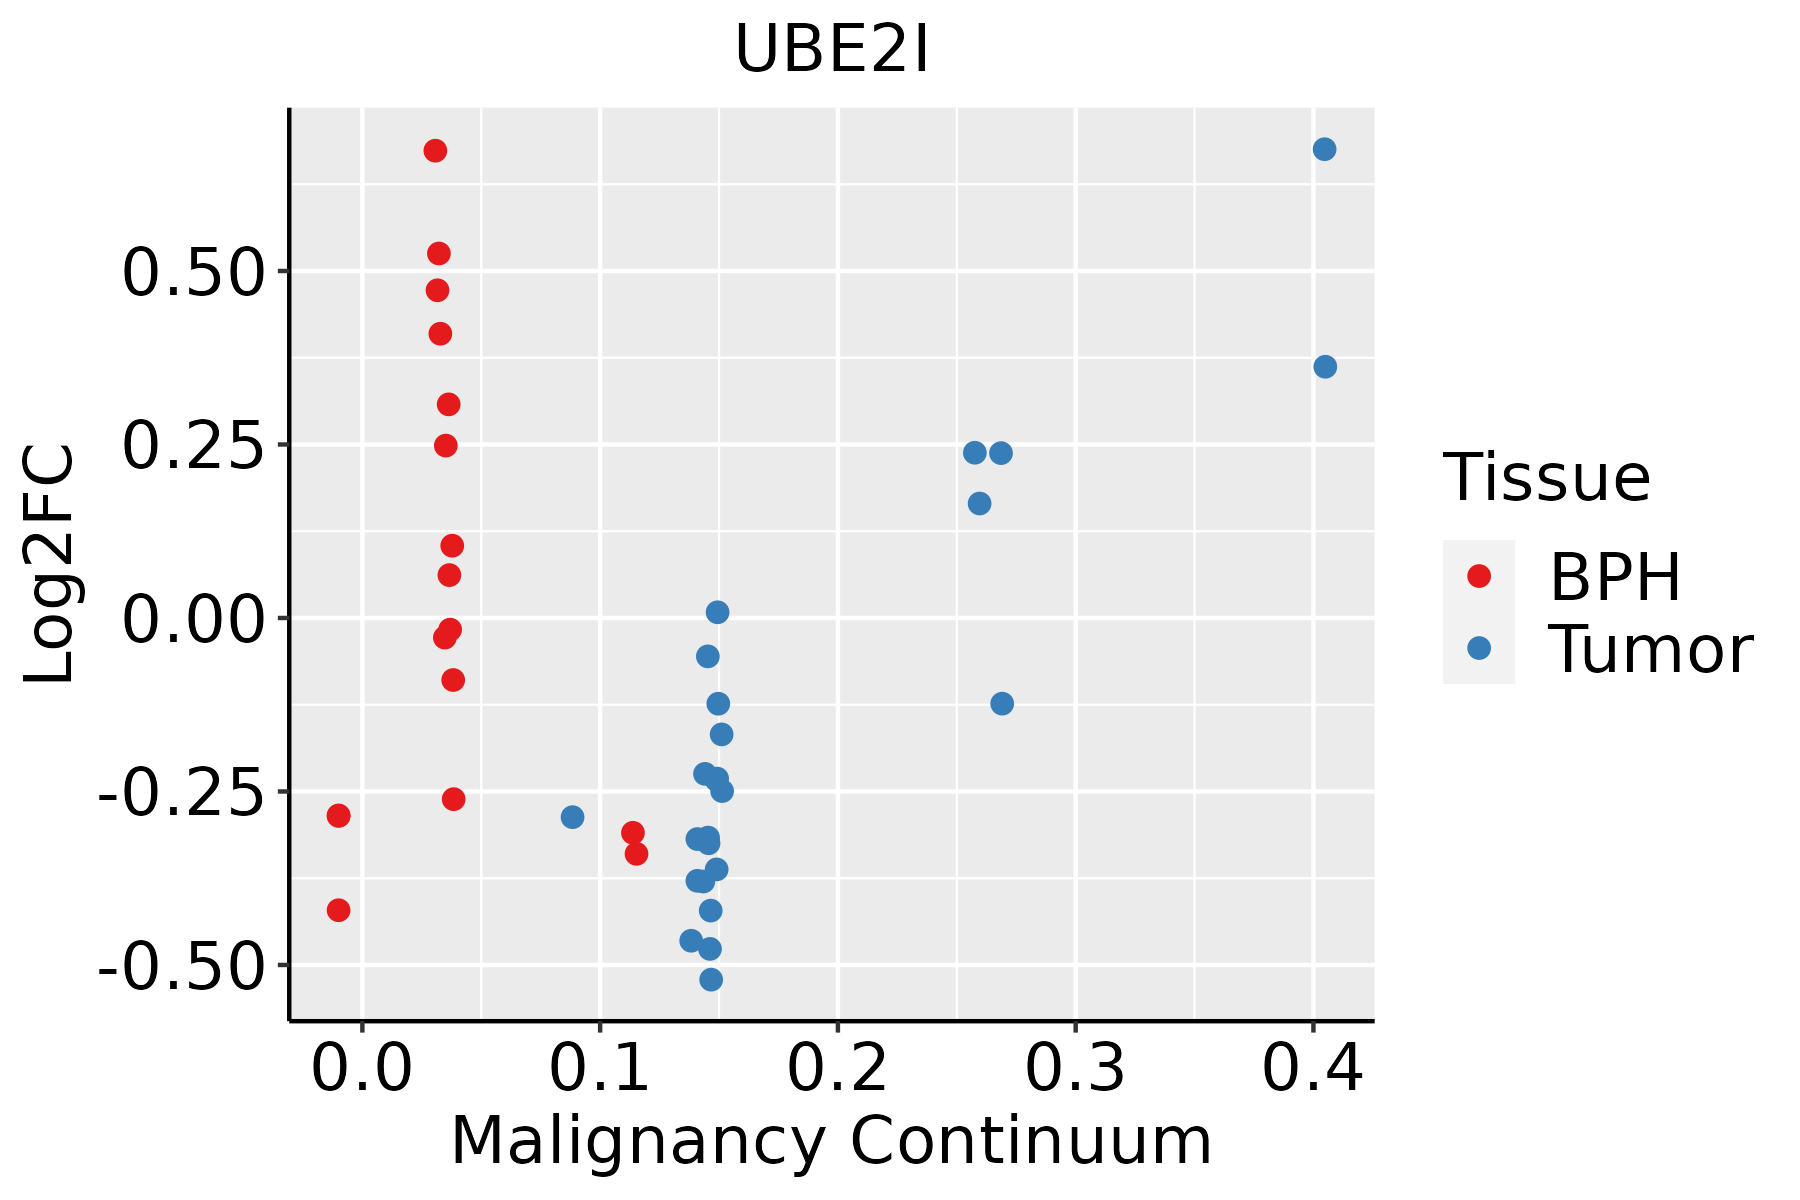 | BPH: Benign Prostatic Hyperplasia |
| Skin | 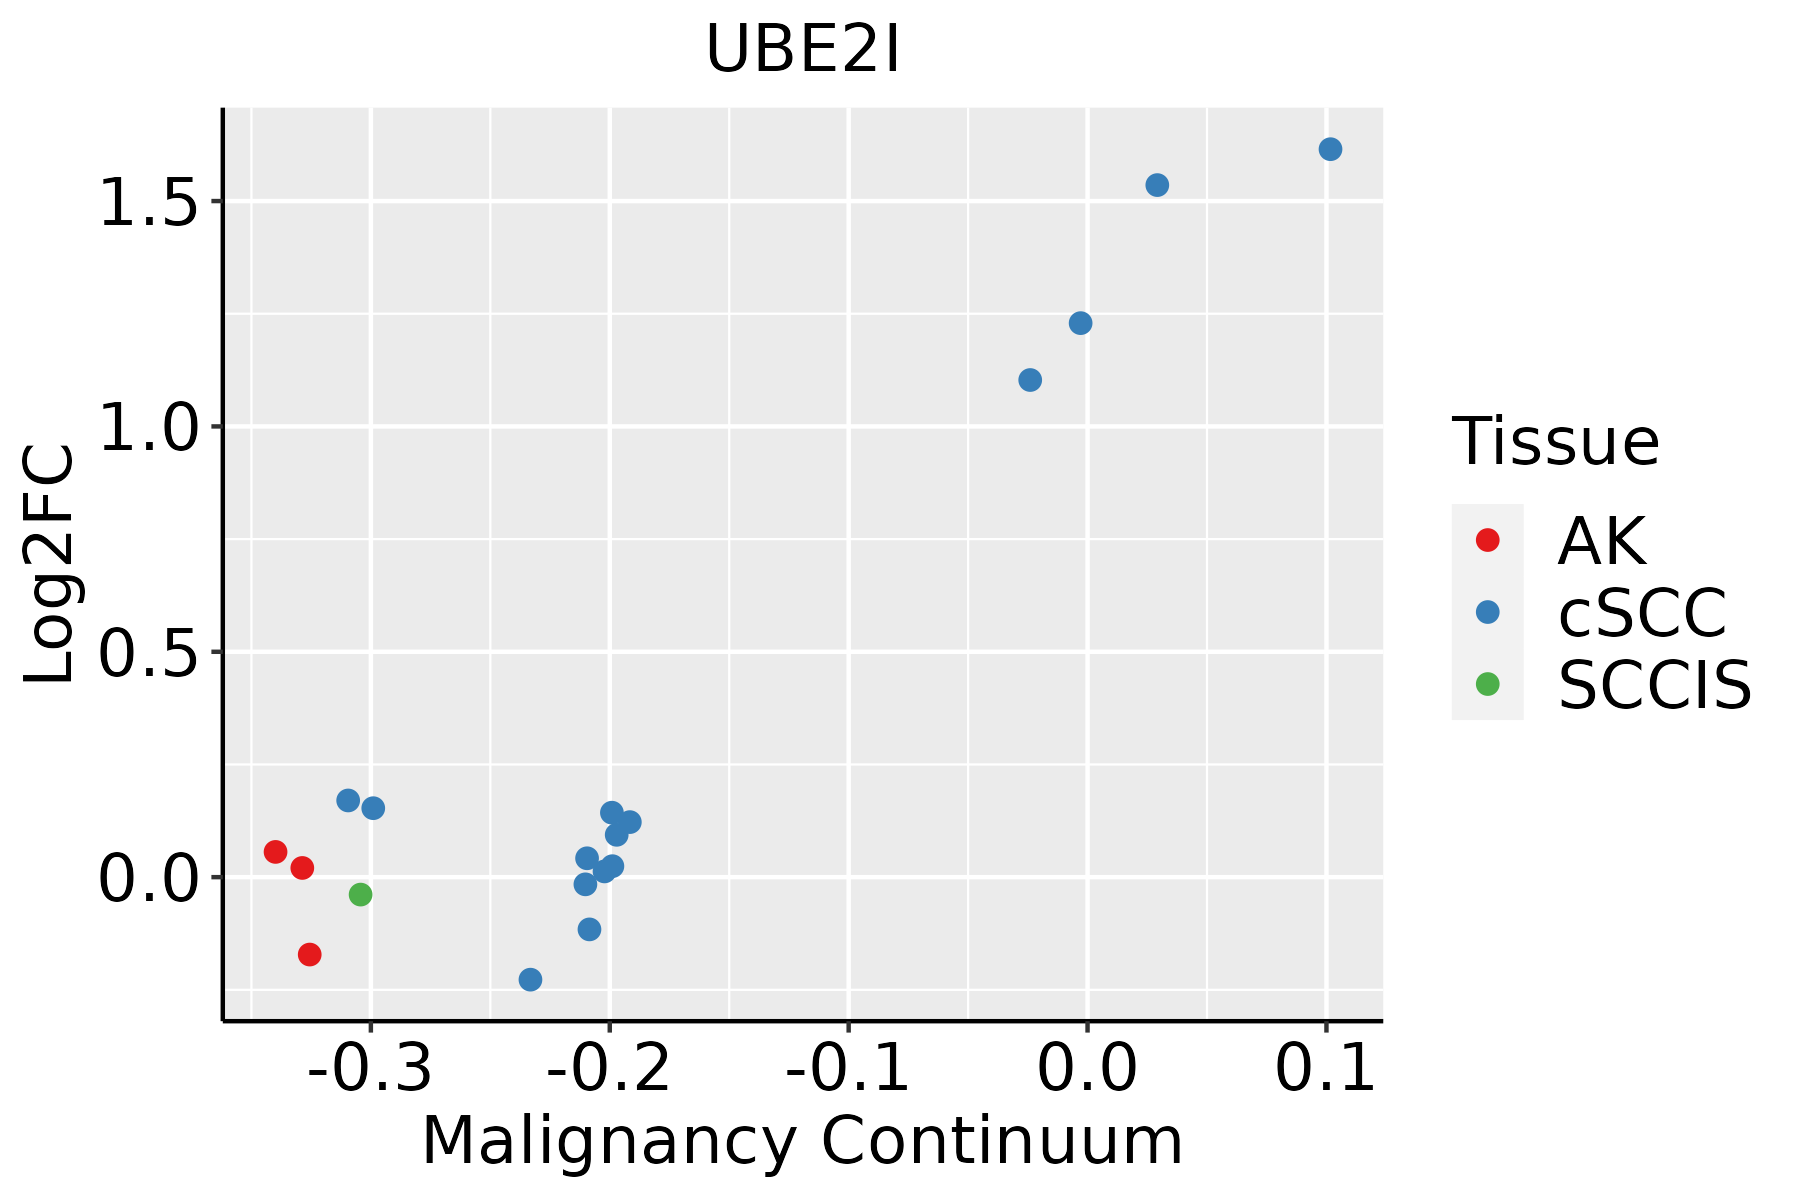 | AK: Actinic keratosis |
| cSCC: Cutaneous squamous cell carcinoma | ||
| SCCIS:squamous cell carcinoma in situ | ||
| Thyroid | 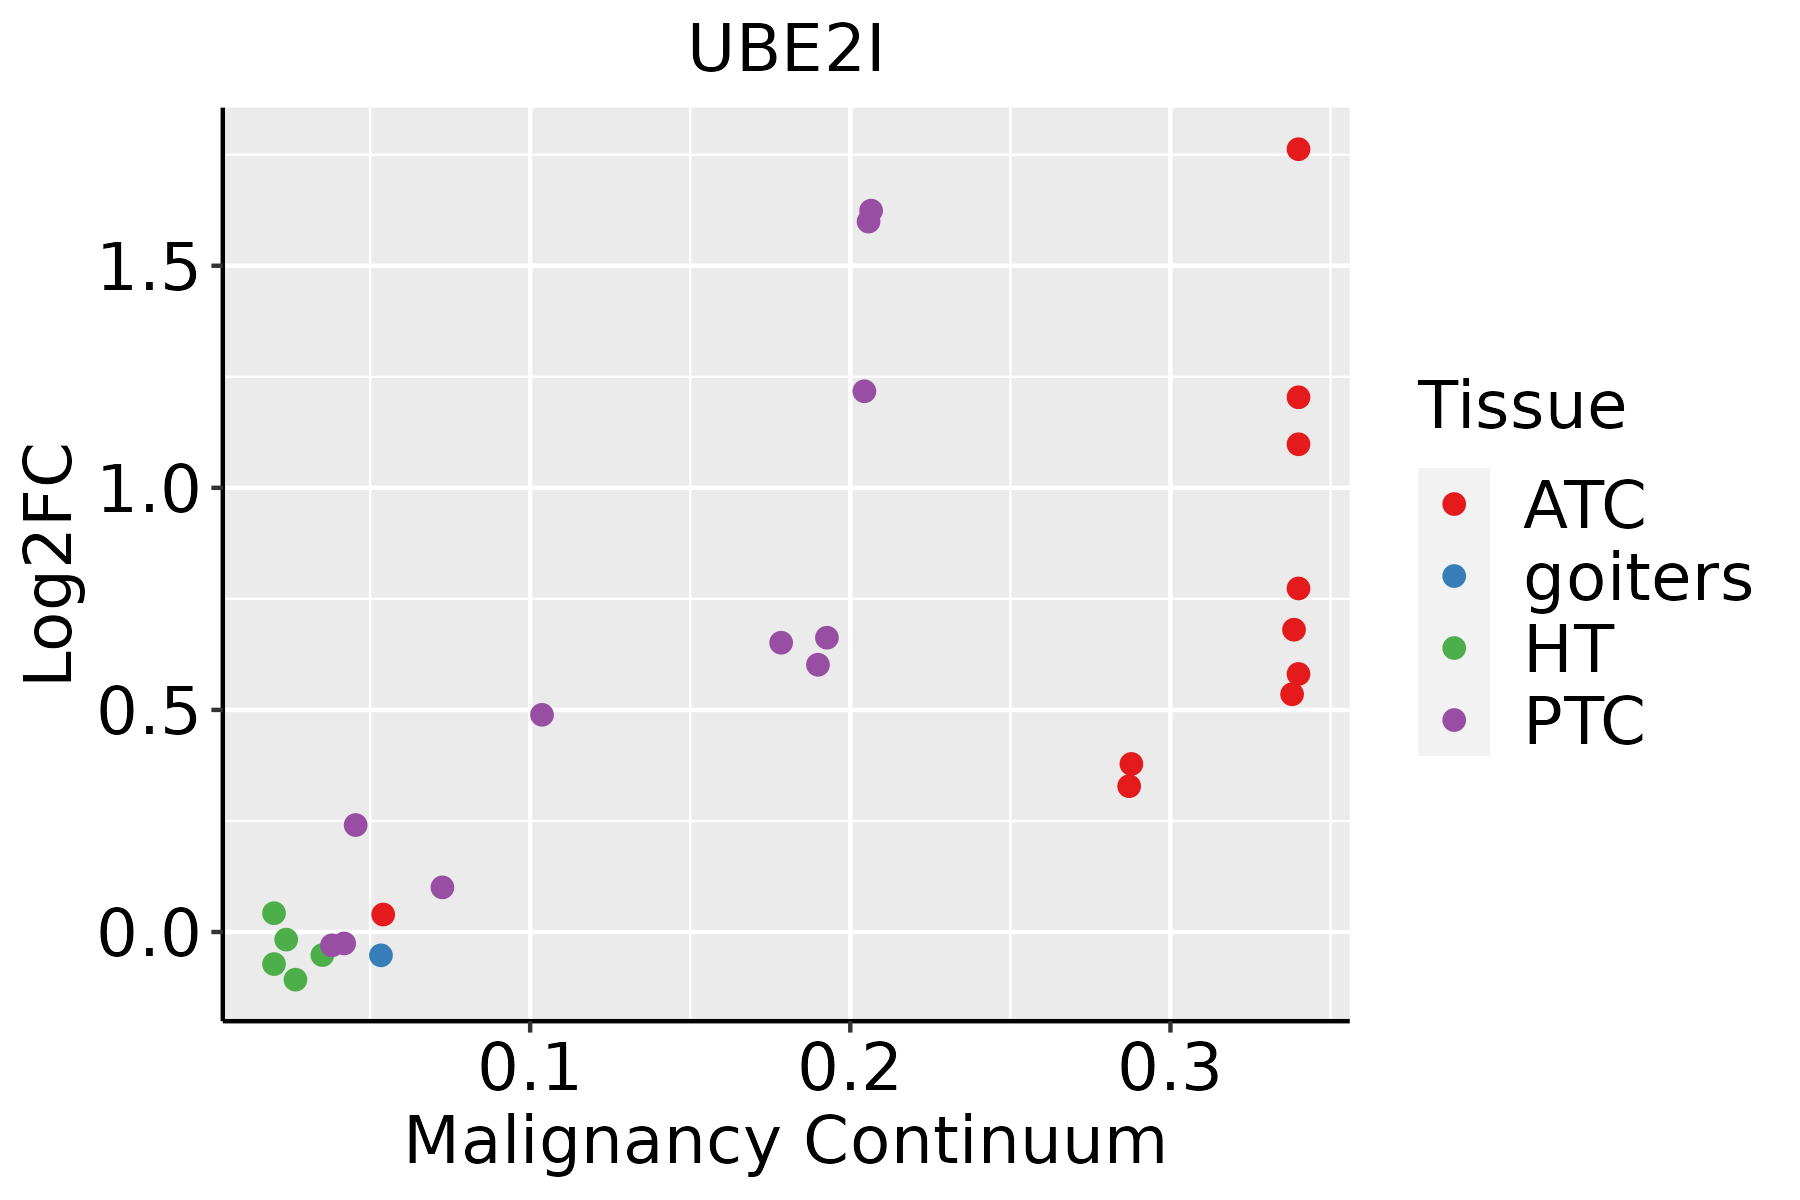 | ATC: Anaplastic thyroid cancer |
| HT: Hashimoto's thyroiditis | ||
| PTC: Papillary thyroid cancer |
| ∗log2FC in expression of this searched gene in stem-like cells from each diseased tissue sample relative to stem-like cells in normal samples in each tissue plotted against the malignancy continuum. Samples are colored based on if they are from different disease stage. |
Top |
Malignant transformation related pathway analysis |
| Find out the enriched GO biological processes and KEGG pathways involved in transition from healthy to precancer to cancer |
| Tissue | Disease Stage | Enriched GO biological Processes |
| Colorectum | AD |  |
| Colorectum | SER |  |
| Colorectum | MSS |  |
| Colorectum | MSI-H |  |
| Colorectum | FAP |  |
| ∗Top 15 enriched GO BP terms are showed in the bar plot of each disease state in each tissue. Each row represents a significant GO biological process which is colored according to the -log10(p.adjust). |
| Page: 1 2 3 4 5 6 7 8 9 |
| GO ID | Tissue | Disease Stage | Description | Gene Ratio | Bg Ratio | pvalue | p.adjust | Count |
| GO:1903320 | Colorectum | AD | regulation of protein modification by small protein conjugation or removal | 86/3918 | 242/18723 | 9.43e-08 | 4.65e-06 | 86 |
| GO:0043123 | Colorectum | AD | positive regulation of I-kappaB kinase/NF-kappaB signaling | 60/3918 | 186/18723 | 1.91e-04 | 2.56e-03 | 60 |
| GO:0071709 | Colorectum | AD | membrane assembly | 22/3918 | 50/18723 | 2.00e-04 | 2.66e-03 | 22 |
| GO:0043122 | Colorectum | AD | regulation of I-kappaB kinase/NF-kappaB signaling | 76/3918 | 249/18723 | 2.17e-04 | 2.85e-03 | 76 |
| GO:0007249 | Colorectum | AD | I-kappaB kinase/NF-kappaB signaling | 82/3918 | 281/18723 | 6.09e-04 | 6.40e-03 | 82 |
| GO:0044091 | Colorectum | AD | membrane biogenesis | 22/3918 | 55/18723 | 9.88e-04 | 9.28e-03 | 22 |
| GO:0140014 | Colorectum | AD | mitotic nuclear division | 78/3918 | 287/18723 | 6.48e-03 | 4.05e-02 | 78 |
| GO:19033202 | Colorectum | MSS | regulation of protein modification by small protein conjugation or removal | 82/3467 | 242/18723 | 7.49e-09 | 4.63e-07 | 82 |
| GO:00431221 | Colorectum | MSS | regulation of I-kappaB kinase/NF-kappaB signaling | 71/3467 | 249/18723 | 7.12e-05 | 1.21e-03 | 71 |
| GO:00072491 | Colorectum | MSS | I-kappaB kinase/NF-kappaB signaling | 77/3467 | 281/18723 | 1.51e-04 | 2.19e-03 | 77 |
| GO:00431231 | Colorectum | MSS | positive regulation of I-kappaB kinase/NF-kappaB signaling | 55/3467 | 186/18723 | 1.60e-04 | 2.29e-03 | 55 |
| GO:00717092 | Colorectum | MSS | membrane assembly | 19/3467 | 50/18723 | 9.61e-04 | 9.67e-03 | 19 |
| GO:00440912 | Colorectum | MSS | membrane biogenesis | 19/3467 | 55/18723 | 3.47e-03 | 2.59e-02 | 19 |
| GO:01400141 | Colorectum | MSS | mitotic nuclear division | 70/3467 | 287/18723 | 7.48e-03 | 4.72e-02 | 70 |
| GO:19033203 | Colorectum | MSI-H | regulation of protein modification by small protein conjugation or removal | 43/1319 | 242/18723 | 1.60e-08 | 1.85e-06 | 43 |
| GO:19033204 | Colorectum | FAP | regulation of protein modification by small protein conjugation or removal | 61/2622 | 242/18723 | 2.36e-06 | 9.21e-05 | 61 |
| GO:00431222 | Colorectum | FAP | regulation of I-kappaB kinase/NF-kappaB signaling | 56/2622 | 249/18723 | 1.82e-04 | 2.69e-03 | 56 |
| GO:00717093 | Colorectum | FAP | membrane assembly | 17/2622 | 50/18723 | 2.86e-04 | 3.77e-03 | 17 |
| GO:00440913 | Colorectum | FAP | membrane biogenesis | 17/2622 | 55/18723 | 9.95e-04 | 9.80e-03 | 17 |
| GO:00431232 | Colorectum | FAP | positive regulation of I-kappaB kinase/NF-kappaB signaling | 42/2622 | 186/18723 | 1.01e-03 | 9.89e-03 | 42 |
| Page: 1 2 3 4 5 6 7 8 9 10 |
| Pathway ID | Tissue | Disease Stage | Description | Gene Ratio | Bg Ratio | pvalue | p.adjust | qvalue | Count |
| hsa04120 | Colorectum | AD | Ubiquitin mediated proteolysis | 58/2092 | 142/8465 | 1.46e-05 | 1.53e-04 | 9.76e-05 | 58 |
| hsa041201 | Colorectum | AD | Ubiquitin mediated proteolysis | 58/2092 | 142/8465 | 1.46e-05 | 1.53e-04 | 9.76e-05 | 58 |
| hsa041204 | Colorectum | MSS | Ubiquitin mediated proteolysis | 55/1875 | 142/8465 | 5.02e-06 | 6.00e-05 | 3.68e-05 | 55 |
| hsa041205 | Colorectum | MSS | Ubiquitin mediated proteolysis | 55/1875 | 142/8465 | 5.02e-06 | 6.00e-05 | 3.68e-05 | 55 |
| hsa041206 | Colorectum | FAP | Ubiquitin mediated proteolysis | 51/1404 | 142/8465 | 1.55e-08 | 5.84e-07 | 3.55e-07 | 51 |
| hsa041207 | Colorectum | FAP | Ubiquitin mediated proteolysis | 51/1404 | 142/8465 | 1.55e-08 | 5.84e-07 | 3.55e-07 | 51 |
| hsa0412016 | Endometrium | AEH | Ubiquitin mediated proteolysis | 41/1197 | 142/8465 | 3.42e-06 | 4.27e-05 | 3.13e-05 | 41 |
| hsa0412017 | Endometrium | AEH | Ubiquitin mediated proteolysis | 41/1197 | 142/8465 | 3.42e-06 | 4.27e-05 | 3.13e-05 | 41 |
| hsa0412023 | Endometrium | EEC | Ubiquitin mediated proteolysis | 41/1237 | 142/8465 | 7.86e-06 | 9.58e-05 | 7.14e-05 | 41 |
| hsa0412033 | Endometrium | EEC | Ubiquitin mediated proteolysis | 41/1237 | 142/8465 | 7.86e-06 | 9.58e-05 | 7.14e-05 | 41 |
| hsa0412026 | Esophagus | HGIN | Ubiquitin mediated proteolysis | 49/1383 | 142/8465 | 7.78e-08 | 1.33e-06 | 1.06e-06 | 49 |
| hsa030137 | Esophagus | HGIN | Nucleocytoplasmic transport | 31/1383 | 108/8465 | 8.29e-04 | 7.95e-03 | 6.31e-03 | 31 |
| hsa04120111 | Esophagus | HGIN | Ubiquitin mediated proteolysis | 49/1383 | 142/8465 | 7.78e-08 | 1.33e-06 | 1.06e-06 | 49 |
| hsa0301312 | Esophagus | HGIN | Nucleocytoplasmic transport | 31/1383 | 108/8465 | 8.29e-04 | 7.95e-03 | 6.31e-03 | 31 |
| hsa0412027 | Esophagus | ESCC | Ubiquitin mediated proteolysis | 122/4205 | 142/8465 | 6.53e-20 | 7.29e-18 | 3.74e-18 | 122 |
| hsa0301321 | Esophagus | ESCC | Nucleocytoplasmic transport | 89/4205 | 108/8465 | 1.20e-12 | 2.37e-11 | 1.21e-11 | 89 |
| hsa040645 | Esophagus | ESCC | NF-kappa B signaling pathway | 67/4205 | 104/8465 | 1.62e-03 | 4.89e-03 | 2.50e-03 | 67 |
| hsa0412036 | Esophagus | ESCC | Ubiquitin mediated proteolysis | 122/4205 | 142/8465 | 6.53e-20 | 7.29e-18 | 3.74e-18 | 122 |
| hsa0301331 | Esophagus | ESCC | Nucleocytoplasmic transport | 89/4205 | 108/8465 | 1.20e-12 | 2.37e-11 | 1.21e-11 | 89 |
| hsa0406412 | Esophagus | ESCC | NF-kappa B signaling pathway | 67/4205 | 104/8465 | 1.62e-03 | 4.89e-03 | 2.50e-03 | 67 |
| Page: 1 2 |
Top |
Cell-cell communication analysis |
| Identification of potential cell-cell interactions between two cell types and their ligand-receptor pairs for different disease states |
| Ligand | Receptor | LRpair | Pathway | Tissue | Disease Stage |
| Page: 1 |
Top |
Single-cell gene regulatory network inference analysis |
| Find out the significant the regulons (TFs) and the target genes of each regulon across cell types for different disease states |
| TF | Cell Type | Tissue | Disease Stage | Target Gene | RSS | Regulon Activity |
| ∗The dot plots of a searched regulon are shown for all cell subpopulations in each disease state of each tissue based on the regulon specific score inferred using pySCENIC and by calculating the average expression. |
| Page: 1 |
Top |
Somatic mutation of malignant transformation related genes |
| Annotation of somatic variants for genes involved in malignant transformation |
| Hugo Symbol | Variant Class | Variant Classification | dbSNP RS | HGVSc | HGVSp | HGVSp Short | SWISSPROT | BIOTYPE | SIFT | PolyPhen | Tumor Sample Barcode | Tissue | Histology | Sex | Age | Stage | Therapy Types | Drugs | Outcome |
| UBE2I | SNV | Missense_Mutation | c.309G>C | p.Trp103Cys | p.W103C | P63279 | protein_coding | deleterious(0) | probably_damaging(0.991) | TCGA-C5-A2LX-01 | Cervix | cervical & endocervical cancer | Female | <65 | I/II | Chemotherapy | cisplatin | SD | |
| UBE2I | SNV | Missense_Mutation | novel | c.117N>A | p.Met39Ile | p.M39I | P63279 | protein_coding | deleterious(0.01) | benign(0.052) | TCGA-VS-A8EK-01 | Cervix | cervical & endocervical cancer | Female | >=65 | I/II | Chemotherapy | cisplatin | PD |
| UBE2I | SNV | Missense_Mutation | c.13N>A | p.Ala5Thr | p.A5T | P63279 | protein_coding | deleterious(0.03) | benign(0.146) | TCGA-AA-3672-01 | Colorectum | colon adenocarcinoma | Female | >=65 | III/IV | Unknown | Unknown | SD | |
| UBE2I | SNV | Missense_Mutation | novel | c.464N>G | p.Phe155Cys | p.F155C | P63279 | protein_coding | deleterious(0.05) | benign(0.007) | TCGA-AA-A010-01 | Colorectum | colon adenocarcinoma | Female | <65 | I/II | Chemotherapy | folinic | CR |
| UBE2I | SNV | Missense_Mutation | novel | c.469C>T | p.Pro157Ser | p.P157S | P63279 | protein_coding | deleterious(0.02) | benign(0) | TCGA-G4-6588-01 | Colorectum | colon adenocarcinoma | Female | <65 | I/II | Unknown | Unknown | SD |
| UBE2I | SNV | Missense_Mutation | c.247N>A | p.His83Asn | p.H83N | P63279 | protein_coding | deleterious(0) | probably_damaging(0.962) | TCGA-AG-A002-01 | Colorectum | rectum adenocarcinoma | Male | <65 | I/II | Unknown | Unknown | SD | |
| UBE2I | SNV | Missense_Mutation | novel | c.469C>T | p.Pro157Ser | p.P157S | P63279 | protein_coding | deleterious(0.02) | benign(0) | TCGA-AP-A1DK-01 | Endometrium | uterine corpus endometrioid carcinoma | Female | <65 | I/II | Unknown | Unknown | SD |
| UBE2I | SNV | Missense_Mutation | novel | c.263N>A | p.Pro88His | p.P88H | P63279 | protein_coding | deleterious(0) | probably_damaging(0.975) | TCGA-AX-A2HC-01 | Endometrium | uterine corpus endometrioid carcinoma | Female | <65 | III/IV | Chemotherapy | paclitaxel | PD |
| UBE2I | SNV | Missense_Mutation | novel | c.181N>T | p.Arg61Trp | p.R61W | P63279 | protein_coding | tolerated(0.07) | probably_damaging(0.98) | TCGA-AX-A2HD-01 | Endometrium | uterine corpus endometrioid carcinoma | Female | >=65 | III/IV | Unknown | Unknown | SD |
| UBE2I | SNV | Missense_Mutation | novel | c.88N>C | p.Lys30Gln | p.K30Q | P63279 | protein_coding | tolerated(0.1) | benign(0.321) | TCGA-E6-A1LX-01 | Endometrium | uterine corpus endometrioid carcinoma | Female | <65 | I/II | Unknown | Unknown | SD |
| Page: 1 2 |
Top |
Related drugs of malignant transformation related genes |
| Identification of chemicals and drugs interact with genes involved in malignant transfromation |
| (DGIdb 4.0) |
| Entrez ID | Symbol | Category | Interaction Types | Drug Claim Name | Drug Name | PMIDs |
| 7329 | UBE2I | TRANSCRIPTION FACTOR BINDING, ENZYME | cisplatin | CISPLATIN | 19859084 | |
| 7329 | UBE2I | TRANSCRIPTION FACTOR BINDING, ENZYME | irinotecan | IRINOTECAN | 19859084 |
| Page: 1 |

Copyright 2023-Present -The University of Texas Health Science Center at Houston |