
|
|||||
|
 | |
| |
| |
| |
| |
| |
|
Gene: TMEM57 |
Gene summary for TMEM57 |
| Gene information | Species | Human | Gene symbol | TMEM57 | Gene ID | 55219 |
| Gene name | macoilin 1 | |
| Gene Alias | MACOILIN | |
| Cytomap | 1p36.11 | |
| Gene Type | protein-coding | GO ID | GO:0006935 | UniProtAcc | Q8N5G2 |
Top |
Malignant transformation analysis |
| Identification of the aberrant gene expression in precancerous and cancerous lesions by comparing the gene expression of stem-like cells in diseased tissues with normal stem cells |
| Entrez ID | Symbol | Replicates | Species | Organ | Tissue | Adj P-value | Log2FC | Malignancy |
| 55219 | TMEM57 | GSM5353236_PA_PR5251_T1_S7_L001 | Human | Prostate | Tumor | 5.58e-07 | 5.27e-01 | 0.1608 |
| 55219 | TMEM57 | GSM5353237_PA_PR5251_T2_S8_L001 | Human | Prostate | Tumor | 1.14e-06 | 5.41e-01 | 0.1622 |
| 55219 | TMEM57 | GSM5353240_PA_PR5254_T1_S15_L001 | Human | Prostate | Tumor | 8.40e-07 | 3.30e-01 | 0.1575 |
| 55219 | TMEM57 | GSM5353243_PA_PR5261_T1_S23_L002 | Human | Prostate | Tumor | 1.66e-03 | 2.51e-01 | 0.1545 |
| 55219 | TMEM57 | GSM5353244_PA_PR5261_T2_S24_L002 | Human | Prostate | Tumor | 1.34e-03 | 3.07e-01 | 0.1569 |
| Page: 1 2 3 4 5 6 |
| Tissue | Expression Dynamics | Abbreviation |
| Colorectum (GSE201348) |  | FAP: Familial adenomatous polyposis |
| CRC: Colorectal cancer | ||
| Colorectum (HTA11) |  | AD: Adenomas |
| SER: Sessile serrated lesions | ||
| MSI-H: Microsatellite-high colorectal cancer | ||
| MSS: Microsatellite stable colorectal cancer | ||
| Esophagus | 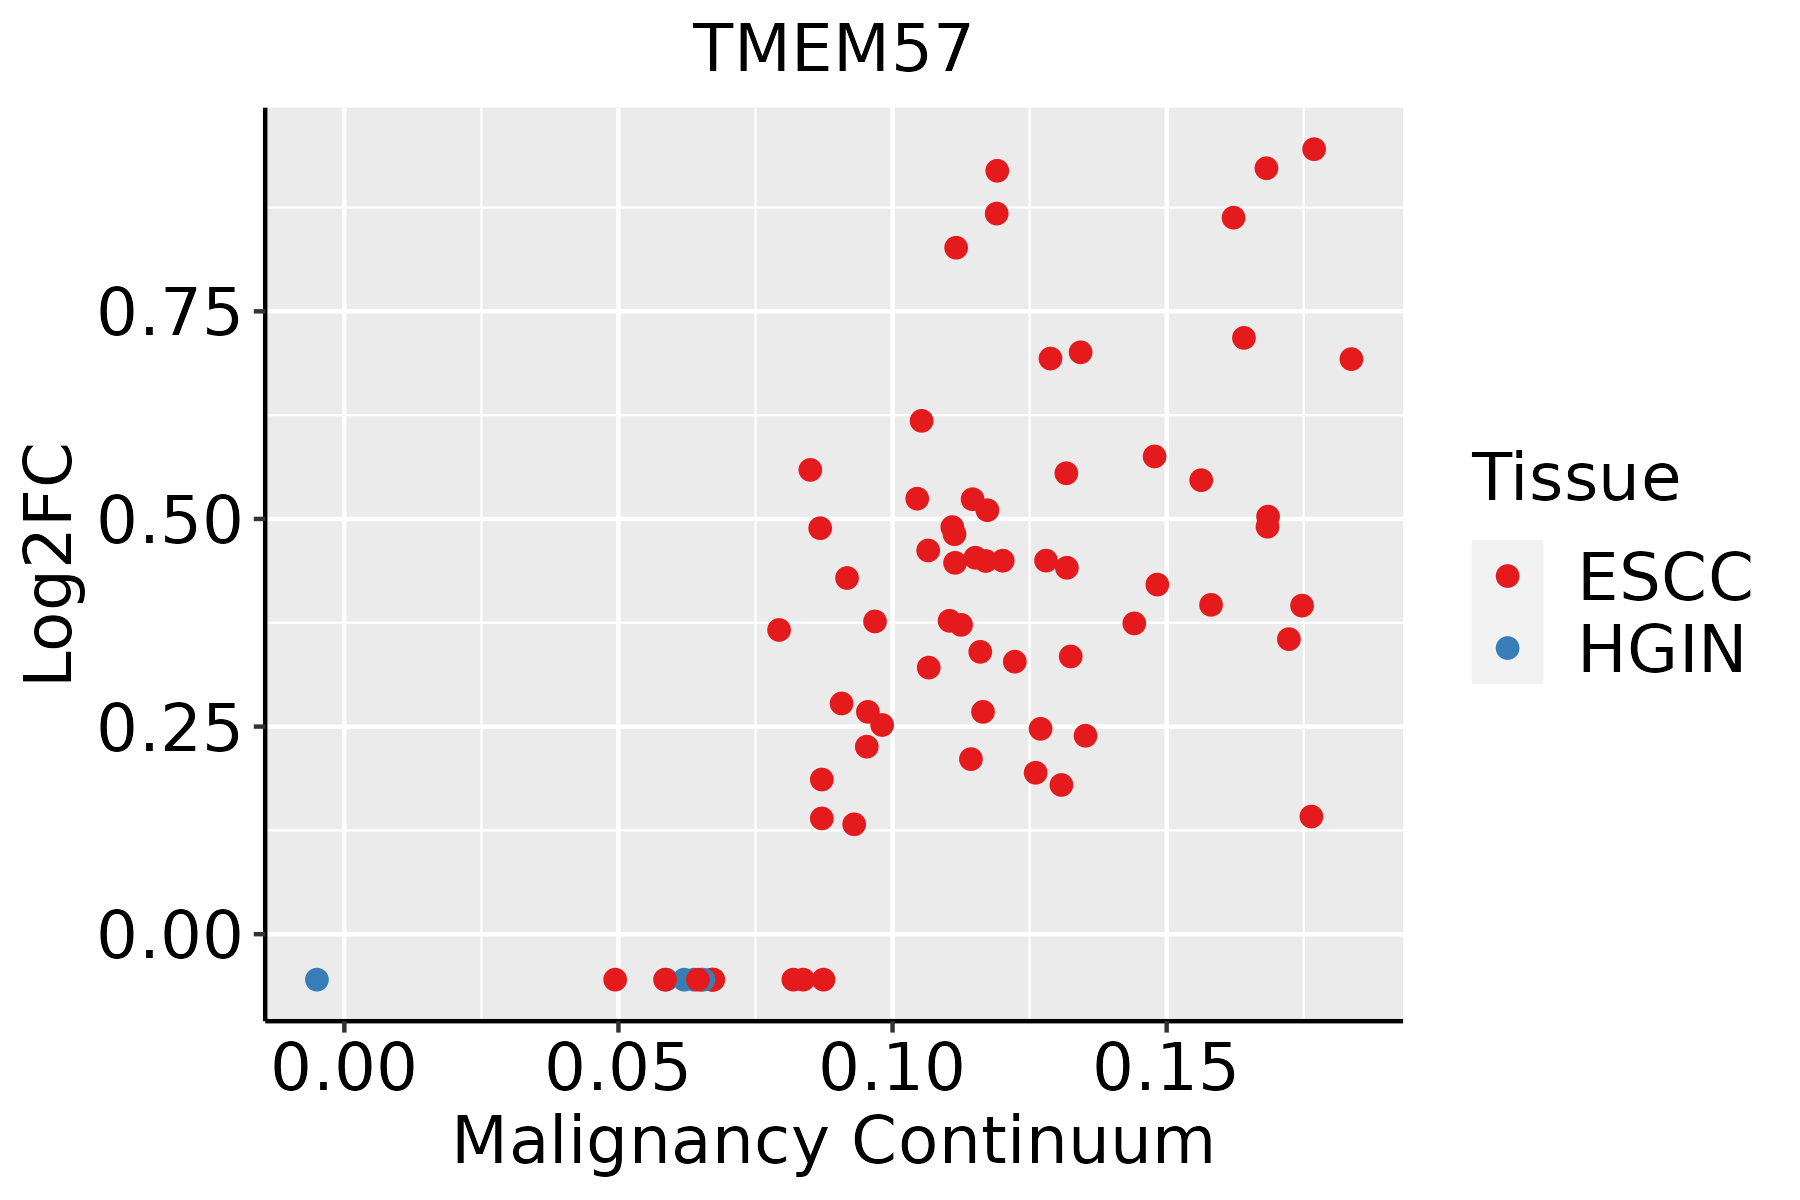 | ESCC: Esophageal squamous cell carcinoma |
| HGIN: High-grade intraepithelial neoplasias | ||
| LGIN: Low-grade intraepithelial neoplasias | ||
| Liver | 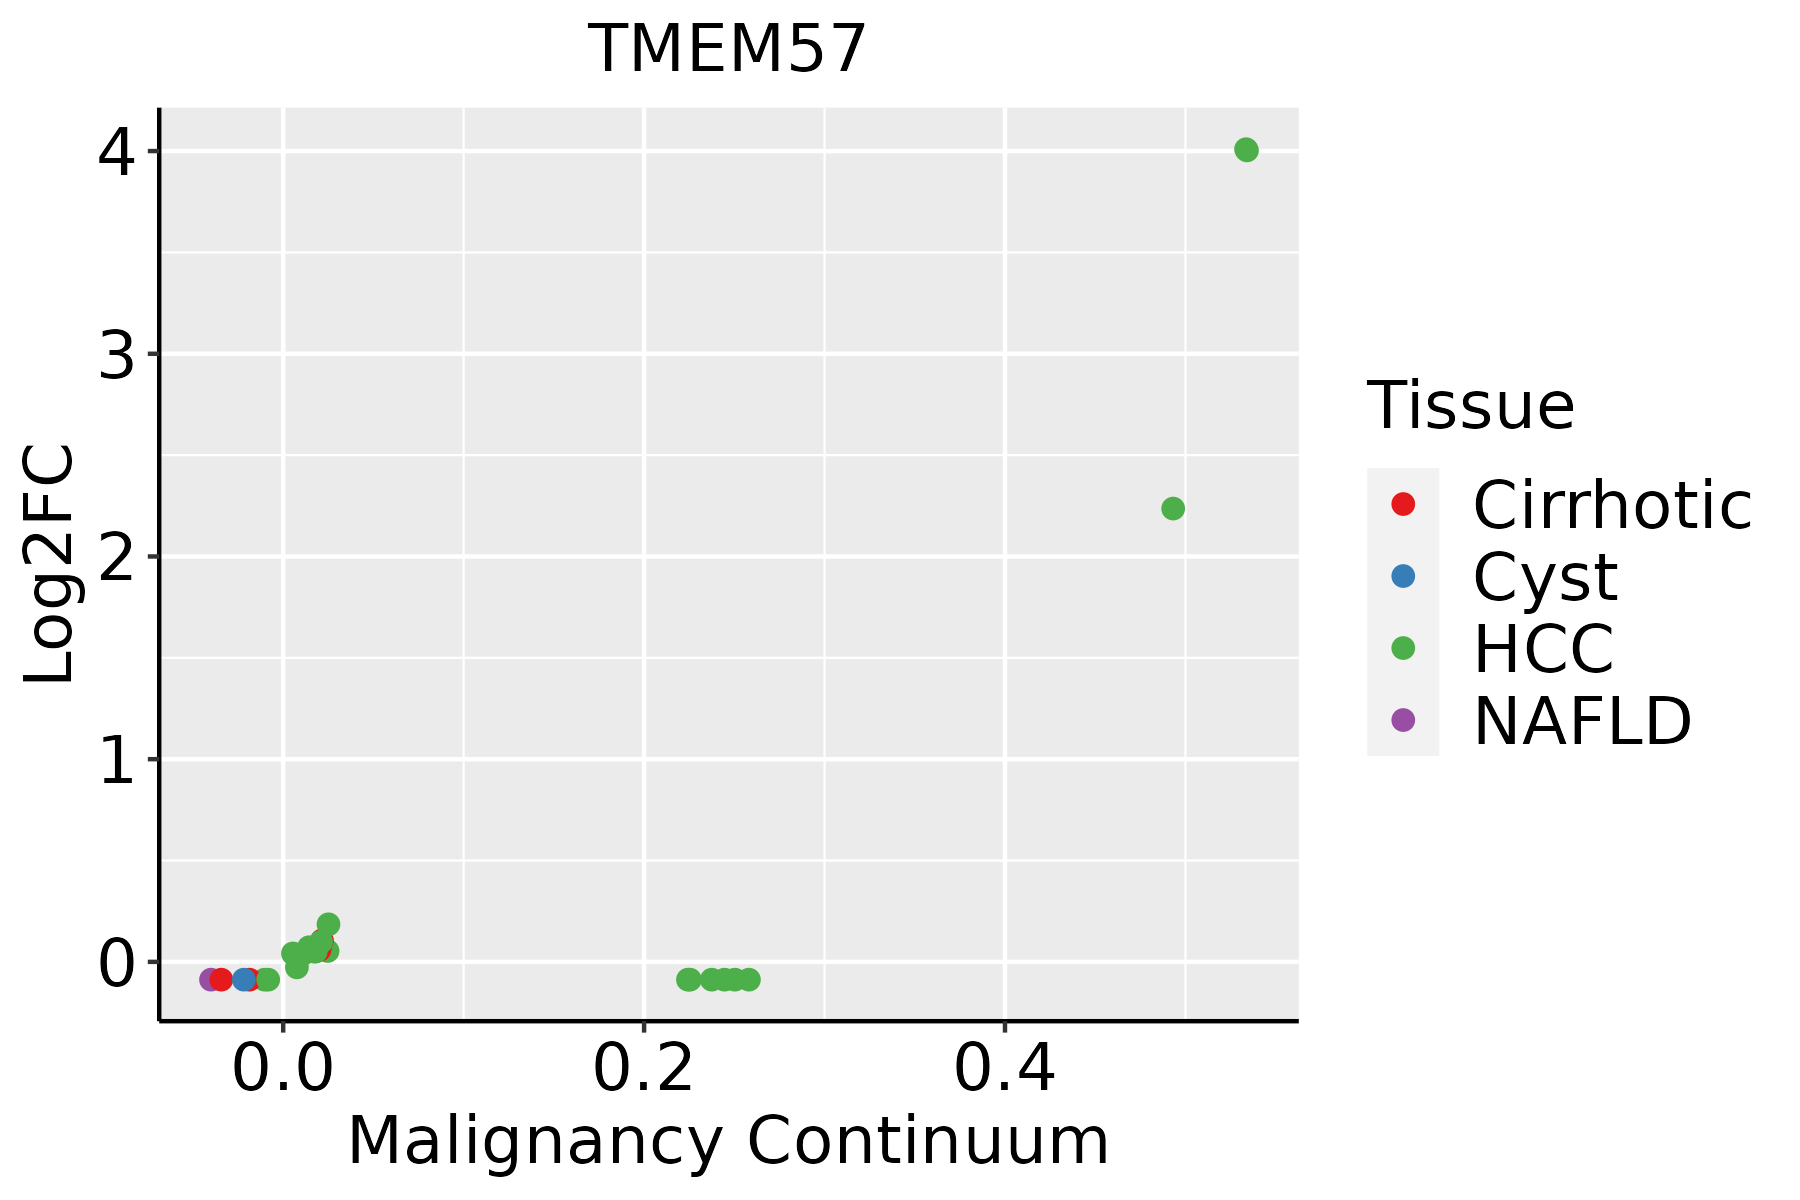 | HCC: Hepatocellular carcinoma |
| NAFLD: Non-alcoholic fatty liver disease | ||
| Oral Cavity | 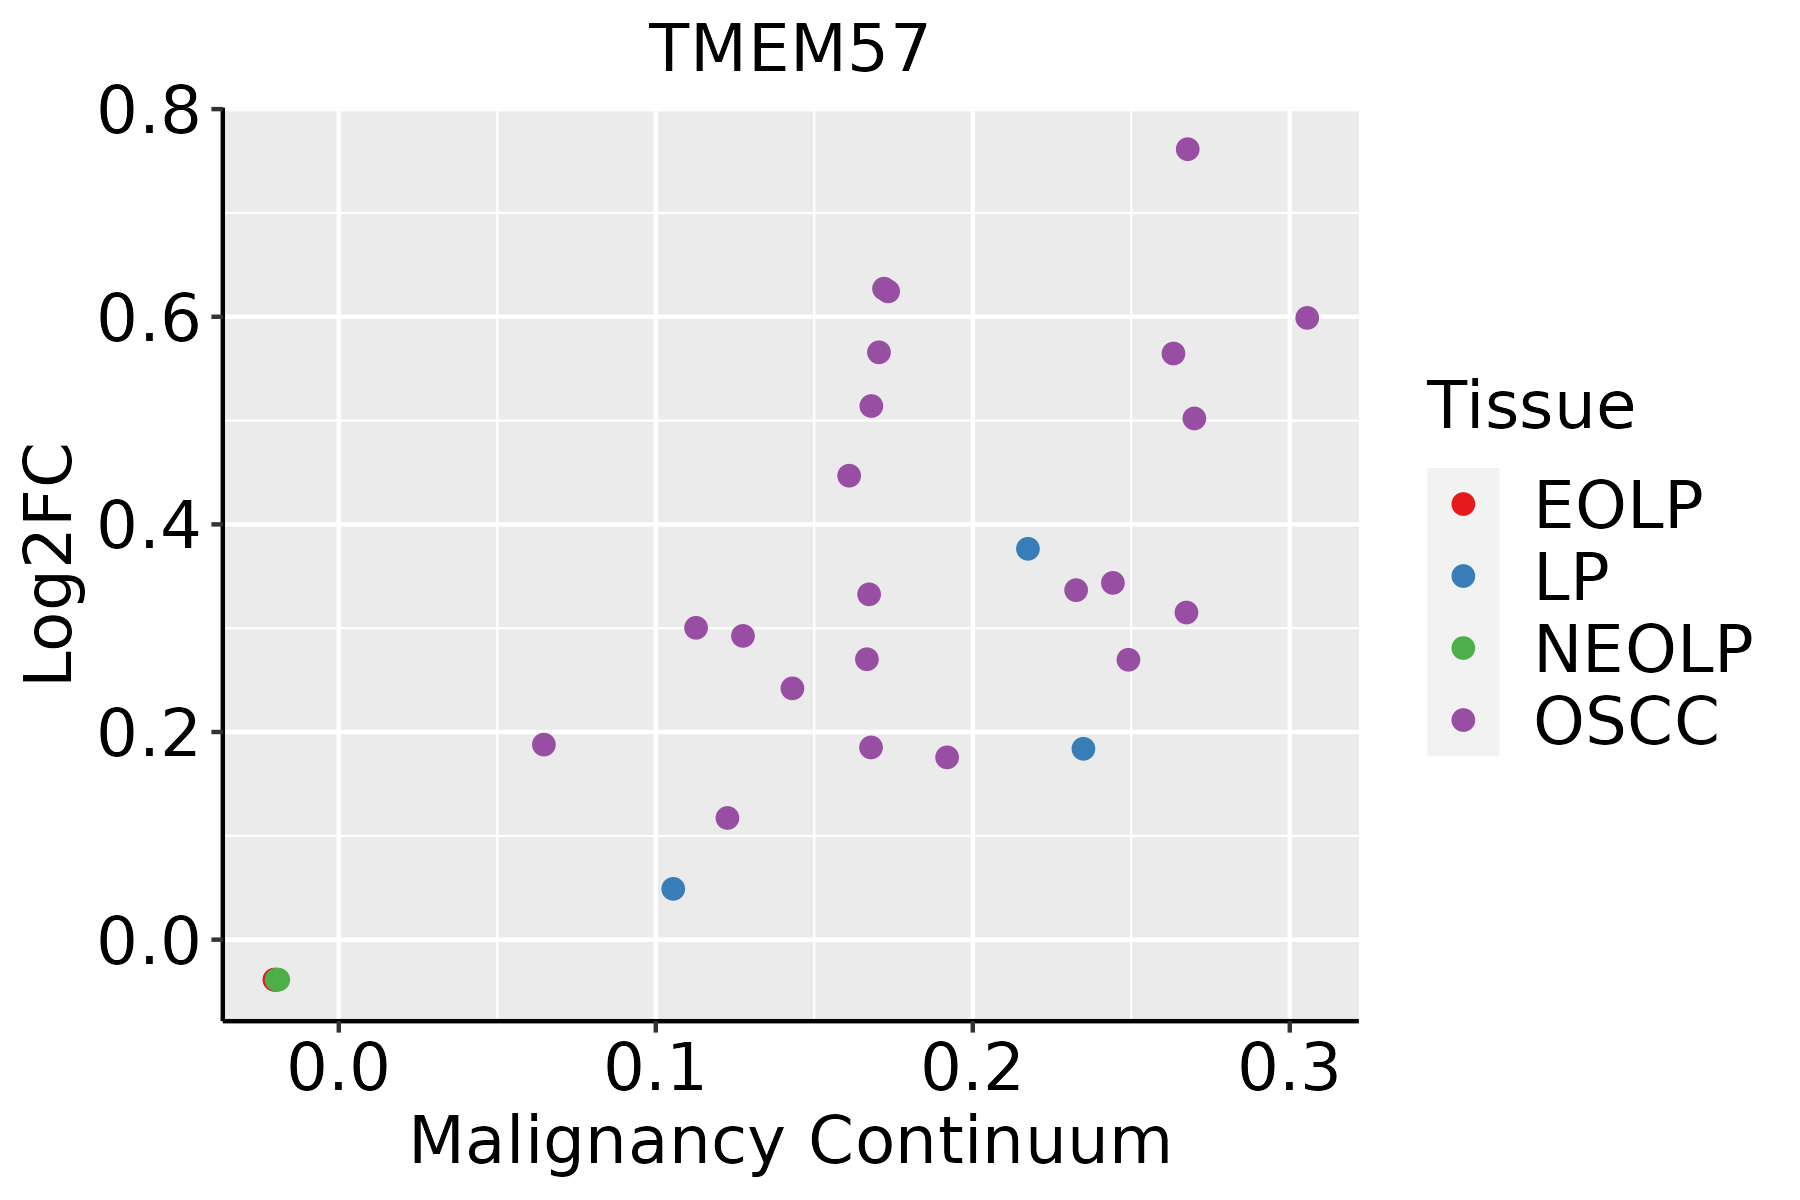 | EOLP: Erosive Oral lichen planus |
| LP: leukoplakia | ||
| NEOLP: Non-erosive oral lichen planus | ||
| OSCC: Oral squamous cell carcinoma | ||
| Prostate |  | BPH: Benign Prostatic Hyperplasia |
| ∗log2FC in expression of this searched gene in stem-like cells from each diseased tissue sample relative to stem-like cells in normal samples in each tissue plotted against the malignancy continuum. Samples are colored based on if they are from different disease stage. |
Top |
Malignant transformation related pathway analysis |
| Find out the enriched GO biological processes and KEGG pathways involved in transition from healthy to precancer to cancer |
| Tissue | Disease Stage | Enriched GO biological Processes |
| Colorectum | AD |  |
| Colorectum | SER |  |
| Colorectum | MSS |  |
| Colorectum | MSI-H |  |
| Colorectum | FAP |  |
| ∗Top 15 enriched GO BP terms are showed in the bar plot of each disease state in each tissue. Each row represents a significant GO biological process which is colored according to the -log10(p.adjust). |
| Page: 1 2 3 4 5 6 7 8 9 |
| GO ID | Tissue | Disease Stage | Description | Gene Ratio | Bg Ratio | pvalue | p.adjust | Count |
| Page: 1 |
| Pathway ID | Tissue | Disease Stage | Description | Gene Ratio | Bg Ratio | pvalue | p.adjust | qvalue | Count |
| Page: 1 |
Top |
Cell-cell communication analysis |
| Identification of potential cell-cell interactions between two cell types and their ligand-receptor pairs for different disease states |
| Ligand | Receptor | LRpair | Pathway | Tissue | Disease Stage |
| Page: 1 |
Top |
Single-cell gene regulatory network inference analysis |
| Find out the significant the regulons (TFs) and the target genes of each regulon across cell types for different disease states |
| TF | Cell Type | Tissue | Disease Stage | Target Gene | RSS | Regulon Activity |
| ∗The dot plots of a searched regulon are shown for all cell subpopulations in each disease state of each tissue based on the regulon specific score inferred using pySCENIC and by calculating the average expression. |
| Page: 1 |
Top |
Somatic mutation of malignant transformation related genes |
| Annotation of somatic variants for genes involved in malignant transformation |
| Hugo Symbol | Variant Class | Variant Classification | dbSNP RS | HGVSc | HGVSp | HGVSp Short | SWISSPROT | BIOTYPE | SIFT | PolyPhen | Tumor Sample Barcode | Tissue | Histology | Sex | Age | Stage | Therapy Types | Drugs | Outcome |
| TMEM57 | SNV | Missense_Mutation | novel | c.1085N>A | p.Ser362Asn | p.S362N | Q8N5G2 | protein_coding | tolerated(0.49) | benign(0) | TCGA-A7-A0CD-01 | Breast | breast invasive carcinoma | Female | >=65 | I/II | Hormone Therapy | arimidex | SD |
| TMEM57 | SNV | Missense_Mutation | novel | c.455G>T | p.Arg152Leu | p.R152L | Q8N5G2 | protein_coding | deleterious(0) | possibly_damaging(0.719) | TCGA-A7-A0DB-01 | Breast | breast invasive carcinoma | Female | <65 | I/II | Hormone Therapy | arimidex | SD |
| TMEM57 | SNV | Missense_Mutation | c.1244C>T | p.Ser415Leu | p.S415L | Q8N5G2 | protein_coding | tolerated(0.82) | benign(0.024) | TCGA-AC-A23H-01 | Breast | breast invasive carcinoma | Female | >=65 | I/II | Unknown | Unknown | PD | |
| TMEM57 | SNV | Missense_Mutation | c.1510G>A | p.Glu504Lys | p.E504K | Q8N5G2 | protein_coding | deleterious(0.01) | benign(0.146) | TCGA-AN-A046-01 | Breast | breast invasive carcinoma | Female | >=65 | I/II | Unknown | Unknown | SD | |
| TMEM57 | SNV | Missense_Mutation | novel | c.1846G>A | p.Glu616Lys | p.E616K | Q8N5G2 | protein_coding | deleterious(0.01) | probably_damaging(0.999) | TCGA-AN-A046-01 | Breast | breast invasive carcinoma | Female | >=65 | I/II | Unknown | Unknown | SD |
| TMEM57 | SNV | Missense_Mutation | c.1256N>T | p.Arg419Leu | p.R419L | Q8N5G2 | protein_coding | deleterious(0.04) | probably_damaging(0.98) | TCGA-AN-A0AT-01 | Breast | breast invasive carcinoma | Female | <65 | I/II | Unknown | Unknown | SD | |
| TMEM57 | SNV | Missense_Mutation | c.1831N>G | p.Lys611Glu | p.K611E | Q8N5G2 | protein_coding | deleterious(0.04) | probably_damaging(0.998) | TCGA-AO-A03R-01 | Breast | breast invasive carcinoma | Female | <65 | I/II | Chemotherapy | doxorubicin | SD | |
| TMEM57 | SNV | Missense_Mutation | c.484N>T | p.Pro162Ser | p.P162S | Q8N5G2 | protein_coding | deleterious(0.04) | probably_damaging(0.961) | TCGA-AQ-A04H-01 | Breast | breast invasive carcinoma | Female | <65 | III/IV | Chemotherapy | taxotere | SD | |
| TMEM57 | SNV | Missense_Mutation | c.838N>C | p.Asp280His | p.D280H | Q8N5G2 | protein_coding | deleterious(0.04) | probably_damaging(0.983) | TCGA-B6-A0RT-01 | Breast | breast invasive carcinoma | Female | <65 | III/IV | Unknown | Unknown | SD | |
| TMEM57 | SNV | Missense_Mutation | c.277C>A | p.Leu93Met | p.L93M | Q8N5G2 | protein_coding | deleterious(0.02) | possibly_damaging(0.897) | TCGA-BH-A18G-01 | Breast | breast invasive carcinoma | Female | >=65 | I/II | Unknown | Unknown | SD |
| Page: 1 2 3 4 5 6 7 8 |
Top |
Related drugs of malignant transformation related genes |
| Identification of chemicals and drugs interact with genes involved in malignant transfromation |
| (DGIdb 4.0) |
| Entrez ID | Symbol | Category | Interaction Types | Drug Claim Name | Drug Name | PMIDs |
| Page: 1 |

Copyright 2023-Present -The University of Texas Health Science Center at Houston |