
|
|||||
|
 | |
| |
| |
| |
| |
| |
|
Gene: TMEM223 |
Gene summary for TMEM223 |
| Gene information | Species | Human | Gene symbol | TMEM223 | Gene ID | 79064 |
| Gene name | transmembrane protein 223 | |
| Gene Alias | TMEM223 | |
| Cytomap | 11q12.3 | |
| Gene Type | protein-coding | GO ID | GO:0007275 | UniProtAcc | A0PJW6 |
Top |
Malignant transformation analysis |
| Identification of the aberrant gene expression in precancerous and cancerous lesions by comparing the gene expression of stem-like cells in diseased tissues with normal stem cells |
| Entrez ID | Symbol | Replicates | Species | Organ | Tissue | Adj P-value | Log2FC | Malignancy |
| 79064 | TMEM223 | SYSMH4 | Human | Oral cavity | OSCC | 1.66e-09 | 1.38e-01 | 0.1226 |
| 79064 | TMEM223 | SYSMH5 | Human | Oral cavity | OSCC | 7.55e-16 | 4.71e-01 | 0.0647 |
| 79064 | TMEM223 | SYSMH6 | Human | Oral cavity | OSCC | 1.80e-13 | 4.19e-01 | 0.1275 |
| 79064 | TMEM223 | P4_S8_cSCC | Human | Skin | cSCC | 5.51e-07 | 1.43e-01 | -0.3095 |
| 79064 | TMEM223 | P5_S10_cSCC | Human | Skin | cSCC | 3.79e-03 | 1.02e-01 | -0.299 |
| 79064 | TMEM223 | P1_cSCC | Human | Skin | cSCC | 1.57e-05 | 3.43e-01 | 0.0292 |
| 79064 | TMEM223 | P2_cSCC | Human | Skin | cSCC | 5.32e-07 | 2.84e-01 | -0.024 |
| 79064 | TMEM223 | P4_cSCC | Human | Skin | cSCC | 3.53e-08 | 2.69e-01 | -0.00290000000000005 |
| 79064 | TMEM223 | P10_cSCC | Human | Skin | cSCC | 1.64e-18 | 5.10e-01 | 0.1017 |
| 79064 | TMEM223 | male-WTA | Human | Thyroid | PTC | 2.31e-16 | 1.54e-01 | 0.1037 |
| 79064 | TMEM223 | PTC01 | Human | Thyroid | PTC | 1.45e-16 | 2.59e-01 | 0.1899 |
| 79064 | TMEM223 | PTC04 | Human | Thyroid | PTC | 1.40e-08 | 1.56e-01 | 0.1927 |
| 79064 | TMEM223 | PTC05 | Human | Thyroid | PTC | 1.32e-10 | 3.96e-01 | 0.2065 |
| 79064 | TMEM223 | PTC06 | Human | Thyroid | PTC | 1.61e-17 | 4.16e-01 | 0.2057 |
| 79064 | TMEM223 | PTC07 | Human | Thyroid | PTC | 1.81e-20 | 4.60e-01 | 0.2044 |
| 79064 | TMEM223 | ATC09 | Human | Thyroid | ATC | 3.24e-06 | 3.96e-01 | 0.2871 |
| 79064 | TMEM223 | ATC12 | Human | Thyroid | ATC | 8.75e-26 | 4.45e-01 | 0.34 |
| 79064 | TMEM223 | ATC13 | Human | Thyroid | ATC | 1.12e-26 | 5.03e-01 | 0.34 |
| 79064 | TMEM223 | ATC1 | Human | Thyroid | ATC | 1.59e-06 | 4.86e-01 | 0.2878 |
| 79064 | TMEM223 | ATC2 | Human | Thyroid | ATC | 1.54e-08 | 5.70e-01 | 0.34 |
| Page: 1 2 3 4 5 6 7 |
| Tissue | Expression Dynamics | Abbreviation |
| Esophagus | 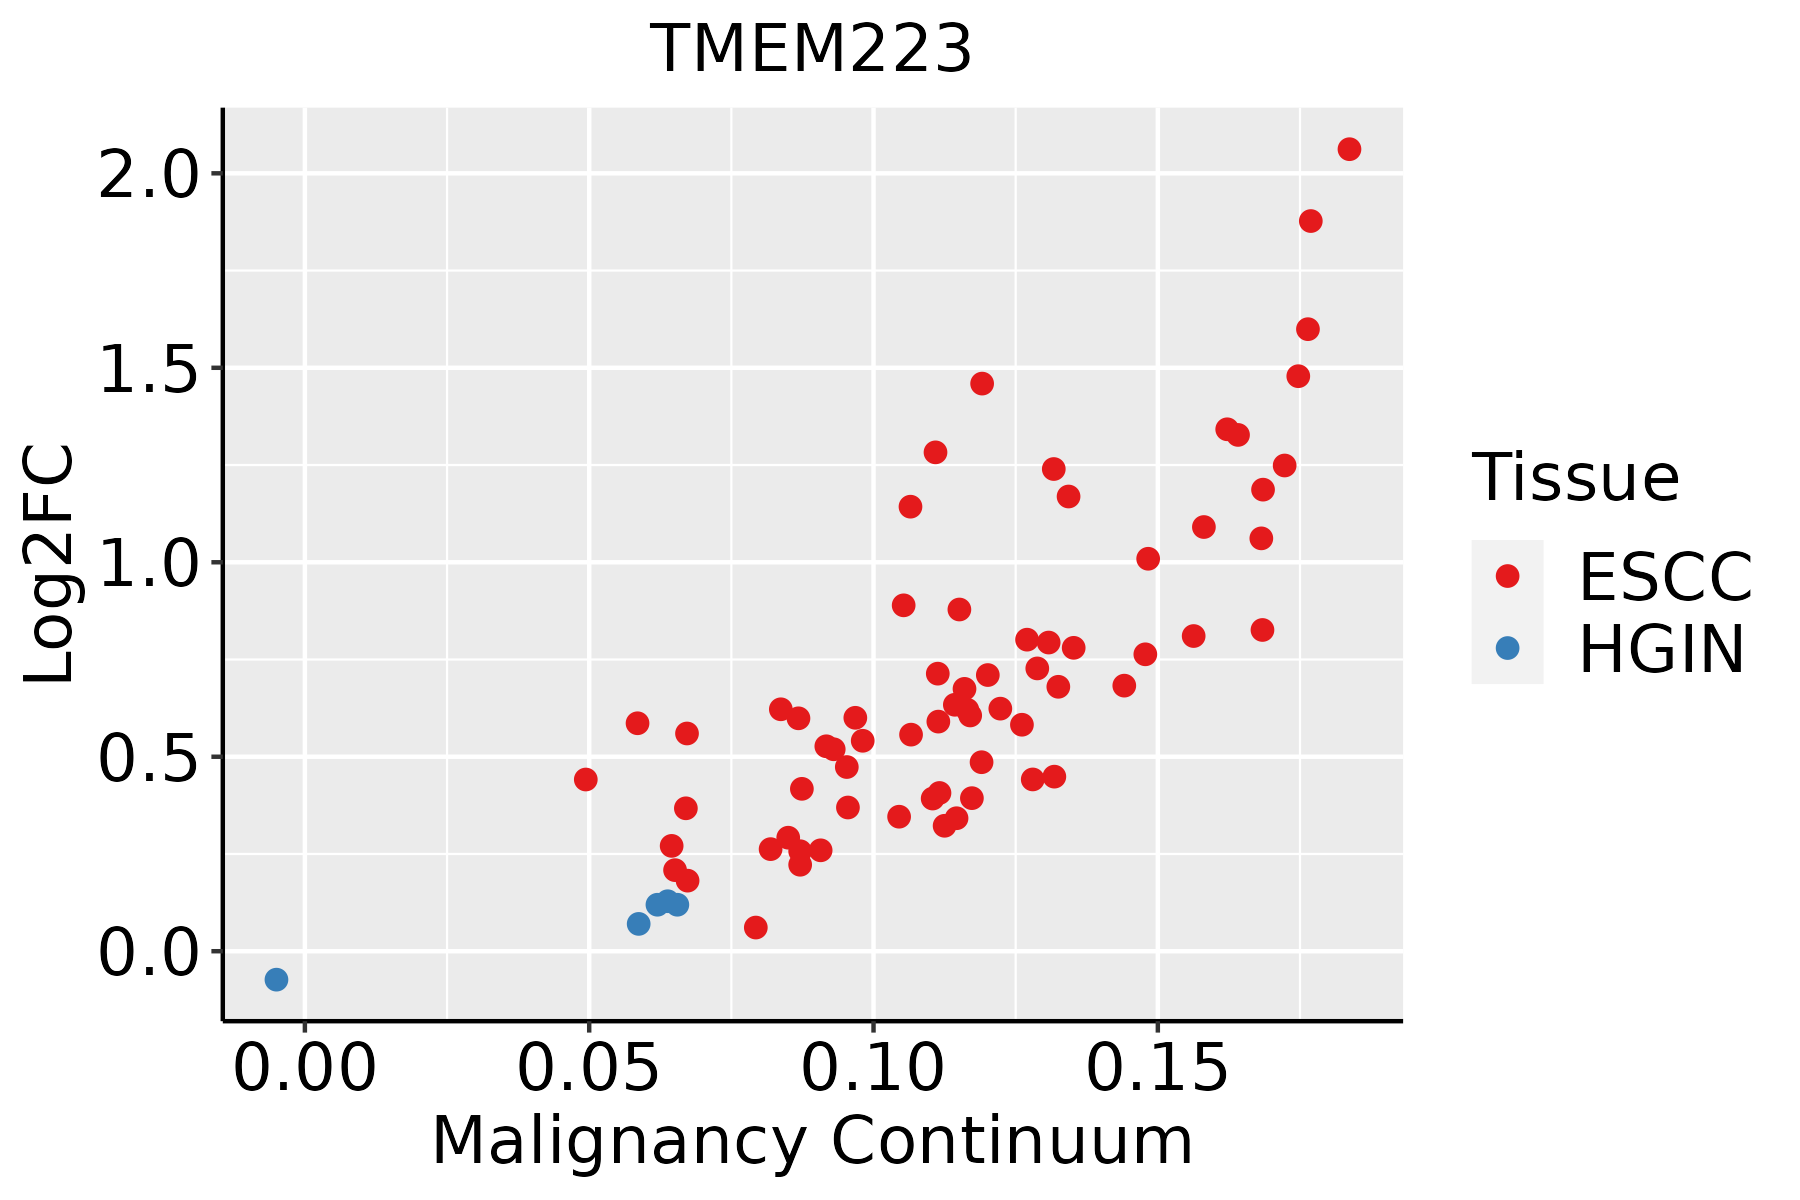 | ESCC: Esophageal squamous cell carcinoma |
| HGIN: High-grade intraepithelial neoplasias | ||
| LGIN: Low-grade intraepithelial neoplasias | ||
| Liver | 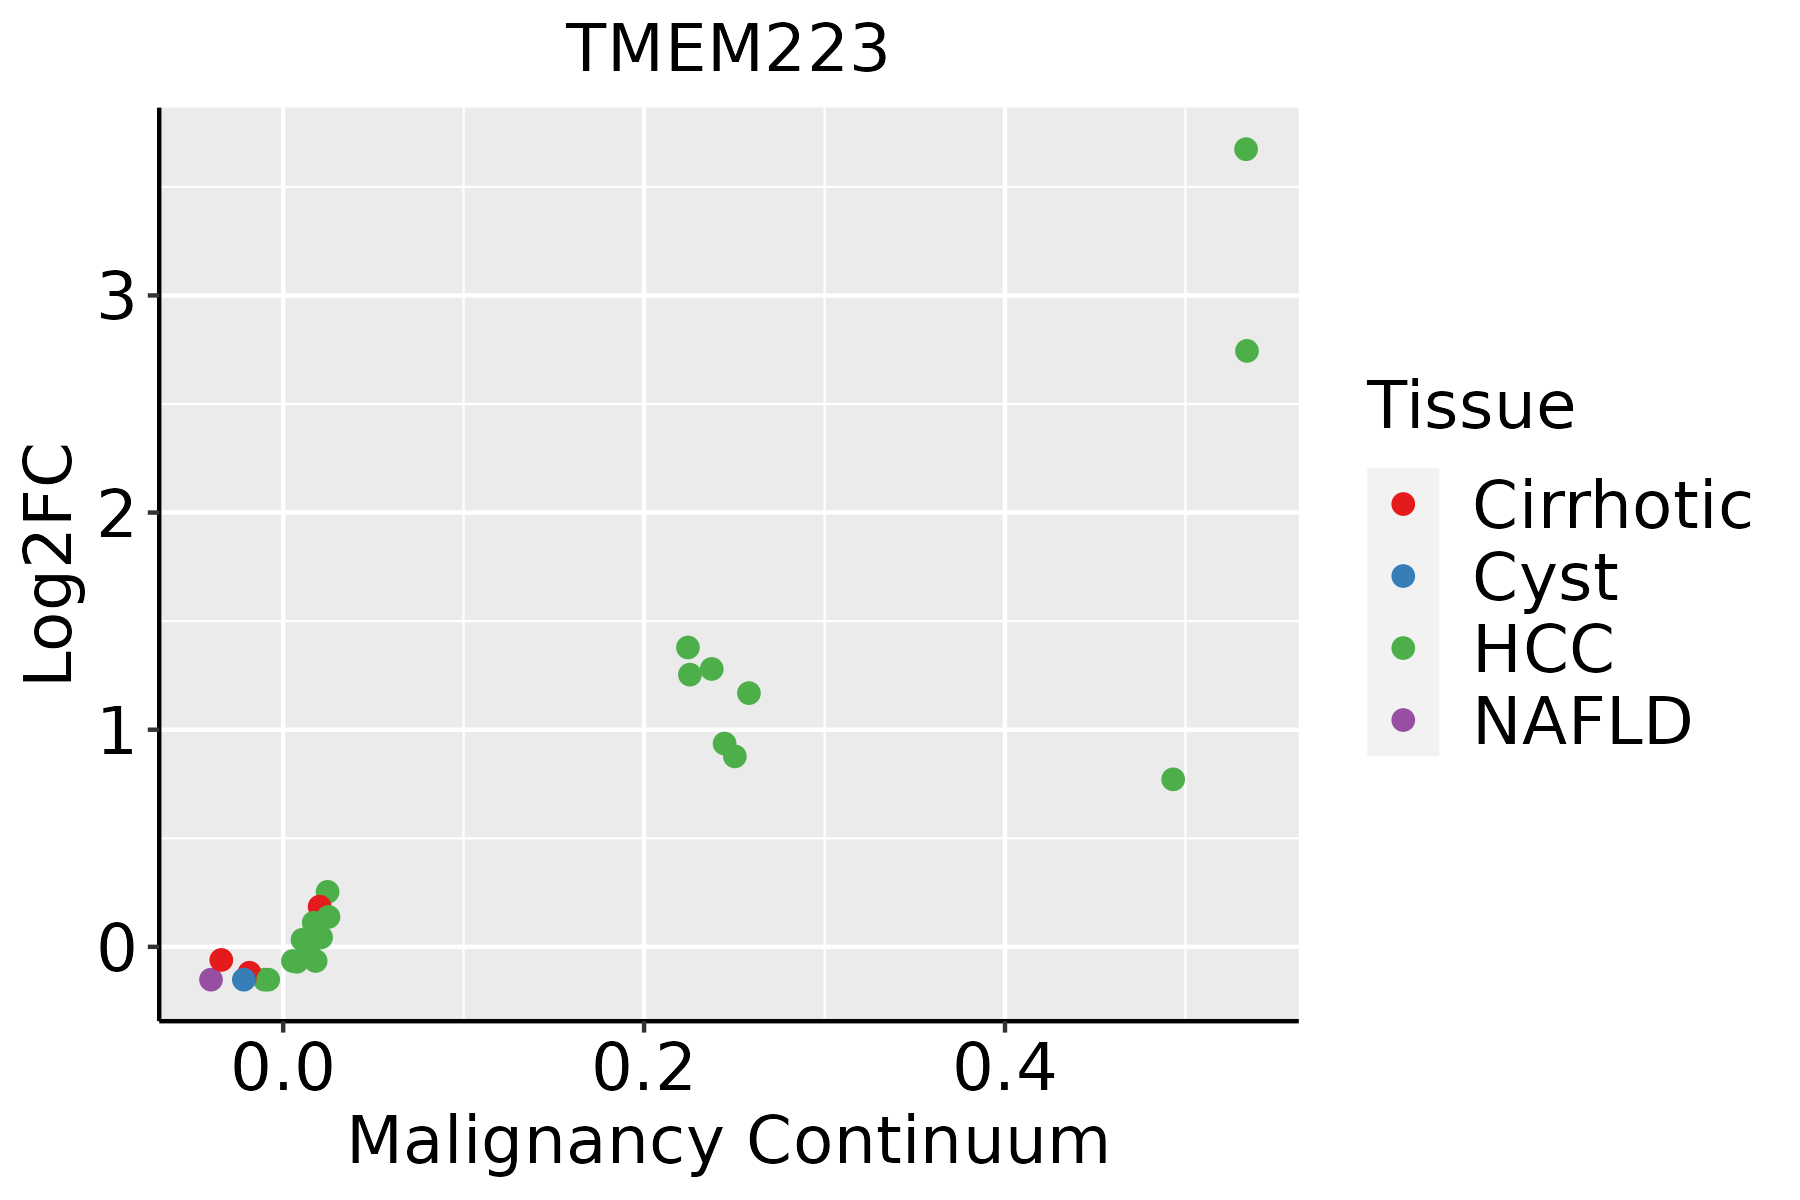 | HCC: Hepatocellular carcinoma |
| NAFLD: Non-alcoholic fatty liver disease | ||
| Oral Cavity |  | EOLP: Erosive Oral lichen planus |
| LP: leukoplakia | ||
| NEOLP: Non-erosive oral lichen planus | ||
| OSCC: Oral squamous cell carcinoma | ||
| Skin |  | AK: Actinic keratosis |
| cSCC: Cutaneous squamous cell carcinoma | ||
| SCCIS:squamous cell carcinoma in situ | ||
| Thyroid | 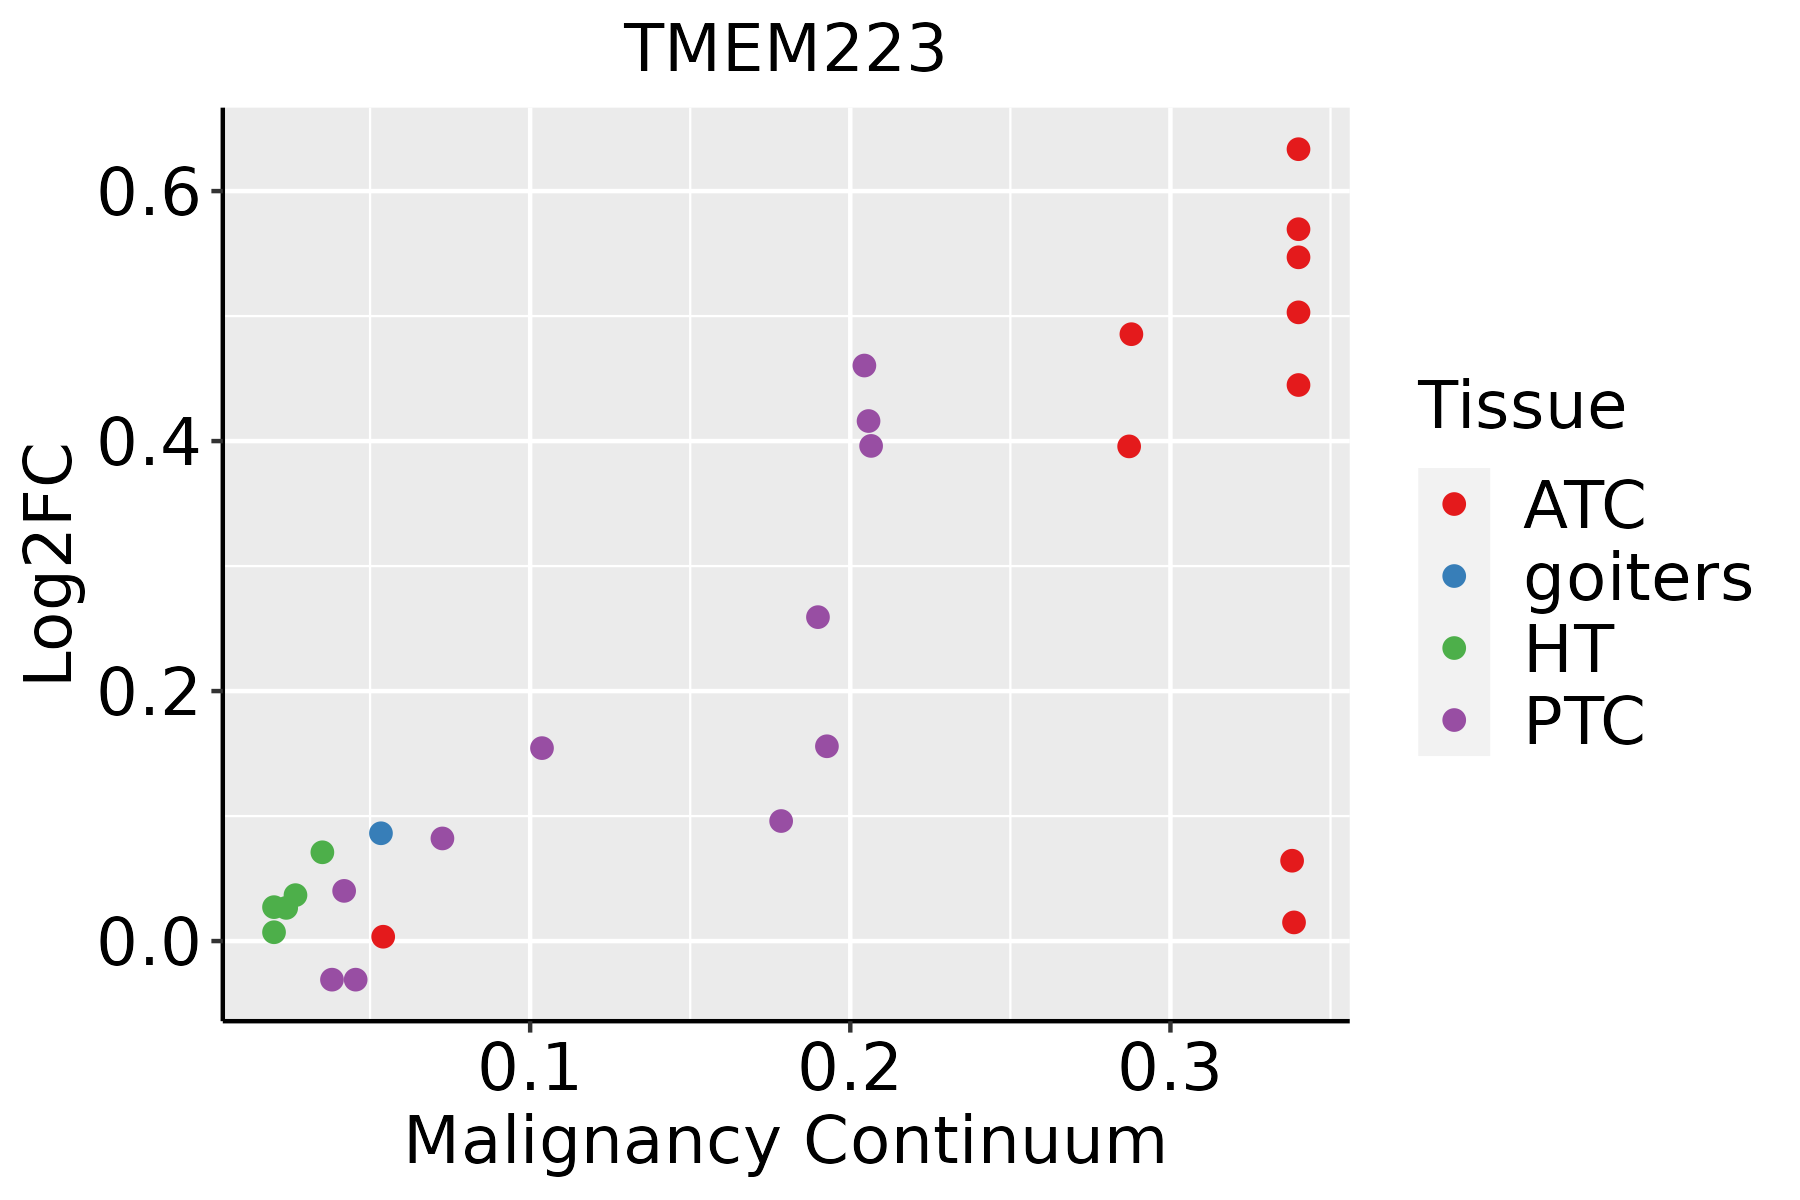 | ATC: Anaplastic thyroid cancer |
| HT: Hashimoto's thyroiditis | ||
| PTC: Papillary thyroid cancer |
| ∗log2FC in expression of this searched gene in stem-like cells from each diseased tissue sample relative to stem-like cells in normal samples in each tissue plotted against the malignancy continuum. Samples are colored based on if they are from different disease stage. |
Top |
Malignant transformation related pathway analysis |
| Find out the enriched GO biological processes and KEGG pathways involved in transition from healthy to precancer to cancer |
| Tissue | Disease Stage | Enriched GO biological Processes |
| Colorectum | AD |  |
| Colorectum | SER |  |
| Colorectum | MSS |  |
| Colorectum | MSI-H |  |
| Colorectum | FAP |  |
| ∗Top 15 enriched GO BP terms are showed in the bar plot of each disease state in each tissue. Each row represents a significant GO biological process which is colored according to the -log10(p.adjust). |
| Page: 1 2 3 4 5 6 7 8 9 |
| GO ID | Tissue | Disease Stage | Description | Gene Ratio | Bg Ratio | pvalue | p.adjust | Count |
| Page: 1 |
| Pathway ID | Tissue | Disease Stage | Description | Gene Ratio | Bg Ratio | pvalue | p.adjust | qvalue | Count |
| Page: 1 |
Top |
Cell-cell communication analysis |
| Identification of potential cell-cell interactions between two cell types and their ligand-receptor pairs for different disease states |
| Ligand | Receptor | LRpair | Pathway | Tissue | Disease Stage |
| Page: 1 |
Top |
Single-cell gene regulatory network inference analysis |
| Find out the significant the regulons (TFs) and the target genes of each regulon across cell types for different disease states |
| TF | Cell Type | Tissue | Disease Stage | Target Gene | RSS | Regulon Activity |
| ∗The dot plots of a searched regulon are shown for all cell subpopulations in each disease state of each tissue based on the regulon specific score inferred using pySCENIC and by calculating the average expression. |
| Page: 1 |
Top |
Somatic mutation of malignant transformation related genes |
| Annotation of somatic variants for genes involved in malignant transformation |
| Hugo Symbol | Variant Class | Variant Classification | dbSNP RS | HGVSc | HGVSp | HGVSp Short | SWISSPROT | BIOTYPE | SIFT | PolyPhen | Tumor Sample Barcode | Tissue | Histology | Sex | Age | Stage | Therapy Types | Drugs | Outcome |
| TMEM223 | SNV | Missense_Mutation | c.112N>C | p.Glu38Gln | p.E38Q | A0PJW6 | protein_coding | tolerated(0.27) | benign(0.067) | TCGA-4J-AA1J-01 | Cervix | cervical & endocervical cancer | Female | <65 | I/II | Unknown | Unknown | SD | |
| TMEM223 | SNV | Missense_Mutation | rs763596886 | c.478N>T | p.Arg160Trp | p.R160W | A0PJW6 | protein_coding | deleterious(0) | probably_damaging(1) | TCGA-EK-A3GM-01 | Cervix | cervical & endocervical cancer | Female | >=65 | I/II | Unknown | Unknown | SD |
| TMEM223 | insertion | Frame_Shift_Ins | novel | c.212dupC | p.Val72GlyfsTer91 | p.V72Gfs*91 | A0PJW6 | protein_coding | TCGA-VS-A94Z-01 | Cervix | cervical & endocervical cancer | Female | <65 | I/II | Chemotherapy | cisplatin | CR | ||
| TMEM223 | SNV | Missense_Mutation | rs756262183 | c.127N>T | p.Arg43Cys | p.R43C | A0PJW6 | protein_coding | deleterious(0) | benign(0.054) | TCGA-AZ-5403-01 | Colorectum | colon adenocarcinoma | Male | <65 | I/II | Unknown | Unknown | PD |
| TMEM223 | SNV | Missense_Mutation | novel | c.106C>T | p.Leu36Phe | p.L36F | A0PJW6 | protein_coding | deleterious(0) | probably_damaging(0.999) | TCGA-AJ-A2QO-01 | Endometrium | uterine corpus endometrioid carcinoma | Female | >=65 | I/II | Unknown | Unknown | SD |
| TMEM223 | SNV | Missense_Mutation | c.548N>A | p.Thr183Asn | p.T183N | A0PJW6 | protein_coding | tolerated(0.34) | benign(0.026) | TCGA-AP-A059-01 | Endometrium | uterine corpus endometrioid carcinoma | Female | >=65 | I/II | Unknown | Unknown | SD | |
| TMEM223 | SNV | Missense_Mutation | c.532N>G | p.Phe178Val | p.F178V | A0PJW6 | protein_coding | deleterious(0) | probably_damaging(0.974) | TCGA-D1-A17Q-01 | Endometrium | uterine corpus endometrioid carcinoma | Female | <65 | I/II | Unknown | Unknown | SD | |
| TMEM223 | SNV | Missense_Mutation | novel | c.340N>G | p.Leu114Val | p.L114V | A0PJW6 | protein_coding | tolerated(0.14) | benign(0.046) | TCGA-DD-AADN-01 | Liver | liver hepatocellular carcinoma | Male | <65 | I/II | Unknown | Unknown | SD |
| TMEM223 | SNV | Missense_Mutation | rs771984852 | c.41N>T | p.Ala14Val | p.A14V | A0PJW6 | protein_coding | tolerated_low_confidence(0.52) | benign(0.001) | TCGA-55-8207-01 | Lung | lung adenocarcinoma | Male | >=65 | I/II | Unknown | Unknown | SD |
| TMEM223 | SNV | Missense_Mutation | c.386G>T | p.Gly129Val | p.G129V | A0PJW6 | protein_coding | deleterious(0) | probably_damaging(1) | TCGA-69-7765-01 | Lung | lung adenocarcinoma | Male | <65 | III/IV | Chemotherapy | carboplatin | SD |
| Page: 1 2 |
Top |
Related drugs of malignant transformation related genes |
| Identification of chemicals and drugs interact with genes involved in malignant transfromation |
| (DGIdb 4.0) |
| Entrez ID | Symbol | Category | Interaction Types | Drug Claim Name | Drug Name | PMIDs |
| Page: 1 |

Copyright 2023-Present -The University of Texas Health Science Center at Houston |