
|
|||||
|
 | |
| |
| |
| |
| |
| |
|
Gene: TM2D1 |
Gene summary for TM2D1 |
| Gene information | Species | Human | Gene symbol | TM2D1 | Gene ID | 83941 |
| Gene name | TM2 domain containing 1 | |
| Gene Alias | BBP | |
| Cytomap | 1p31.3 | |
| Gene Type | protein-coding | GO ID | GO:0006915 | UniProtAcc | Q9BX74 |
Top |
Malignant transformation analysis |
| Identification of the aberrant gene expression in precancerous and cancerous lesions by comparing the gene expression of stem-like cells in diseased tissues with normal stem cells |
| Entrez ID | Symbol | Replicates | Species | Organ | Tissue | Adj P-value | Log2FC | Malignancy |
| 83941 | TM2D1 | SYSMH6 | Human | Oral cavity | OSCC | 4.71e-06 | 3.78e-01 | 0.1275 |
| 83941 | TM2D1 | P4_S8_cSCC | Human | Skin | cSCC | 3.65e-04 | -1.85e-03 | -0.3095 |
| 83941 | TM2D1 | P1_cSCC | Human | Skin | cSCC | 1.85e-08 | 4.48e-01 | 0.0292 |
| 83941 | TM2D1 | P2_cSCC | Human | Skin | cSCC | 4.67e-10 | 3.31e-01 | -0.024 |
| 83941 | TM2D1 | P4_cSCC | Human | Skin | cSCC | 4.60e-14 | 3.26e-01 | -0.00290000000000005 |
| 83941 | TM2D1 | P10_cSCC | Human | Skin | cSCC | 2.56e-24 | 7.10e-01 | 0.1017 |
| 83941 | TM2D1 | cSCC_p8 | Human | Skin | cSCC | 5.71e-05 | -5.57e-03 | -0.1971 |
| 83941 | TM2D1 | Adj_PTCwithHT_6 | Human | Thyroid | HT | 2.25e-03 | -2.21e-01 | 0.02 |
| 83941 | TM2D1 | male-WTA | Human | Thyroid | PTC | 1.57e-31 | 8.32e-02 | 0.1037 |
| 83941 | TM2D1 | PTC01 | Human | Thyroid | PTC | 5.05e-15 | 4.39e-01 | 0.1899 |
| 83941 | TM2D1 | PTC03 | Human | Thyroid | PTC | 7.66e-05 | 1.62e-01 | 0.1784 |
| 83941 | TM2D1 | PTC04 | Human | Thyroid | PTC | 7.09e-15 | 2.79e-01 | 0.1927 |
| 83941 | TM2D1 | PTC05 | Human | Thyroid | PTC | 4.15e-16 | 6.11e-01 | 0.2065 |
| 83941 | TM2D1 | PTC06 | Human | Thyroid | PTC | 2.23e-30 | 7.85e-01 | 0.2057 |
| 83941 | TM2D1 | PTC07 | Human | Thyroid | PTC | 1.19e-46 | 7.28e-01 | 0.2044 |
| 83941 | TM2D1 | ATC09 | Human | Thyroid | ATC | 2.16e-09 | 2.26e-01 | 0.2871 |
| 83941 | TM2D1 | ATC11 | Human | Thyroid | ATC | 5.39e-06 | 5.63e-01 | 0.3386 |
| 83941 | TM2D1 | ATC12 | Human | Thyroid | ATC | 3.28e-10 | 2.13e-02 | 0.34 |
| 83941 | TM2D1 | ATC13 | Human | Thyroid | ATC | 2.78e-23 | 2.89e-01 | 0.34 |
| 83941 | TM2D1 | ATC1 | Human | Thyroid | ATC | 1.32e-08 | 2.64e-01 | 0.2878 |
| Page: 1 2 3 4 5 6 7 |
| Tissue | Expression Dynamics | Abbreviation |
| Esophagus | 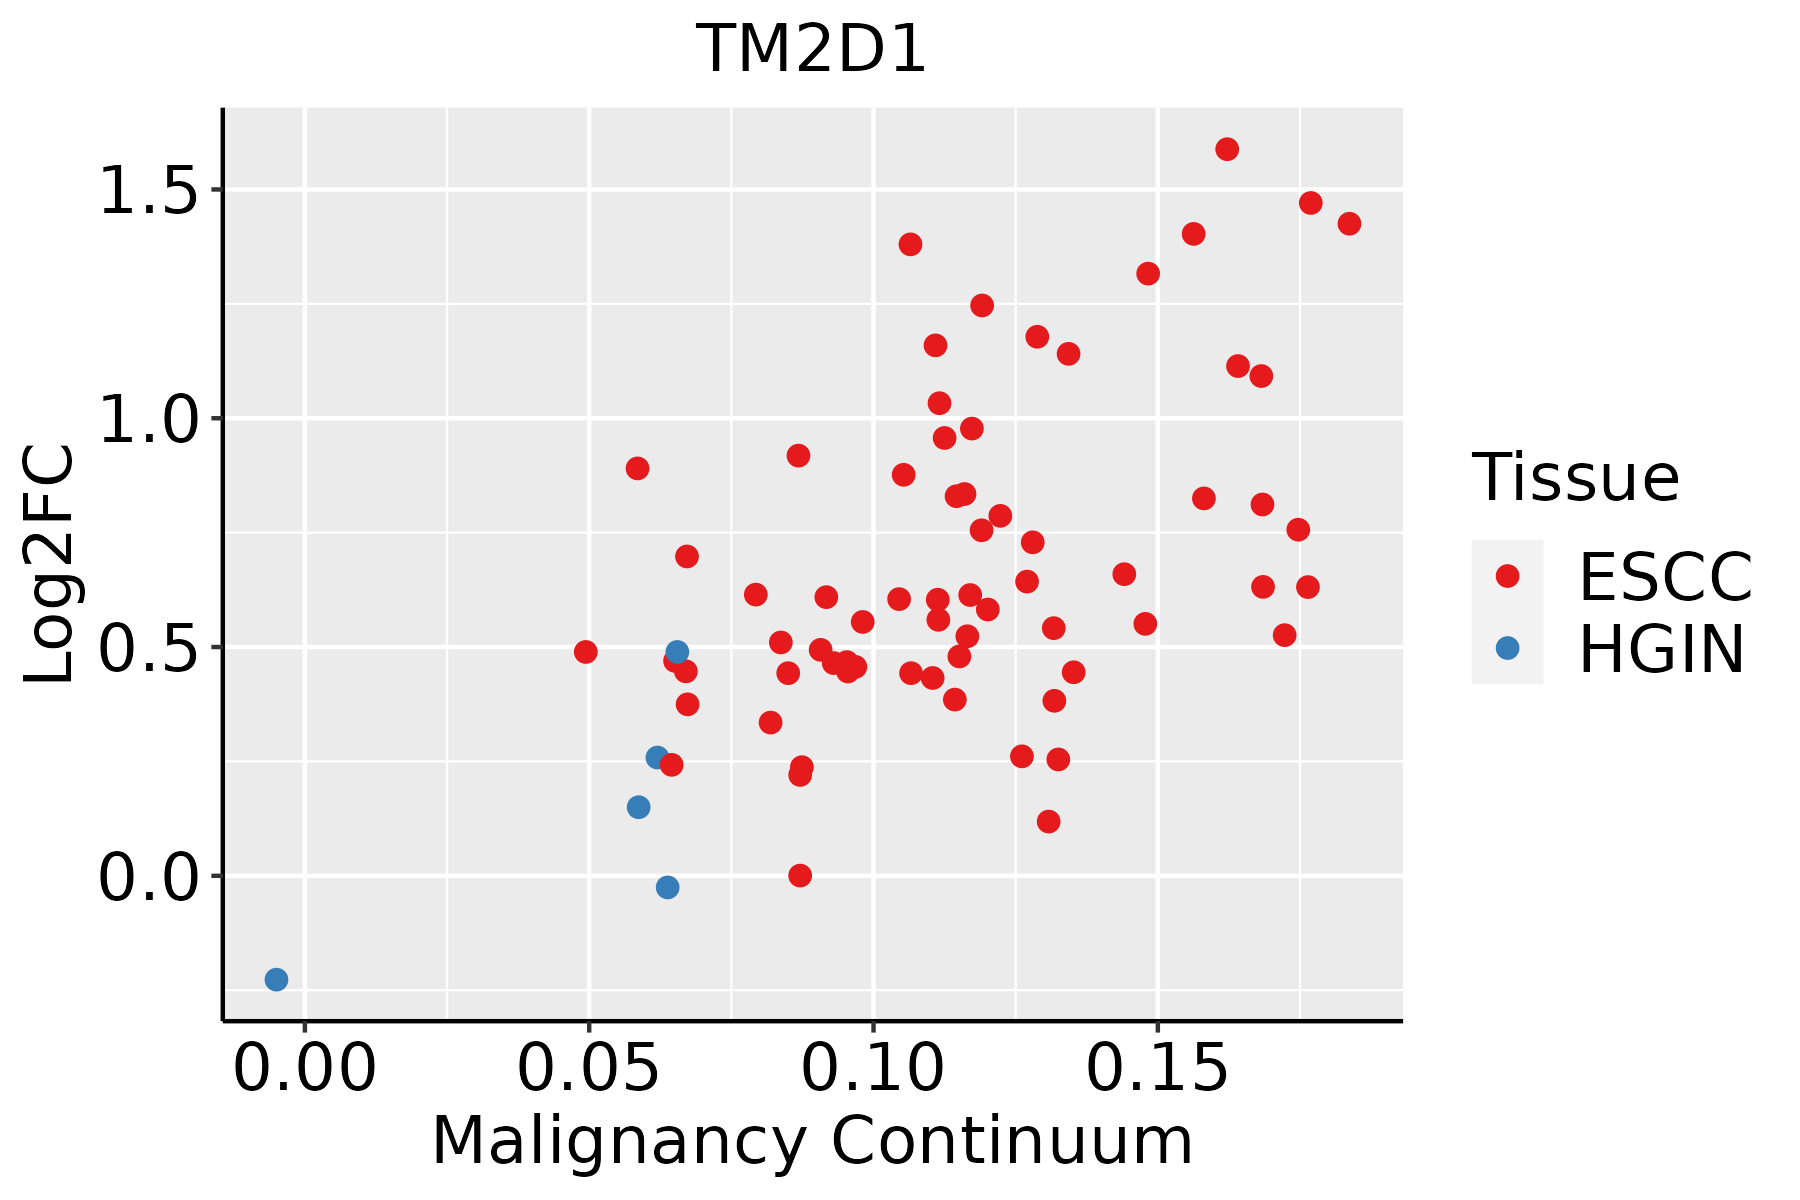 | ESCC: Esophageal squamous cell carcinoma |
| HGIN: High-grade intraepithelial neoplasias | ||
| LGIN: Low-grade intraepithelial neoplasias | ||
| Liver |  | HCC: Hepatocellular carcinoma |
| NAFLD: Non-alcoholic fatty liver disease | ||
| Oral Cavity | 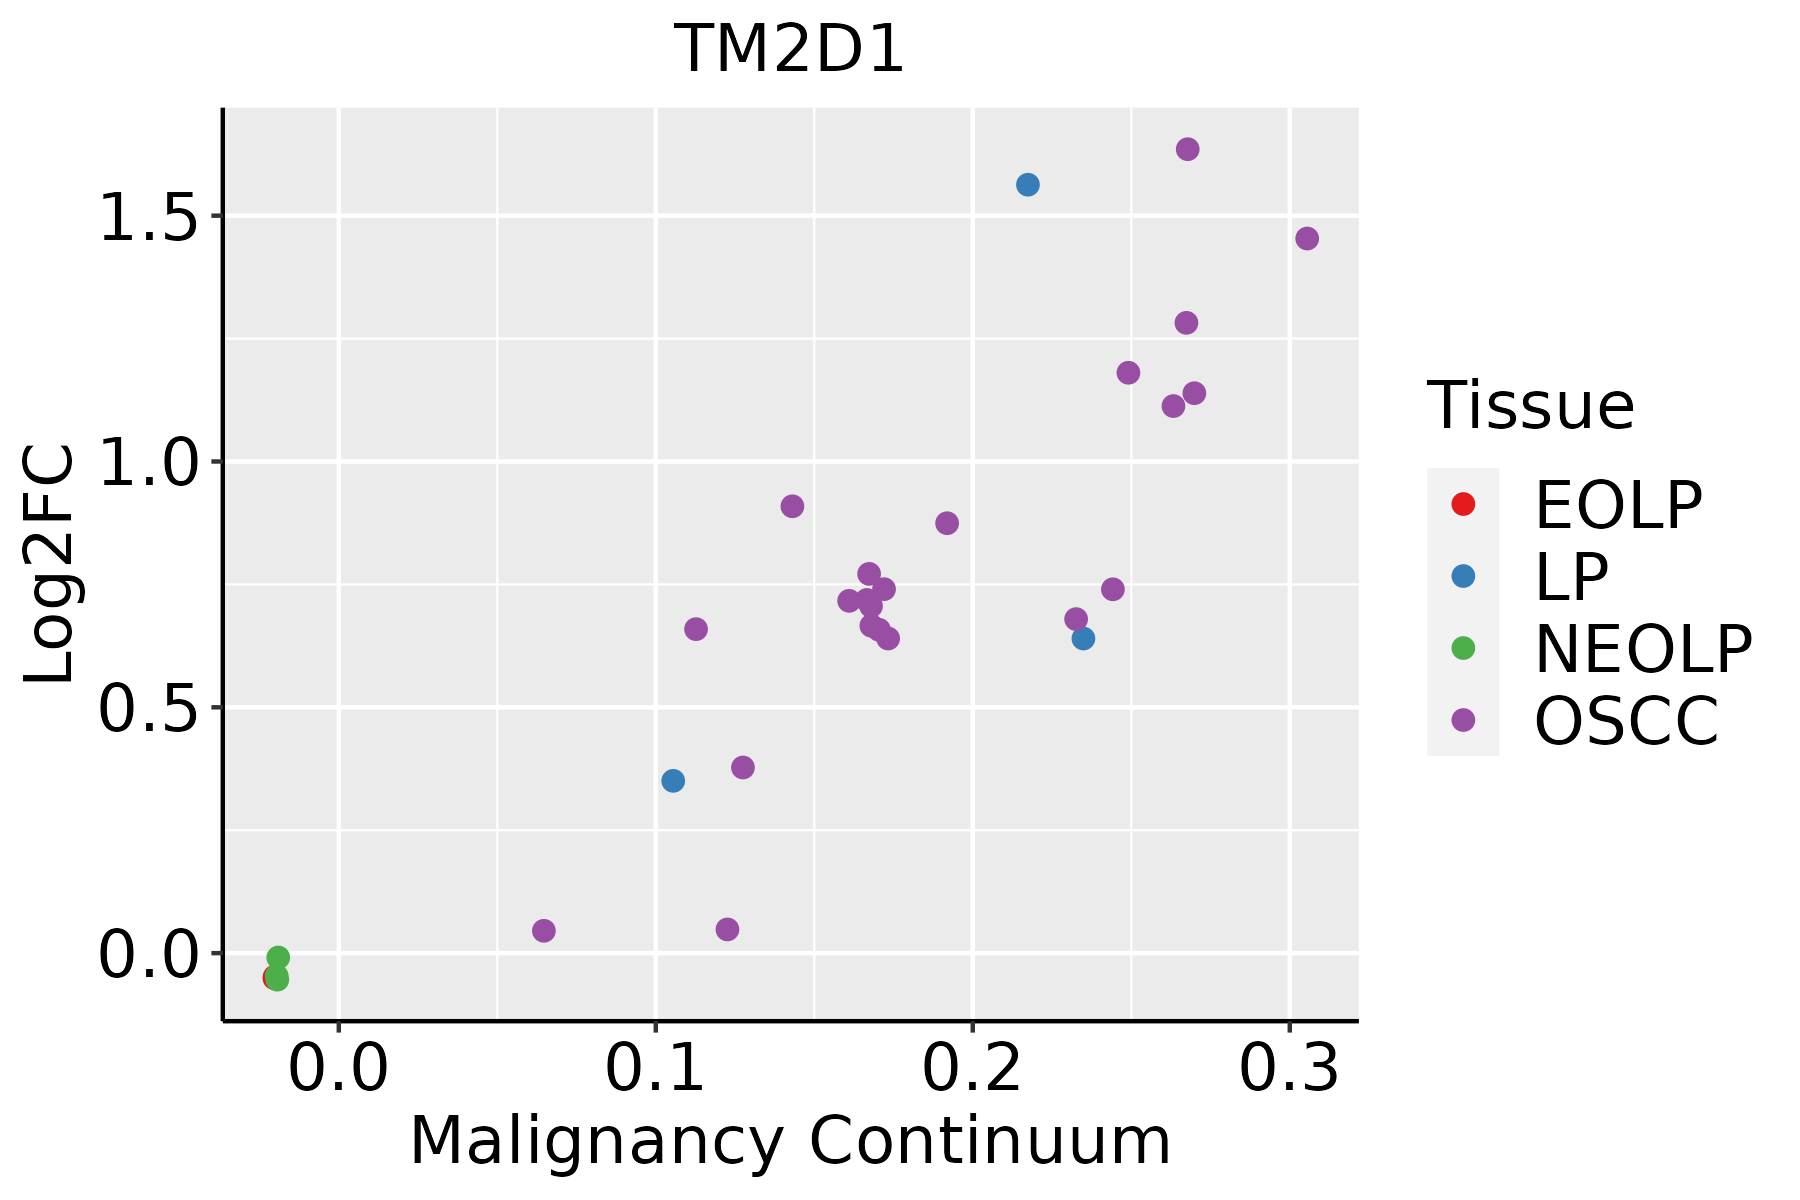 | EOLP: Erosive Oral lichen planus |
| LP: leukoplakia | ||
| NEOLP: Non-erosive oral lichen planus | ||
| OSCC: Oral squamous cell carcinoma | ||
| Skin | 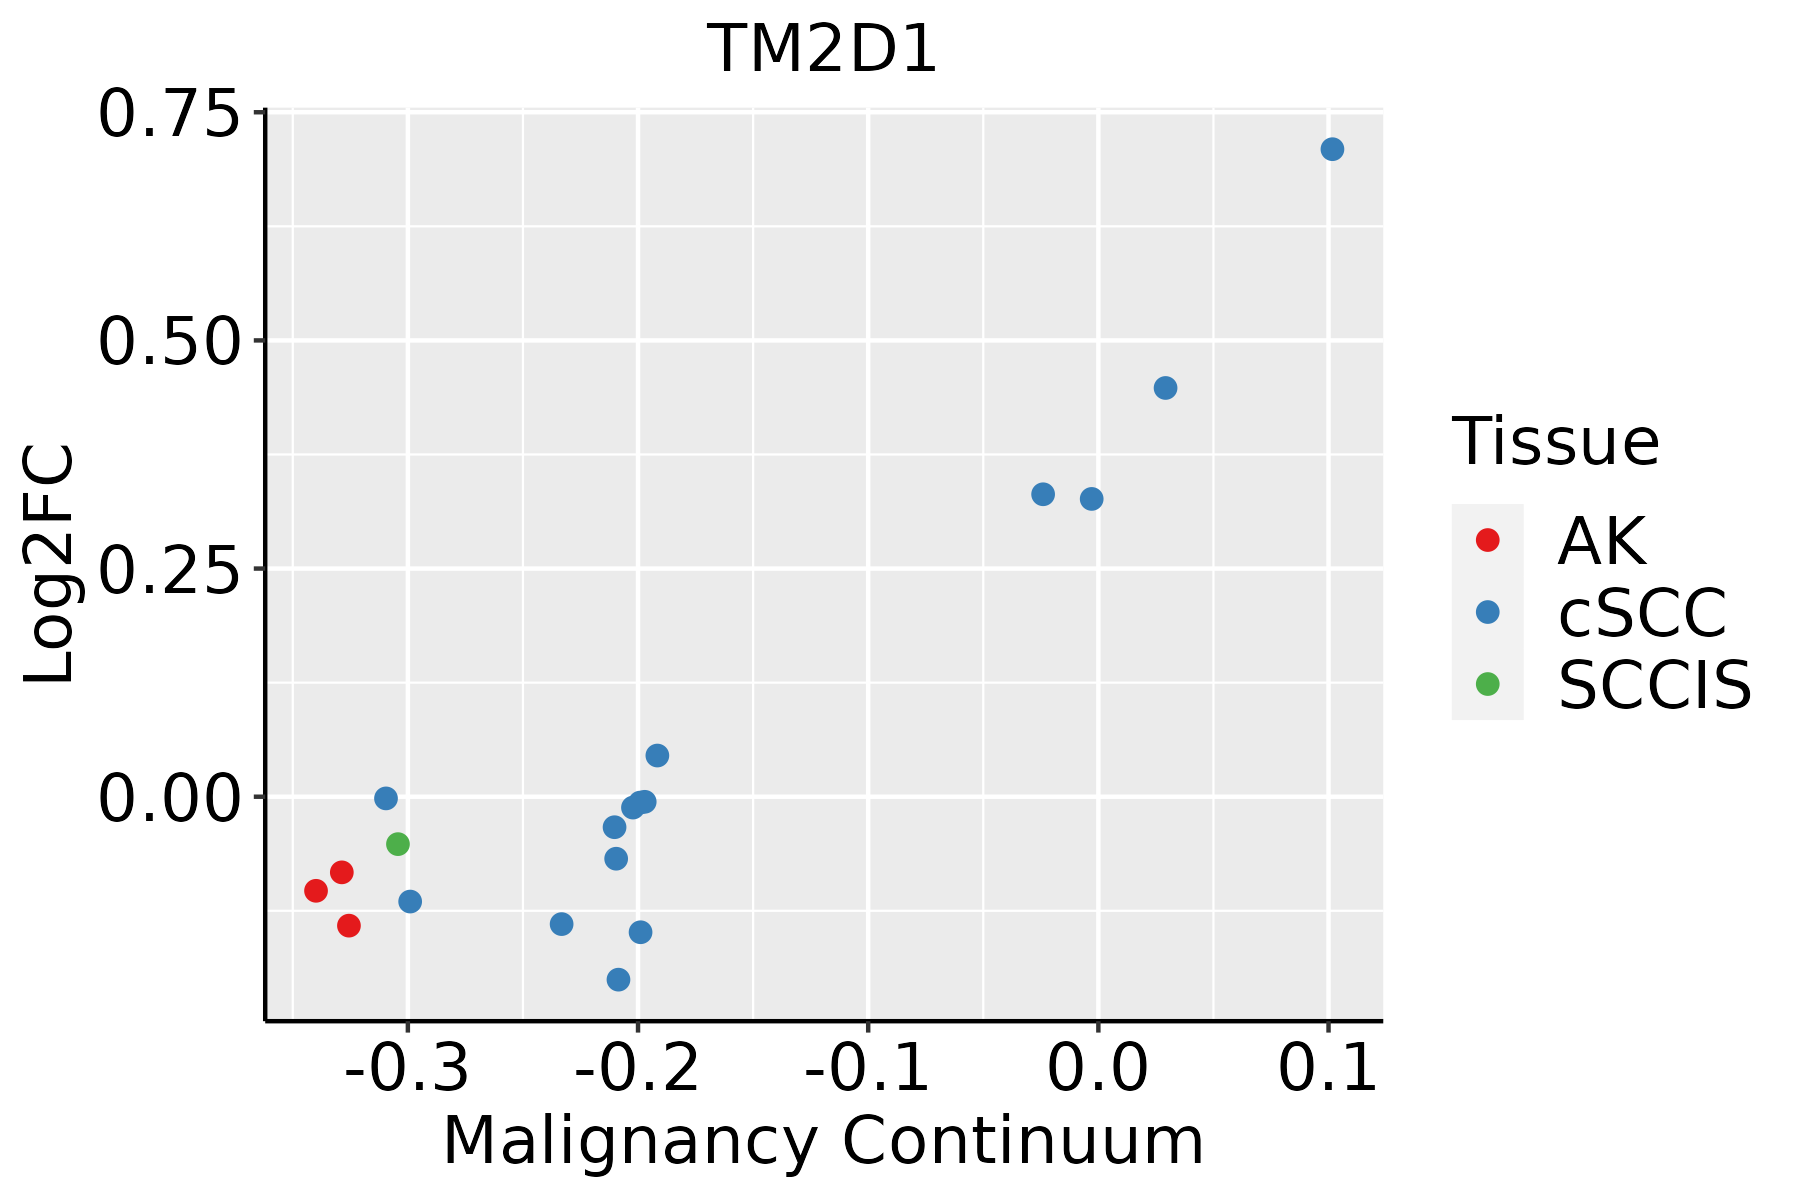 | AK: Actinic keratosis |
| cSCC: Cutaneous squamous cell carcinoma | ||
| SCCIS:squamous cell carcinoma in situ | ||
| Thyroid | 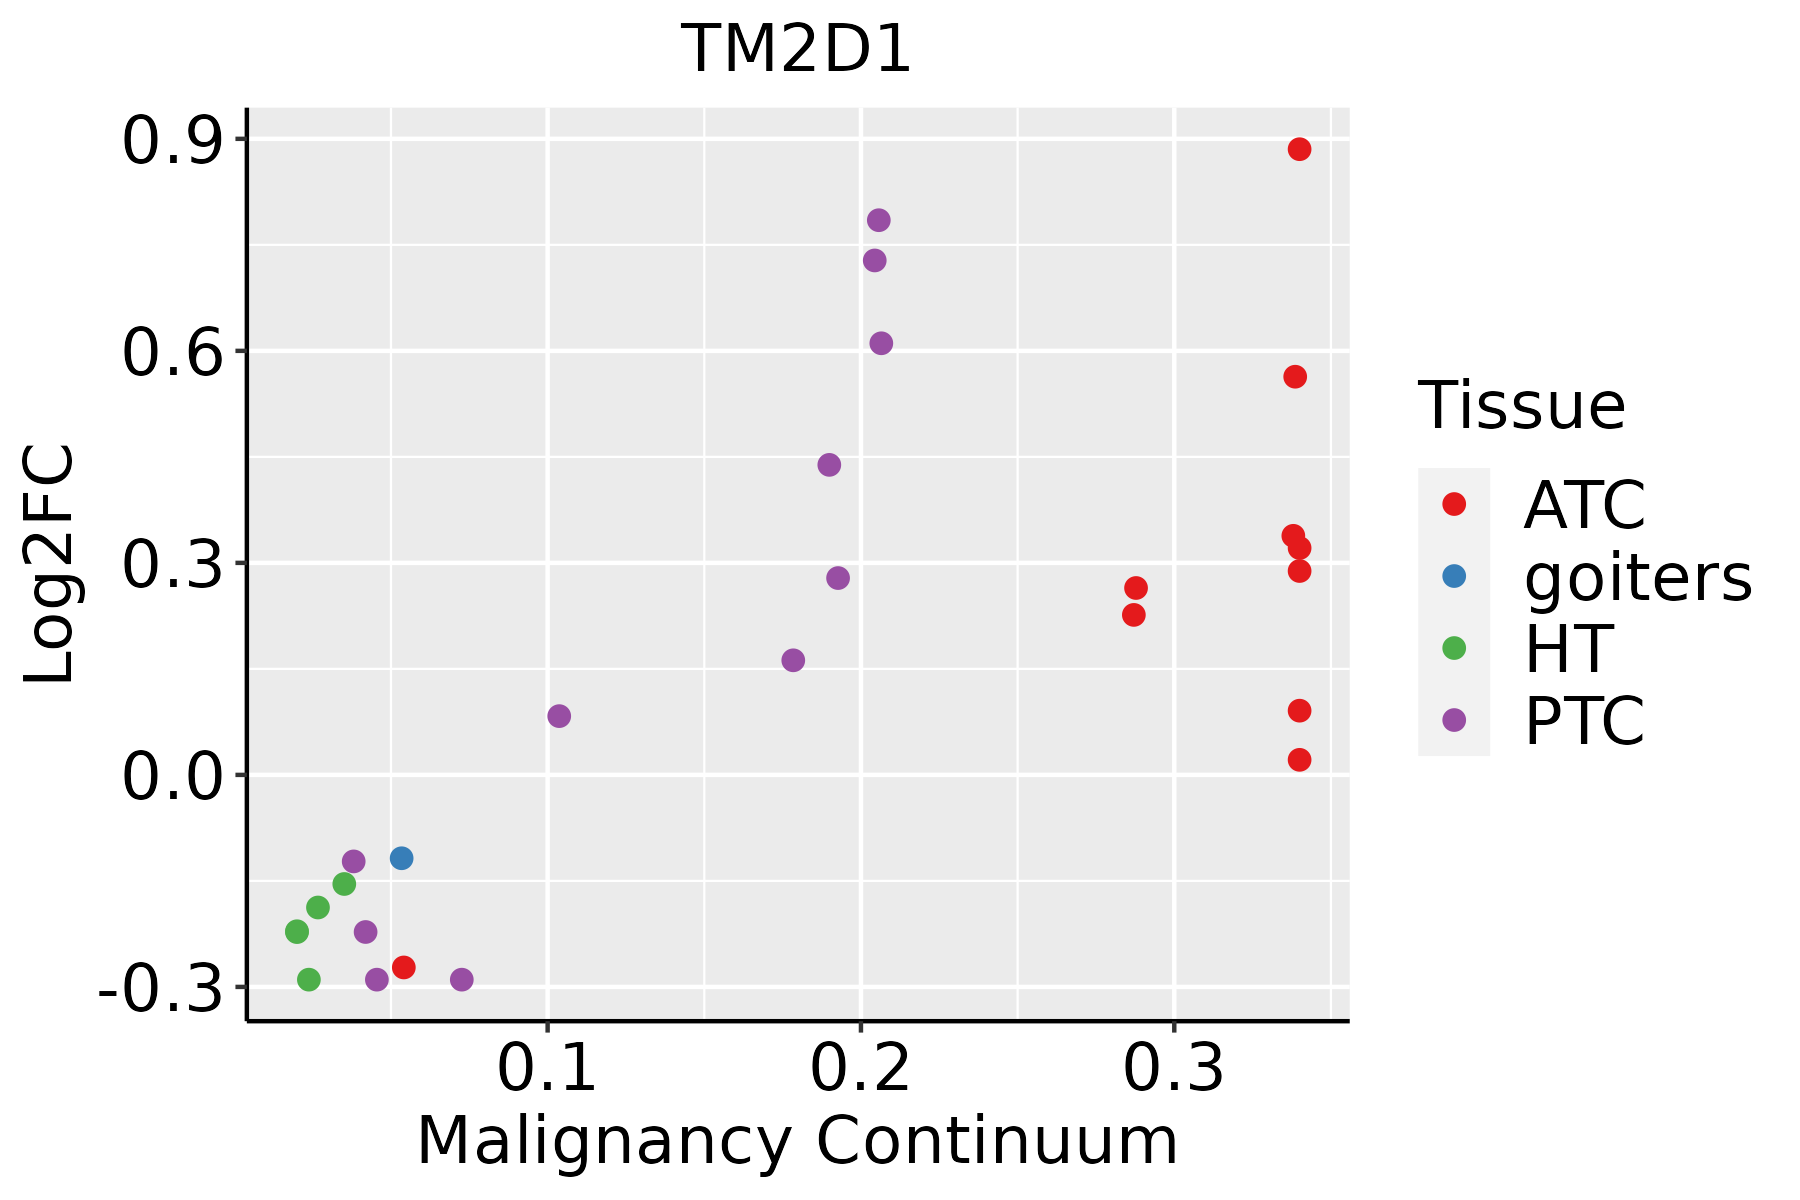 | ATC: Anaplastic thyroid cancer |
| HT: Hashimoto's thyroiditis | ||
| PTC: Papillary thyroid cancer |
| ∗log2FC in expression of this searched gene in stem-like cells from each diseased tissue sample relative to stem-like cells in normal samples in each tissue plotted against the malignancy continuum. Samples are colored based on if they are from different disease stage. |
Top |
Malignant transformation related pathway analysis |
| Find out the enriched GO biological processes and KEGG pathways involved in transition from healthy to precancer to cancer |
| Tissue | Disease Stage | Enriched GO biological Processes |
| Colorectum | AD |  |
| Colorectum | SER |  |
| Colorectum | MSS |  |
| Colorectum | MSI-H |  |
| Colorectum | FAP |  |
| ∗Top 15 enriched GO BP terms are showed in the bar plot of each disease state in each tissue. Each row represents a significant GO biological process which is colored according to the -log10(p.adjust). |
| Page: 1 2 3 4 5 6 7 8 9 |
| GO ID | Tissue | Disease Stage | Description | Gene Ratio | Bg Ratio | pvalue | p.adjust | Count |
| Page: 1 |
| Pathway ID | Tissue | Disease Stage | Description | Gene Ratio | Bg Ratio | pvalue | p.adjust | qvalue | Count |
| Page: 1 |
Top |
Cell-cell communication analysis |
| Identification of potential cell-cell interactions between two cell types and their ligand-receptor pairs for different disease states |
| Ligand | Receptor | LRpair | Pathway | Tissue | Disease Stage |
| Page: 1 |
Top |
Single-cell gene regulatory network inference analysis |
| Find out the significant the regulons (TFs) and the target genes of each regulon across cell types for different disease states |
| TF | Cell Type | Tissue | Disease Stage | Target Gene | RSS | Regulon Activity |
| ∗The dot plots of a searched regulon are shown for all cell subpopulations in each disease state of each tissue based on the regulon specific score inferred using pySCENIC and by calculating the average expression. |
| Page: 1 |
Top |
Somatic mutation of malignant transformation related genes |
| Annotation of somatic variants for genes involved in malignant transformation |
| Hugo Symbol | Variant Class | Variant Classification | dbSNP RS | HGVSc | HGVSp | HGVSp Short | SWISSPROT | BIOTYPE | SIFT | PolyPhen | Tumor Sample Barcode | Tissue | Histology | Sex | Age | Stage | Therapy Types | Drugs | Outcome |
| TM2D1 | SNV | Missense_Mutation | c.409N>C | p.Asp137His | p.D137H | Q9BX74 | protein_coding | deleterious(0) | probably_damaging(0.999) | TCGA-GM-A2DL-01 | Breast | breast invasive carcinoma | Female | <65 | I/II | Hormone Therapy | tamoxiphen | CR | |
| TM2D1 | SNV | Missense_Mutation | rs369821446 | c.341N>A | p.Arg114Gln | p.R114Q | Q9BX74 | protein_coding | tolerated(0.08) | possibly_damaging(0.462) | TCGA-5M-AAT6-01 | Colorectum | colon adenocarcinoma | Female | <65 | III/IV | Unknown | Unknown | PD |
| TM2D1 | SNV | Missense_Mutation | c.59N>A | p.Val20Asp | p.V20D | Q9BX74 | protein_coding | deleterious_low_confidence(0.01) | benign(0.011) | TCGA-DM-A28A-01 | Colorectum | colon adenocarcinoma | Male | >=65 | III/IV | Unknown | Unknown | SD | |
| TM2D1 | SNV | Missense_Mutation | c.341G>T | p.Arg114Leu | p.R114L | Q9BX74 | protein_coding | tolerated(0.06) | benign(0.396) | TCGA-AG-A002-01 | Colorectum | rectum adenocarcinoma | Male | <65 | I/II | Unknown | Unknown | SD | |
| TM2D1 | SNV | Missense_Mutation | c.10G>T | p.Ala4Ser | p.A4S | Q9BX74 | protein_coding | tolerated_low_confidence(0.14) | benign(0) | TCGA-AX-A06L-01 | Endometrium | uterine corpus endometrioid carcinoma | Female | <65 | I/II | Unknown | Unknown | SD | |
| TM2D1 | SNV | Missense_Mutation | novel | c.171N>G | p.Ile57Met | p.I57M | Q9BX74 | protein_coding | tolerated(0.16) | benign(0.001) | TCGA-AX-A0J0-01 | Endometrium | uterine corpus endometrioid carcinoma | Female | <65 | I/II | Unknown | Unknown | SD |
| TM2D1 | SNV | Missense_Mutation | c.490N>T | p.Asp164Tyr | p.D164Y | Q9BX74 | protein_coding | deleterious(0) | probably_damaging(0.989) | TCGA-DF-A2KU-01 | Endometrium | uterine corpus endometrioid carcinoma | Female | Unknown | I/II | Unknown | Unknown | SD | |
| TM2D1 | SNV | Missense_Mutation | novel | c.253N>A | p.Ala85Thr | p.A85T | Q9BX74 | protein_coding | deleterious(0.01) | benign(0.1) | TCGA-EY-A2OM-01 | Endometrium | uterine corpus endometrioid carcinoma | Female | <65 | I/II | Chemotherapy | taxol | SD |
| TM2D1 | SNV | Missense_Mutation | rs369821446 | c.341G>A | p.Arg114Gln | p.R114Q | Q9BX74 | protein_coding | tolerated(0.08) | possibly_damaging(0.462) | TCGA-38-4632-01 | Lung | lung adenocarcinoma | Male | <65 | III/IV | Chemotherapy | gemcitabine | PD |
| TM2D1 | SNV | Missense_Mutation | c.278C>G | p.Ser93Cys | p.S93C | Q9BX74 | protein_coding | tolerated(0.18) | benign(0.215) | TCGA-50-5044-01 | Lung | lung adenocarcinoma | Female | >=65 | III/IV | Unknown | Unknown | PD |
| Page: 1 2 |
Top |
Related drugs of malignant transformation related genes |
| Identification of chemicals and drugs interact with genes involved in malignant transfromation |
| (DGIdb 4.0) |
| Entrez ID | Symbol | Category | Interaction Types | Drug Claim Name | Drug Name | PMIDs |
| Page: 1 |

Copyright 2023-Present -The University of Texas Health Science Center at Houston |