
|
|||||
|
 | |
| |
| |
| |
| |
| |
|
Gene: TIMM17A |
Gene summary for TIMM17A |
| Gene information | Species | Human | Gene symbol | TIMM17A | Gene ID | 10440 |
| Gene name | translocase of inner mitochondrial membrane 17A | |
| Gene Alias | TIM17 | |
| Cytomap | 1q32.1 | |
| Gene Type | protein-coding | GO ID | GO:0006508 | UniProtAcc | Q99595 |
Top |
Malignant transformation analysis |
| Identification of the aberrant gene expression in precancerous and cancerous lesions by comparing the gene expression of stem-like cells in diseased tissues with normal stem cells |
| Entrez ID | Symbol | Replicates | Species | Organ | Tissue | Adj P-value | Log2FC | Malignancy |
| 10440 | TIMM17A | SYSMH6 | Human | Oral cavity | OSCC | 1.32e-05 | 3.55e-01 | 0.1275 |
| 10440 | TIMM17A | GSM5252130_BPH340PrGF_Via | Human | Prostate | BPH | 2.28e-12 | 6.04e-01 | -0.1972 |
| 10440 | TIMM17A | GSM5252131_BPH340PrSF_Via | Human | Prostate | BPH | 6.58e-06 | 4.26e-01 | -0.2126 |
| 10440 | TIMM17A | GSM5252133_BPH389PrSF | Human | Prostate | BPH | 8.55e-05 | 5.77e-01 | -0.2027 |
| 10440 | TIMM17A | GSM5252135_BPH511PrPUr_Fcol_3GEX | Human | Prostate | BPH | 5.11e-04 | 3.79e-01 | -0.1833 |
| 10440 | TIMM17A | 047563_1562-all-cells | Human | Prostate | BPH | 8.19e-10 | -9.67e-02 | 0.0791 |
| 10440 | TIMM17A | 052097_1595-all-cells | Human | Prostate | BPH | 5.93e-04 | 2.44e-01 | 0.0972 |
| 10440 | TIMM17A | Dong_P1 | Human | Prostate | Tumor | 8.45e-18 | 4.72e-02 | 0.035 |
| 10440 | TIMM17A | Dong_P3 | Human | Prostate | Tumor | 8.23e-06 | -1.30e-01 | 0.0278 |
| 10440 | TIMM17A | Dong_P5 | Human | Prostate | Tumor | 3.35e-39 | 5.69e-02 | 0.053 |
| 10440 | TIMM17A | GSM5353232_PA_PR5249_T1_S3_L001 | Human | Prostate | Tumor | 8.97e-04 | -1.67e-01 | 0.1439 |
| 10440 | TIMM17A | GSM5353243_PA_PR5261_T1_S23_L002 | Human | Prostate | Tumor | 1.69e-04 | -1.13e-01 | 0.1545 |
| 10440 | TIMM17A | GSM5353244_PA_PR5261_T2_S24_L002 | Human | Prostate | Tumor | 2.77e-02 | -2.51e-01 | 0.1569 |
| 10440 | TIMM17A | P5_S10_cSCC | Human | Skin | cSCC | 2.10e-03 | -4.47e-03 | -0.299 |
| 10440 | TIMM17A | P1_cSCC | Human | Skin | cSCC | 7.30e-22 | 8.80e-01 | 0.0292 |
| 10440 | TIMM17A | P2_cSCC | Human | Skin | cSCC | 1.53e-15 | 6.10e-01 | -0.024 |
| 10440 | TIMM17A | P4_cSCC | Human | Skin | cSCC | 2.04e-32 | 9.88e-01 | -0.00290000000000005 |
| 10440 | TIMM17A | P10_cSCC | Human | Skin | cSCC | 2.20e-39 | 1.41e+00 | 0.1017 |
| 10440 | TIMM17A | Adj_PTCwithHT_6 | Human | Thyroid | HT | 1.52e-02 | -2.80e-01 | 0.02 |
| 10440 | TIMM17A | male-WTA | Human | Thyroid | PTC | 9.92e-32 | -1.50e-01 | 0.1037 |
| Page: 1 2 3 4 5 6 7 |
| Tissue | Expression Dynamics | Abbreviation |
| Esophagus | 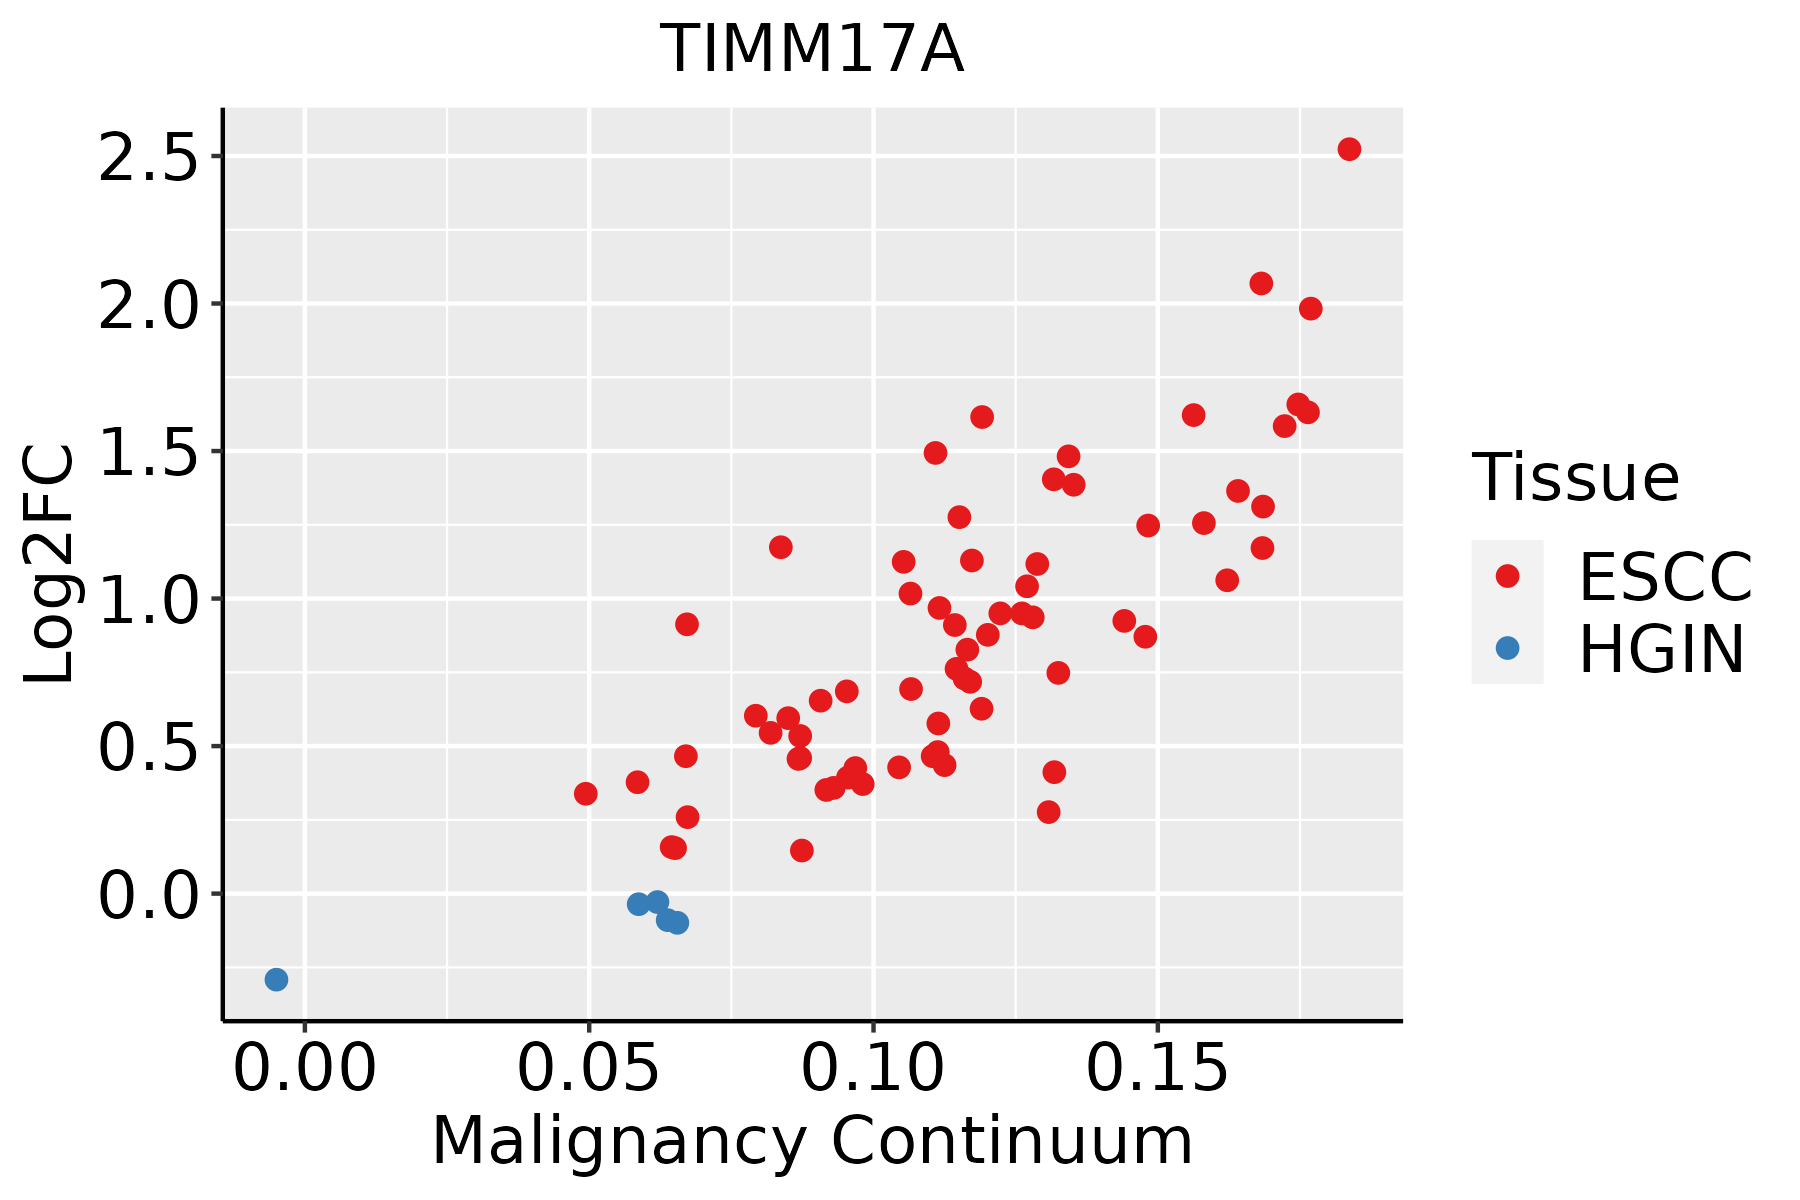 | ESCC: Esophageal squamous cell carcinoma |
| HGIN: High-grade intraepithelial neoplasias | ||
| LGIN: Low-grade intraepithelial neoplasias | ||
| Liver | 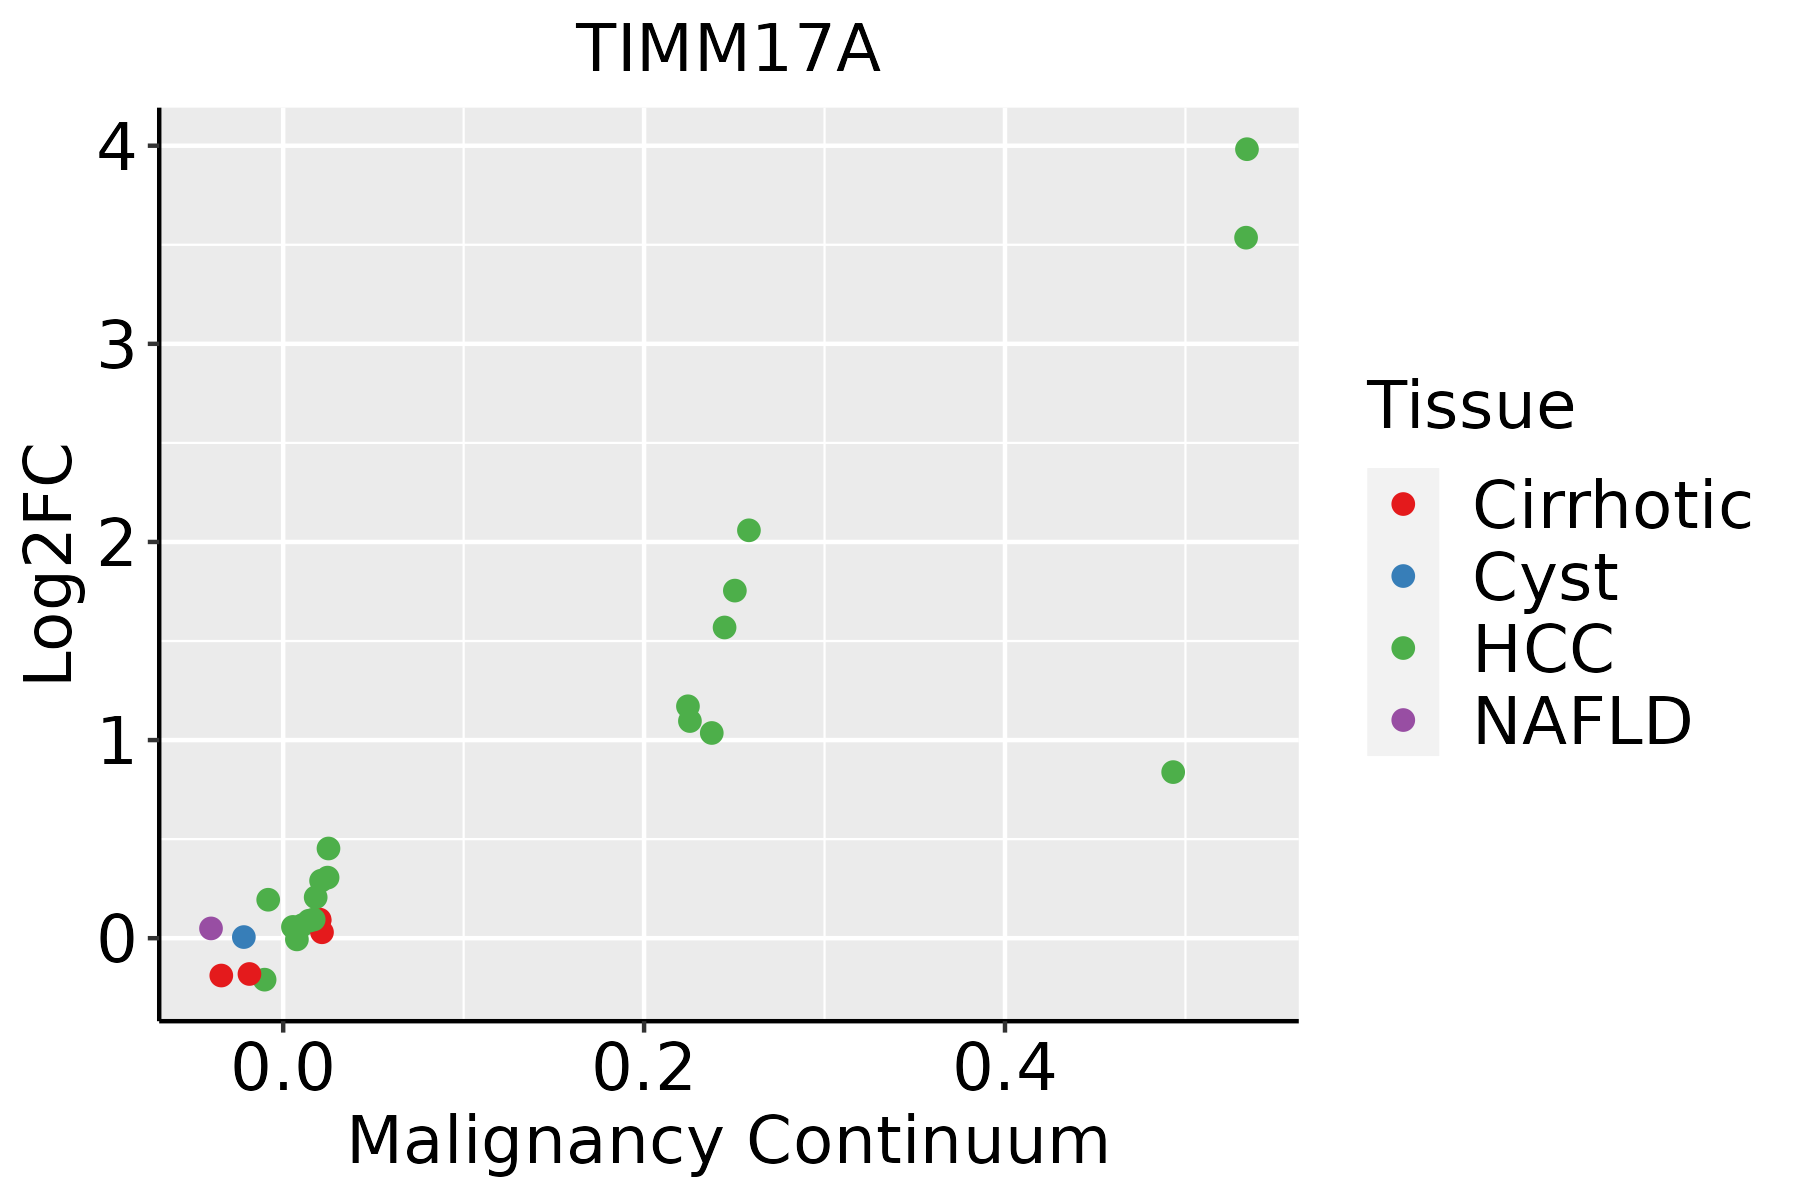 | HCC: Hepatocellular carcinoma |
| NAFLD: Non-alcoholic fatty liver disease | ||
| Oral Cavity |  | EOLP: Erosive Oral lichen planus |
| LP: leukoplakia | ||
| NEOLP: Non-erosive oral lichen planus | ||
| OSCC: Oral squamous cell carcinoma | ||
| Prostate | 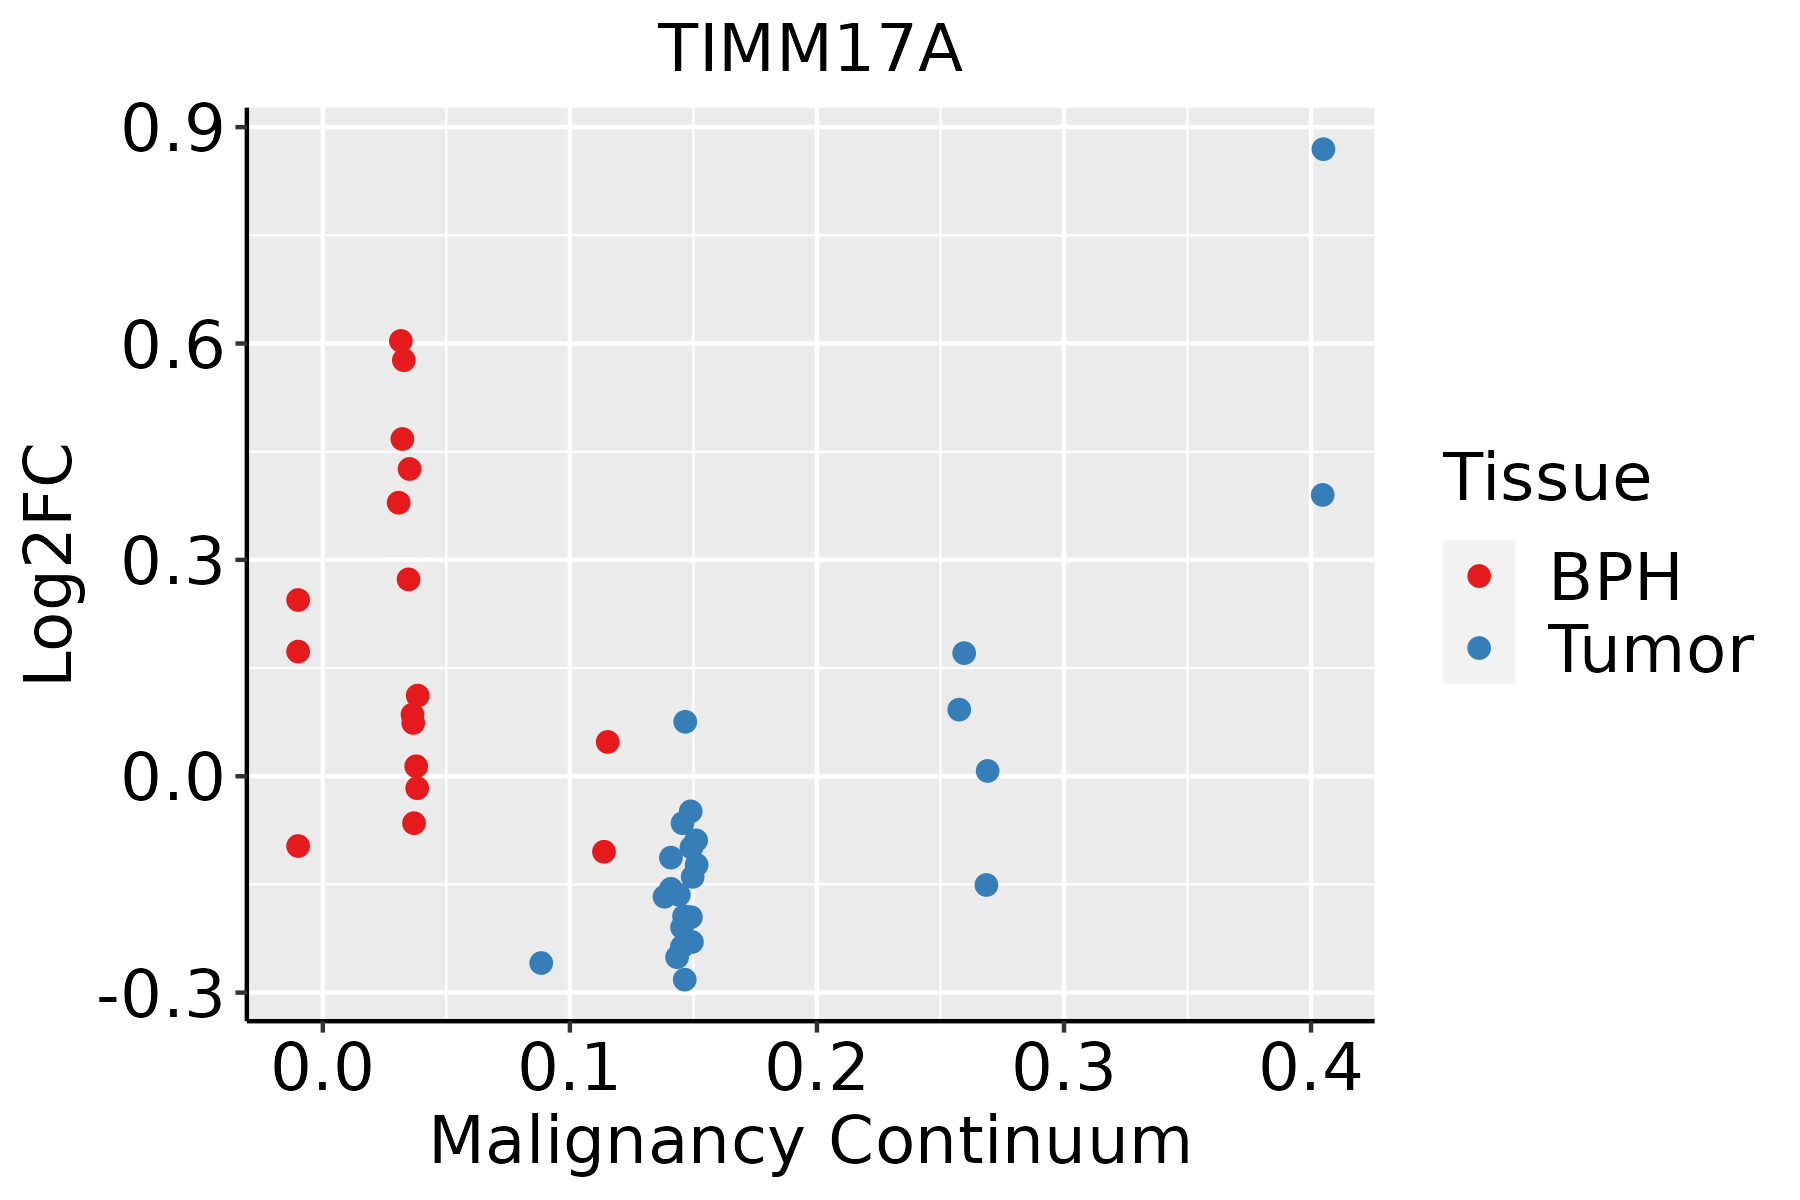 | BPH: Benign Prostatic Hyperplasia |
| Skin | 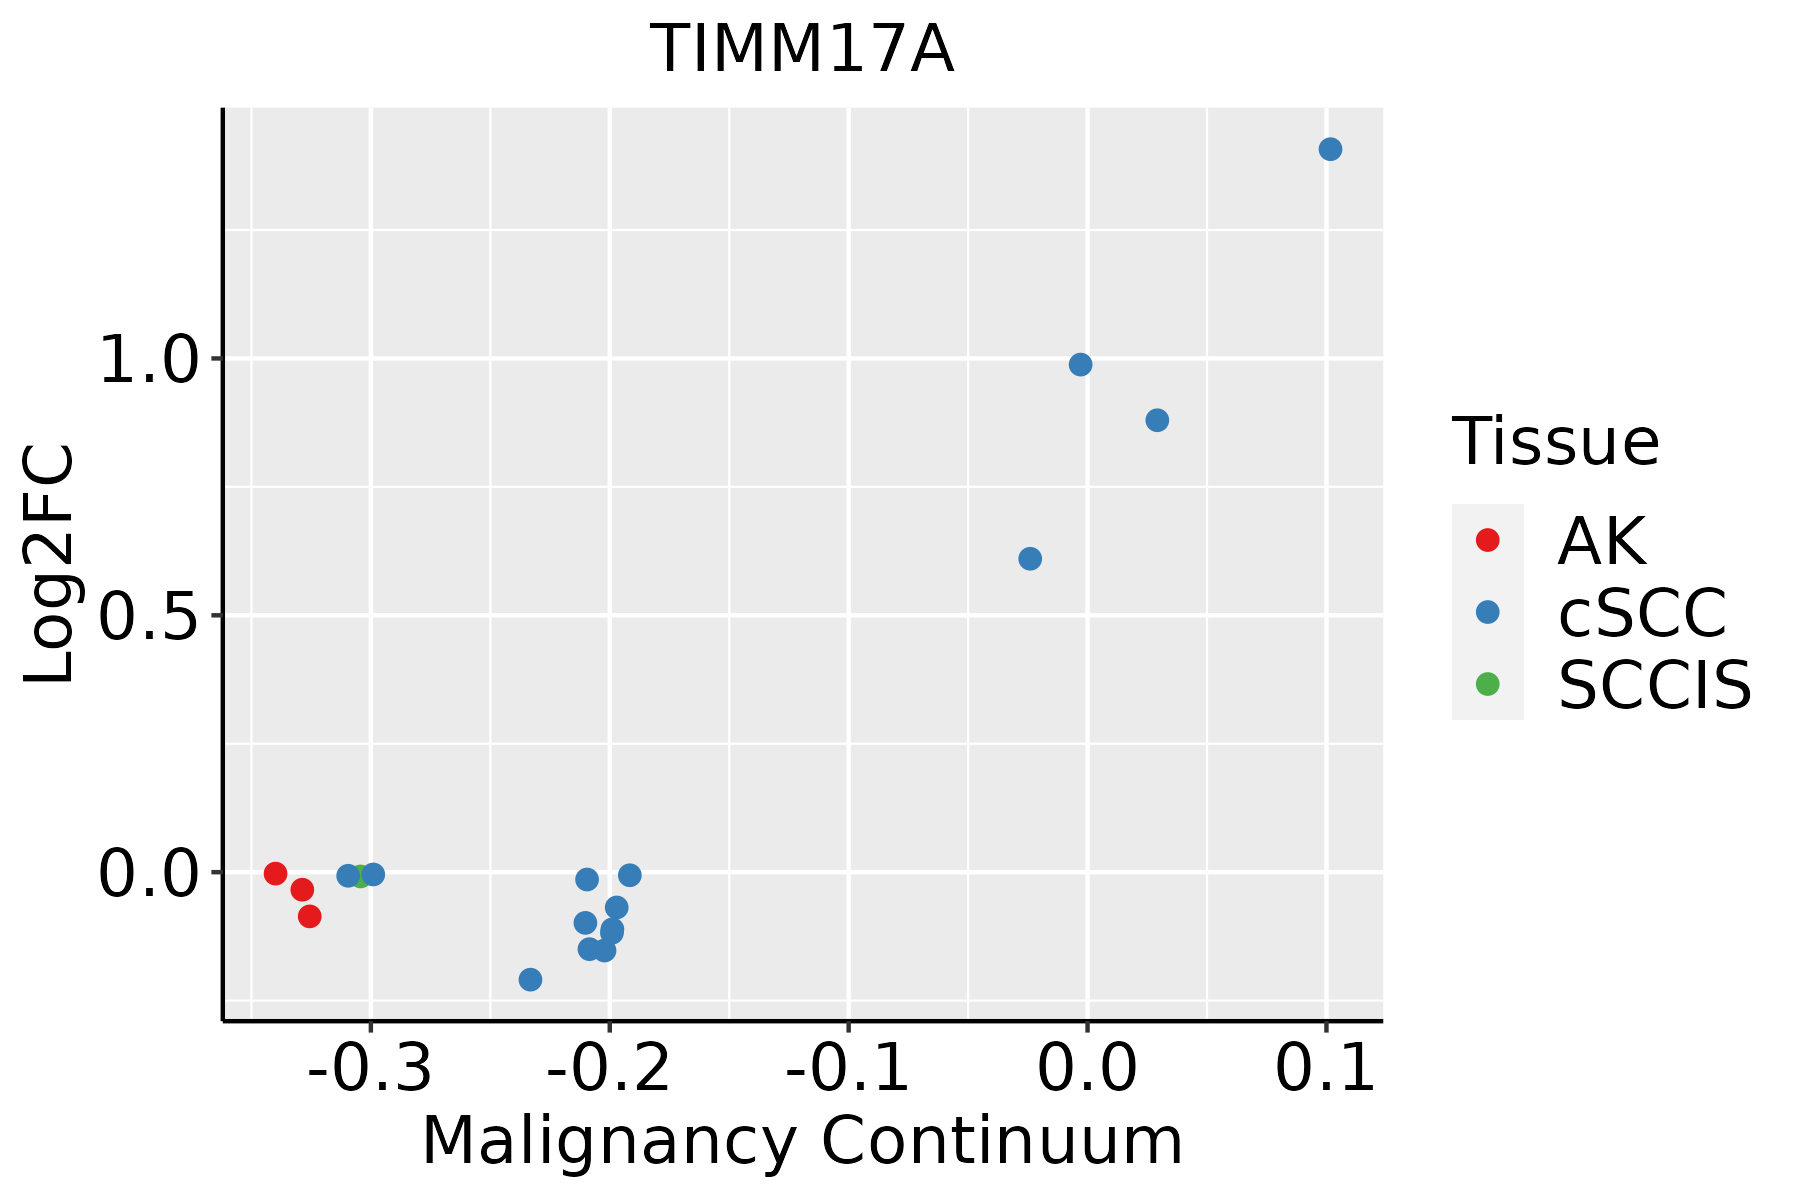 | AK: Actinic keratosis |
| cSCC: Cutaneous squamous cell carcinoma | ||
| SCCIS:squamous cell carcinoma in situ | ||
| Thyroid | 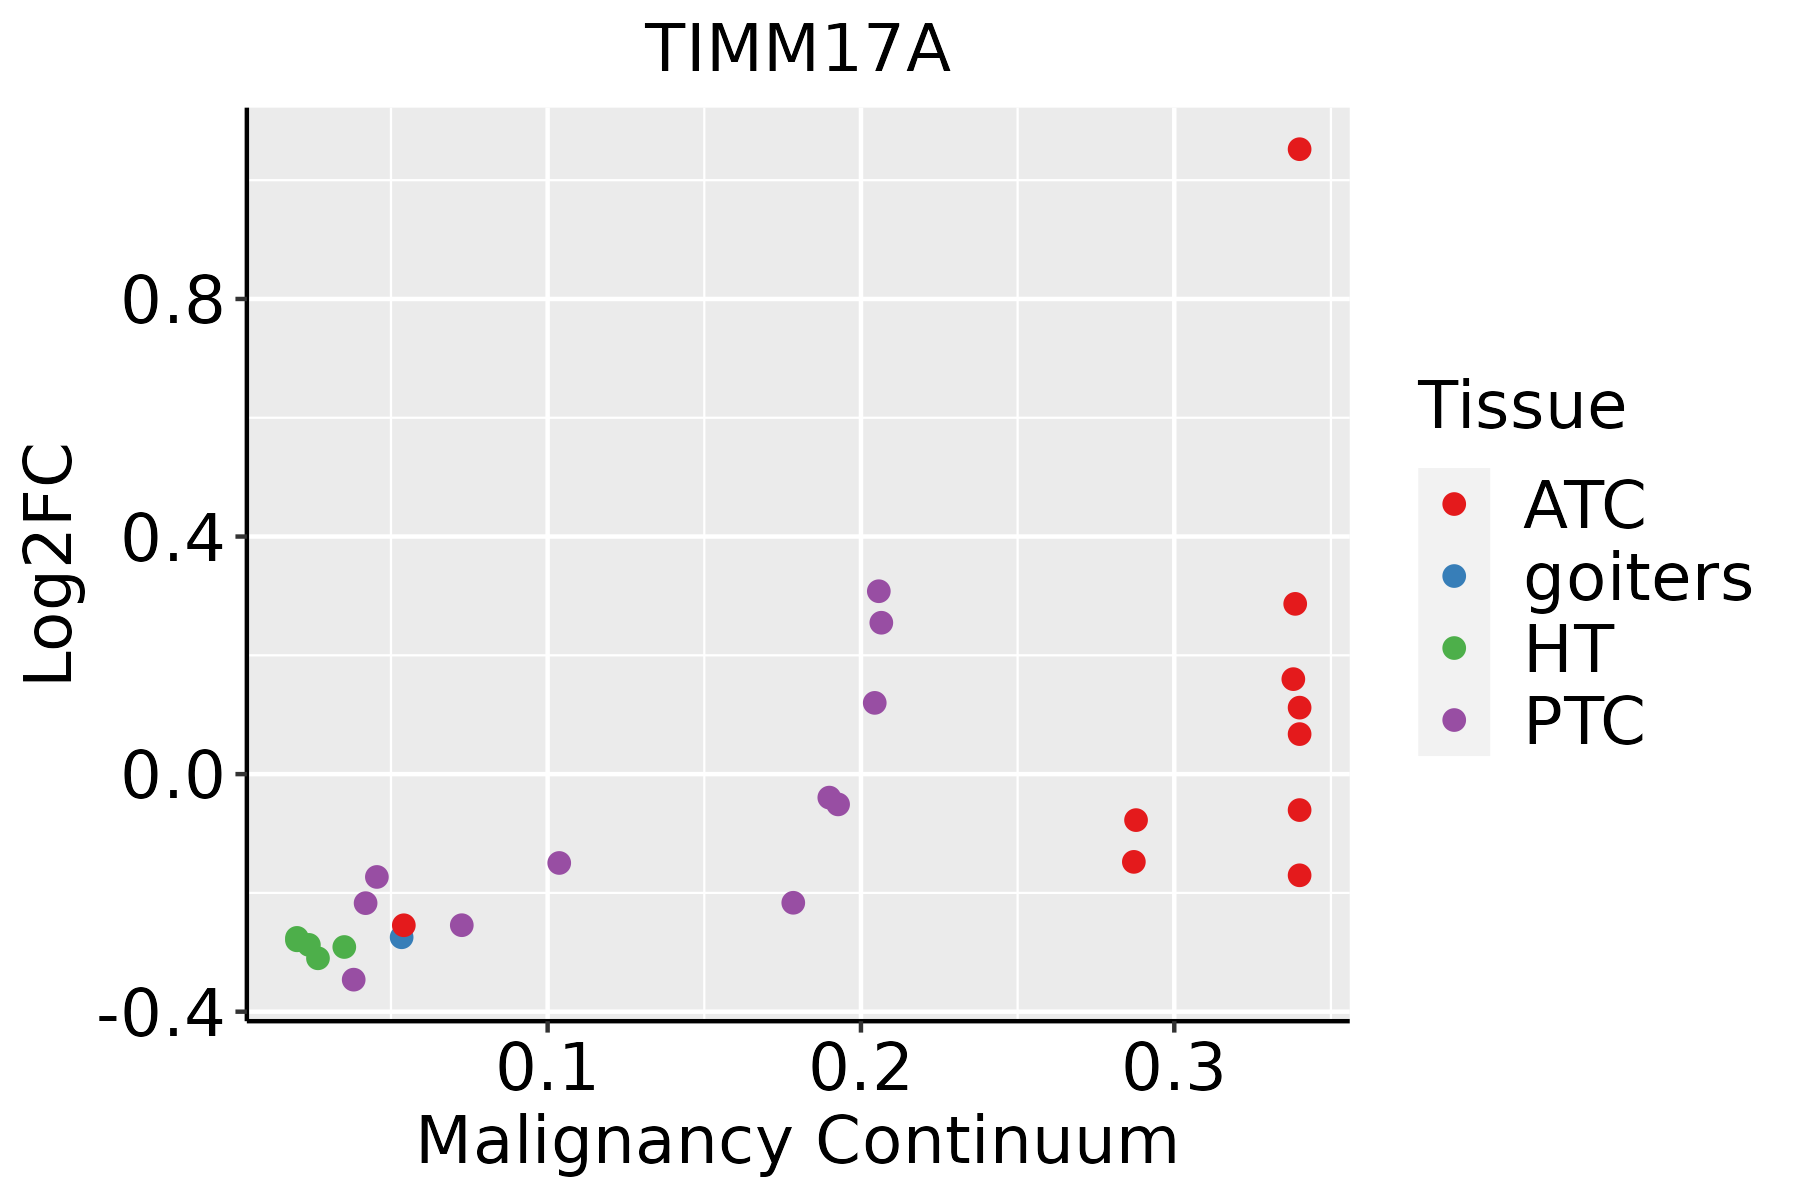 | ATC: Anaplastic thyroid cancer |
| HT: Hashimoto's thyroiditis | ||
| PTC: Papillary thyroid cancer |
| ∗log2FC in expression of this searched gene in stem-like cells from each diseased tissue sample relative to stem-like cells in normal samples in each tissue plotted against the malignancy continuum. Samples are colored based on if they are from different disease stage. |
Top |
Malignant transformation related pathway analysis |
| Find out the enriched GO biological processes and KEGG pathways involved in transition from healthy to precancer to cancer |
| Tissue | Disease Stage | Enriched GO biological Processes |
| Colorectum | AD |  |
| Colorectum | SER |  |
| Colorectum | MSS |  |
| Colorectum | MSI-H |  |
| Colorectum | FAP |  |
| ∗Top 15 enriched GO BP terms are showed in the bar plot of each disease state in each tissue. Each row represents a significant GO biological process which is colored according to the -log10(p.adjust). |
| Page: 1 2 3 4 5 6 7 8 9 |
| GO ID | Tissue | Disease Stage | Description | Gene Ratio | Bg Ratio | pvalue | p.adjust | Count |
| GO:007259420 | Esophagus | HGIN | establishment of protein localization to organelle | 120/2587 | 422/18723 | 1.73e-15 | 4.00e-13 | 120 |
| GO:004586227 | Esophagus | HGIN | positive regulation of proteolysis | 107/2587 | 372/18723 | 2.61e-14 | 4.60e-12 | 107 |
| GO:000683920 | Esophagus | HGIN | mitochondrial transport | 74/2587 | 254/18723 | 1.32e-10 | 1.32e-08 | 74 |
| GO:007058520 | Esophagus | HGIN | protein localization to mitochondrion | 43/2587 | 125/18723 | 4.43e-09 | 3.03e-07 | 43 |
| GO:007265520 | Esophagus | HGIN | establishment of protein localization to mitochondrion | 41/2587 | 120/18723 | 1.26e-08 | 7.96e-07 | 41 |
| GO:000660525 | Esophagus | HGIN | protein targeting | 78/2587 | 314/18723 | 1.08e-07 | 5.47e-06 | 78 |
| GO:000662620 | Esophagus | HGIN | protein targeting to mitochondrion | 33/2587 | 100/18723 | 7.99e-07 | 3.35e-05 | 33 |
| GO:005160417 | Esophagus | HGIN | protein maturation | 68/2587 | 294/18723 | 9.77e-06 | 2.86e-04 | 68 |
| GO:001703817 | Esophagus | HGIN | protein import | 51/2587 | 206/18723 | 1.79e-05 | 4.86e-04 | 51 |
| GO:199054220 | Esophagus | HGIN | mitochondrial transmembrane transport | 29/2587 | 102/18723 | 8.52e-05 | 1.87e-03 | 29 |
| GO:00164857 | Esophagus | HGIN | protein processing | 49/2587 | 225/18723 | 7.04e-04 | 9.52e-03 | 49 |
| GO:19033173 | Esophagus | HGIN | regulation of protein maturation | 18/2587 | 67/18723 | 3.52e-03 | 3.24e-02 | 18 |
| GO:00706133 | Esophagus | HGIN | regulation of protein processing | 17/2587 | 65/18723 | 6.04e-03 | 4.87e-02 | 17 |
| GO:0072594110 | Esophagus | ESCC | establishment of protein localization to organelle | 311/8552 | 422/18723 | 3.02e-32 | 2.13e-29 | 311 |
| GO:0006605111 | Esophagus | ESCC | protein targeting | 229/8552 | 314/18723 | 4.93e-23 | 1.01e-20 | 229 |
| GO:0045862111 | Esophagus | ESCC | positive regulation of proteolysis | 256/8552 | 372/18723 | 7.88e-20 | 9.43e-18 | 256 |
| GO:0006839110 | Esophagus | ESCC | mitochondrial transport | 187/8552 | 254/18723 | 8.35e-20 | 9.81e-18 | 187 |
| GO:0072655110 | Esophagus | ESCC | establishment of protein localization to mitochondrion | 97/8552 | 120/18723 | 2.17e-15 | 1.33e-13 | 97 |
| GO:0070585110 | Esophagus | ESCC | protein localization to mitochondrion | 100/8552 | 125/18723 | 2.96e-15 | 1.77e-13 | 100 |
| GO:001703818 | Esophagus | ESCC | protein import | 149/8552 | 206/18723 | 5.90e-15 | 3.31e-13 | 149 |
| Page: 1 2 3 4 5 6 7 8 9 |
| Pathway ID | Tissue | Disease Stage | Description | Gene Ratio | Bg Ratio | pvalue | p.adjust | qvalue | Count |
| Page: 1 |
Top |
Cell-cell communication analysis |
| Identification of potential cell-cell interactions between two cell types and their ligand-receptor pairs for different disease states |
| Ligand | Receptor | LRpair | Pathway | Tissue | Disease Stage |
| Page: 1 |
Top |
Single-cell gene regulatory network inference analysis |
| Find out the significant the regulons (TFs) and the target genes of each regulon across cell types for different disease states |
| TF | Cell Type | Tissue | Disease Stage | Target Gene | RSS | Regulon Activity |
| ∗The dot plots of a searched regulon are shown for all cell subpopulations in each disease state of each tissue based on the regulon specific score inferred using pySCENIC and by calculating the average expression. |
| Page: 1 |
Top |
Somatic mutation of malignant transformation related genes |
| Annotation of somatic variants for genes involved in malignant transformation |
| Hugo Symbol | Variant Class | Variant Classification | dbSNP RS | HGVSc | HGVSp | HGVSp Short | SWISSPROT | BIOTYPE | SIFT | PolyPhen | Tumor Sample Barcode | Tissue | Histology | Sex | Age | Stage | Therapy Types | Drugs | Outcome |
| TIMM17A | SNV | Missense_Mutation | rs750416279 | c.253G>A | p.Gly85Arg | p.G85R | Q99595 | protein_coding | tolerated(0.36) | benign(0.113) | TCGA-AC-A23H-01 | Breast | breast invasive carcinoma | Female | >=65 | I/II | Unknown | Unknown | PD |
| TIMM17A | SNV | Missense_Mutation | c.17N>C | p.Arg6Pro | p.R6P | Q99595 | protein_coding | deleterious(0.01) | possibly_damaging(0.747) | TCGA-BH-A18K-01 | Breast | breast invasive carcinoma | Female | <65 | I/II | Unknown | Unknown | PD | |
| TIMM17A | SNV | Missense_Mutation | rs756338629 | c.112C>T | p.Arg38Cys | p.R38C | Q99595 | protein_coding | deleterious(0) | probably_damaging(1) | TCGA-2W-A8YY-01 | Cervix | cervical & endocervical cancer | Female | <65 | I/II | Chemotherapy | cisplatin | CR |
| TIMM17A | SNV | Missense_Mutation | c.119N>A | p.Ser40Tyr | p.S40Y | Q99595 | protein_coding | deleterious(0) | possibly_damaging(0.815) | TCGA-AP-A059-01 | Endometrium | uterine corpus endometrioid carcinoma | Female | >=65 | I/II | Unknown | Unknown | SD | |
| TIMM17A | SNV | Missense_Mutation | c.98N>T | p.Ala33Val | p.A33V | Q99595 | protein_coding | tolerated(0.48) | possibly_damaging(0.744) | TCGA-AP-A0LM-01 | Endometrium | uterine corpus endometrioid carcinoma | Female | <65 | III/IV | Chemotherapy | cisplatin | SD | |
| TIMM17A | SNV | Missense_Mutation | rs202092277 | c.386N>T | p.Ala129Val | p.A129V | Q99595 | protein_coding | tolerated(1) | benign(0.017) | TCGA-AP-A1DK-01 | Endometrium | uterine corpus endometrioid carcinoma | Female | <65 | I/II | Unknown | Unknown | SD |
| TIMM17A | SNV | Missense_Mutation | novel | c.140G>T | p.Arg47Ile | p.R47I | Q99595 | protein_coding | deleterious(0.01) | probably_damaging(0.987) | TCGA-AX-A2HC-01 | Endometrium | uterine corpus endometrioid carcinoma | Female | <65 | III/IV | Chemotherapy | paclitaxel | PD |
| TIMM17A | SNV | Missense_Mutation | novel | c.209N>A | p.Gly70Glu | p.G70E | Q99595 | protein_coding | deleterious(0) | probably_damaging(0.998) | TCGA-B5-A0JU-01 | Endometrium | uterine corpus endometrioid carcinoma | Female | <65 | I/II | Unknown | Unknown | SD |
| TIMM17A | SNV | Missense_Mutation | rs756338629 | c.112N>T | p.Arg38Cys | p.R38C | Q99595 | protein_coding | deleterious(0) | probably_damaging(1) | TCGA-B5-A1MR-01 | Endometrium | uterine corpus endometrioid carcinoma | Female | >=65 | III/IV | Unknown | Unknown | SD |
| TIMM17A | SNV | Missense_Mutation | rs757756350 | c.88N>G | p.Ile30Val | p.I30V | Q99595 | protein_coding | tolerated(0.78) | benign(0.026) | TCGA-B5-A3FA-01 | Endometrium | uterine corpus endometrioid carcinoma | Female | >=65 | I/II | Unknown | Unknown | SD |
| Page: 1 2 |
Top |
Related drugs of malignant transformation related genes |
| Identification of chemicals and drugs interact with genes involved in malignant transfromation |
| (DGIdb 4.0) |
| Entrez ID | Symbol | Category | Interaction Types | Drug Claim Name | Drug Name | PMIDs |
| Page: 1 |

Copyright 2023-Present -The University of Texas Health Science Center at Houston |