
|
|||||
|
 | |
| |
| |
| |
| |
| |
|
Gene: SURF4 |
Gene summary for SURF4 |
| Gene information | Species | Human | Gene symbol | SURF4 | Gene ID | 6836 |
| Gene name | surfeit 4 | |
| Gene Alias | ERV29 | |
| Cytomap | 9q34.2 | |
| Gene Type | protein-coding | GO ID | GO:0006996 | UniProtAcc | O15260 |
Top |
Malignant transformation analysis |
| Identification of the aberrant gene expression in precancerous and cancerous lesions by comparing the gene expression of stem-like cells in diseased tissues with normal stem cells |
| Entrez ID | Symbol | Replicates | Species | Organ | Tissue | Adj P-value | Log2FC | Malignancy |
| 6836 | SURF4 | P79T-E | Human | Esophagus | ESCC | 8.57e-55 | 1.01e+00 | 0.1154 |
| 6836 | SURF4 | P80T-E | Human | Esophagus | ESCC | 2.05e-58 | 1.92e+00 | 0.155 |
| 6836 | SURF4 | P82T-E | Human | Esophagus | ESCC | 1.46e-23 | 1.41e+00 | 0.1072 |
| 6836 | SURF4 | P83T-E | Human | Esophagus | ESCC | 5.42e-49 | 1.69e+00 | 0.1738 |
| 6836 | SURF4 | P84T-E | Human | Esophagus | ESCC | 1.30e-11 | 8.90e-01 | 0.0933 |
| 6836 | SURF4 | P89T-E | Human | Esophagus | ESCC | 1.92e-27 | 2.08e+00 | 0.1752 |
| 6836 | SURF4 | P91T-E | Human | Esophagus | ESCC | 8.93e-23 | 2.21e+00 | 0.1828 |
| 6836 | SURF4 | P94T-E | Human | Esophagus | ESCC | 1.15e-03 | 1.19e+00 | 0.0879 |
| 6836 | SURF4 | P107T-E | Human | Esophagus | ESCC | 2.35e-61 | 1.85e+00 | 0.171 |
| 6836 | SURF4 | P126T-E | Human | Esophagus | ESCC | 4.69e-17 | 1.35e+00 | 0.1125 |
| 6836 | SURF4 | P127T-E | Human | Esophagus | ESCC | 1.20e-24 | 2.85e-01 | 0.0826 |
| 6836 | SURF4 | P128T-E | Human | Esophagus | ESCC | 2.09e-37 | 1.22e+00 | 0.1241 |
| 6836 | SURF4 | P130T-E | Human | Esophagus | ESCC | 6.27e-61 | 1.31e+00 | 0.1676 |
| 6836 | SURF4 | HCC1_Meng | Human | Liver | HCC | 7.10e-80 | 1.65e-01 | 0.0246 |
| 6836 | SURF4 | HCC2_Meng | Human | Liver | HCC | 2.29e-42 | 2.75e-01 | 0.0107 |
| 6836 | SURF4 | cirrhotic2 | Human | Liver | Cirrhotic | 2.49e-05 | 1.47e-01 | 0.0201 |
| 6836 | SURF4 | cirrhotic3 | Human | Liver | Cirrhotic | 1.55e-08 | 2.11e-01 | 0.0215 |
| 6836 | SURF4 | HCC1 | Human | Liver | HCC | 7.01e-12 | 4.11e+00 | 0.5336 |
| 6836 | SURF4 | HCC2 | Human | Liver | HCC | 8.39e-12 | 3.21e+00 | 0.5341 |
| 6836 | SURF4 | Pt13.b | Human | Liver | HCC | 9.17e-25 | 3.60e-01 | 0.0251 |
| Page: 1 2 3 4 5 6 7 8 9 |
| Tissue | Expression Dynamics | Abbreviation |
| Colorectum (GSE201348) |  | FAP: Familial adenomatous polyposis |
| CRC: Colorectal cancer | ||
| Colorectum (HTA11) |  | AD: Adenomas |
| SER: Sessile serrated lesions | ||
| MSI-H: Microsatellite-high colorectal cancer | ||
| MSS: Microsatellite stable colorectal cancer | ||
| Endometrium |  | AEH: Atypical endometrial hyperplasia |
| EEC: Endometrioid Cancer | ||
| Esophagus |  | ESCC: Esophageal squamous cell carcinoma |
| HGIN: High-grade intraepithelial neoplasias | ||
| LGIN: Low-grade intraepithelial neoplasias | ||
| Liver |  | HCC: Hepatocellular carcinoma |
| NAFLD: Non-alcoholic fatty liver disease | ||
| Oral Cavity | 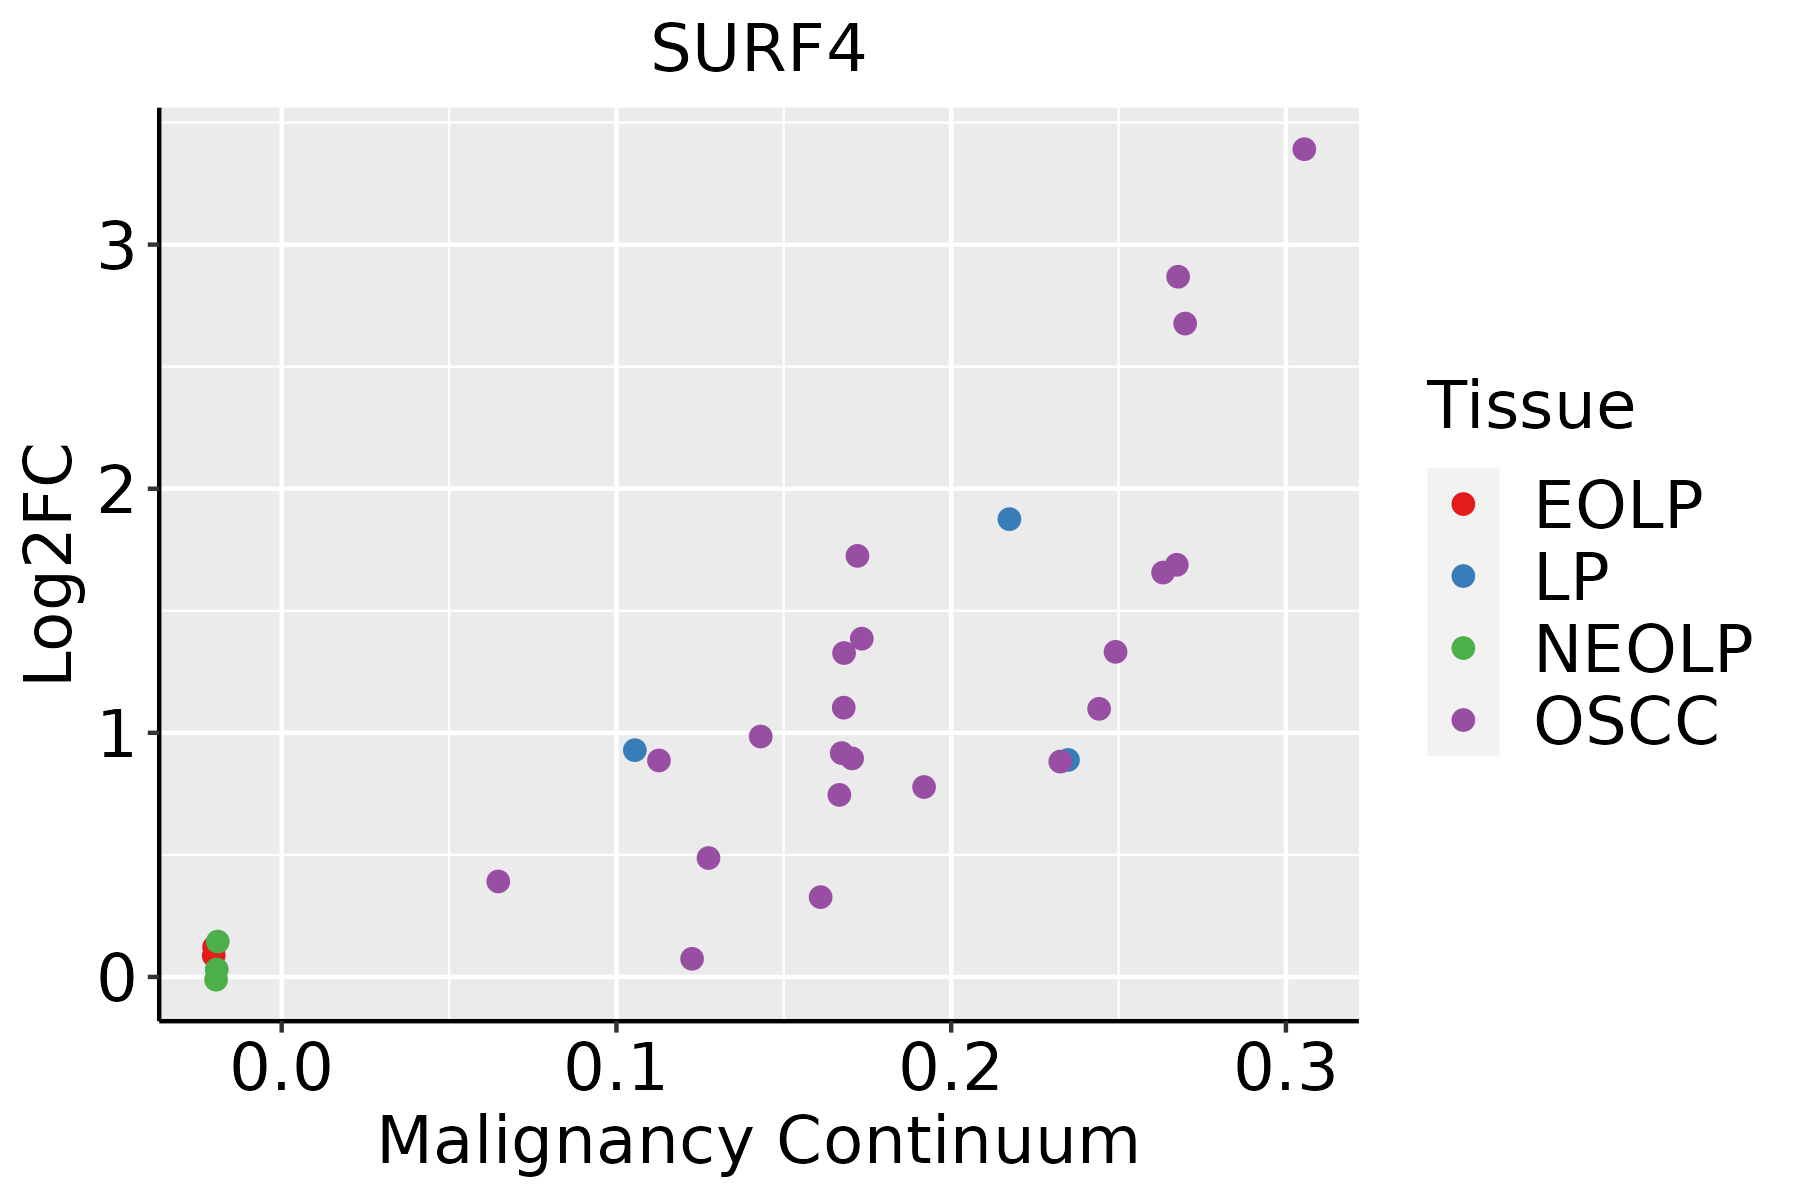 | EOLP: Erosive Oral lichen planus |
| LP: leukoplakia | ||
| NEOLP: Non-erosive oral lichen planus | ||
| OSCC: Oral squamous cell carcinoma | ||
| Skin |  | AK: Actinic keratosis |
| cSCC: Cutaneous squamous cell carcinoma | ||
| SCCIS:squamous cell carcinoma in situ | ||
| Thyroid |  | ATC: Anaplastic thyroid cancer |
| HT: Hashimoto's thyroiditis | ||
| PTC: Papillary thyroid cancer |
| ∗log2FC in expression of this searched gene in stem-like cells from each diseased tissue sample relative to stem-like cells in normal samples in each tissue plotted against the malignancy continuum. Samples are colored based on if they are from different disease stage. |
Top |
Malignant transformation related pathway analysis |
| Find out the enriched GO biological processes and KEGG pathways involved in transition from healthy to precancer to cancer |
| Tissue | Disease Stage | Enriched GO biological Processes |
| Colorectum | AD |  |
| Colorectum | SER |  |
| Colorectum | MSS |  |
| Colorectum | MSI-H |  |
| Colorectum | FAP |  |
| ∗Top 15 enriched GO BP terms are showed in the bar plot of each disease state in each tissue. Each row represents a significant GO biological process which is colored according to the -log10(p.adjust). |
| Page: 1 2 3 4 5 6 7 8 9 |
| GO ID | Tissue | Disease Stage | Description | Gene Ratio | Bg Ratio | pvalue | p.adjust | Count |
| GO:00070305 | Endometrium | AEH | Golgi organization | 32/2100 | 157/18723 | 5.73e-04 | 5.69e-03 | 32 |
| GO:000703012 | Endometrium | EEC | Golgi organization | 32/2168 | 157/18723 | 9.87e-04 | 8.76e-03 | 32 |
| GO:00070308 | Esophagus | ESCC | Golgi organization | 101/8552 | 157/18723 | 1.78e-06 | 2.10e-05 | 101 |
| GO:00070301 | Liver | Cirrhotic | Golgi organization | 68/4634 | 157/18723 | 2.57e-07 | 6.41e-06 | 68 |
| GO:00070302 | Liver | HCC | Golgi organization | 99/7958 | 157/18723 | 1.54e-07 | 2.85e-06 | 99 |
| GO:00070307 | Oral cavity | OSCC | Golgi organization | 92/7305 | 157/18723 | 4.96e-07 | 7.27e-06 | 92 |
| GO:00070309 | Skin | cSCC | Golgi organization | 64/4864 | 157/18723 | 3.53e-05 | 3.83e-04 | 64 |
| GO:000703010 | Thyroid | PTC | Golgi organization | 79/5968 | 157/18723 | 1.11e-06 | 1.64e-05 | 79 |
| GO:000703015 | Thyroid | ATC | Golgi organization | 79/6293 | 157/18723 | 1.07e-05 | 1.05e-04 | 79 |
| Page: 1 |
| Pathway ID | Tissue | Disease Stage | Description | Gene Ratio | Bg Ratio | pvalue | p.adjust | qvalue | Count |
| Page: 1 |
Top |
Cell-cell communication analysis |
| Identification of potential cell-cell interactions between two cell types and their ligand-receptor pairs for different disease states |
| Ligand | Receptor | LRpair | Pathway | Tissue | Disease Stage |
| Page: 1 |
Top |
Single-cell gene regulatory network inference analysis |
| Find out the significant the regulons (TFs) and the target genes of each regulon across cell types for different disease states |
| TF | Cell Type | Tissue | Disease Stage | Target Gene | RSS | Regulon Activity |
| ∗The dot plots of a searched regulon are shown for all cell subpopulations in each disease state of each tissue based on the regulon specific score inferred using pySCENIC and by calculating the average expression. |
| Page: 1 |
Top |
Somatic mutation of malignant transformation related genes |
| Annotation of somatic variants for genes involved in malignant transformation |
| Hugo Symbol | Variant Class | Variant Classification | dbSNP RS | HGVSc | HGVSp | HGVSp Short | SWISSPROT | BIOTYPE | SIFT | PolyPhen | Tumor Sample Barcode | Tissue | Histology | Sex | Age | Stage | Therapy Types | Drugs | Outcome |
| SURF4 | insertion | In_Frame_Ins | novel | c.192_193insGGAACAGAATAT | p.Leu64_Leu65insGlyThrGluTyr | p.L64_L65insGTEY | O15260 | protein_coding | TCGA-A2-A0CT-01 | Breast | breast invasive carcinoma | Female | >=65 | I/II | Chemotherapy | cytoxan | SD | ||
| SURF4 | insertion | Frame_Shift_Ins | novel | c.69_70insGCAAT | p.Tyr24AlafsTer12 | p.Y24Afs*12 | O15260 | protein_coding | TCGA-A8-A085-01 | Breast | breast invasive carcinoma | Male | <65 | I/II | Hormone Therapy | tamoxiphen | SD | ||
| SURF4 | SNV | Missense_Mutation | c.694N>T | p.His232Tyr | p.H232Y | O15260 | protein_coding | tolerated(0.93) | benign(0.017) | TCGA-A6-5661-01 | Colorectum | colon adenocarcinoma | Female | >=65 | I/II | Unknown | Unknown | SD | |
| SURF4 | SNV | Missense_Mutation | c.166N>A | p.Asp56Asn | p.D56N | O15260 | protein_coding | tolerated(0.59) | benign(0.003) | TCGA-AA-3977-01 | Colorectum | colon adenocarcinoma | Male | >=65 | I/II | Unknown | Unknown | SD | |
| SURF4 | SNV | Missense_Mutation | c.712N>A | p.Asp238Asn | p.D238N | O15260 | protein_coding | deleterious(0) | probably_damaging(0.924) | TCGA-AZ-4315-01 | Colorectum | colon adenocarcinoma | Male | <65 | I/II | Unknown | Unknown | SD | |
| SURF4 | SNV | Missense_Mutation | rs782694838 | c.244G>A | p.Val82Ile | p.V82I | O15260 | protein_coding | tolerated(0.73) | benign(0.007) | TCGA-CM-4746-01 | Colorectum | colon adenocarcinoma | Male | <65 | I/II | Unknown | Unknown | SD |
| SURF4 | SNV | Missense_Mutation | rs878915690 | c.404N>A | p.Arg135His | p.R135H | O15260 | protein_coding | tolerated(0.06) | benign(0.086) | TCGA-D5-6530-01 | Colorectum | colon adenocarcinoma | Male | <65 | I/II | Unknown | Unknown | SD |
| SURF4 | SNV | Missense_Mutation | c.649N>A | p.Val217Ile | p.V217I | O15260 | protein_coding | tolerated(0.29) | benign(0.007) | TCGA-A5-A1OF-01 | Endometrium | uterine corpus endometrioid carcinoma | Female | <65 | I/II | Unknown | Unknown | SD | |
| SURF4 | SNV | Missense_Mutation | rs782531163 | c.274N>C | p.Tyr92His | p.Y92H | O15260 | protein_coding | tolerated(0.41) | benign(0.021) | TCGA-AP-A054-01 | Endometrium | uterine corpus endometrioid carcinoma | Female | <65 | III/IV | Chemotherapy | carboplatin | PD |
| SURF4 | SNV | Missense_Mutation | novel | c.88C>T | p.Arg30Cys | p.R30C | O15260 | protein_coding | deleterious(0) | probably_damaging(0.999) | TCGA-AP-A1DR-01 | Endometrium | uterine corpus endometrioid carcinoma | Female | <65 | III/IV | Chemotherapy | cisplatin | SD |
| Page: 1 2 3 |
Top |
Related drugs of malignant transformation related genes |
| Identification of chemicals and drugs interact with genes involved in malignant transfromation |
| (DGIdb 4.0) |
| Entrez ID | Symbol | Category | Interaction Types | Drug Claim Name | Drug Name | PMIDs |
| Page: 1 |

Copyright 2023-Present -The University of Texas Health Science Center at Houston |