
|
|||||
|
 | |
| |
| |
| |
| |
| |
|
Gene: SLC50A1 |
Gene summary for SLC50A1 |
| Gene information | Species | Human | Gene symbol | SLC50A1 | Gene ID | 55974 |
| Gene name | solute carrier family 50 member 1 | |
| Gene Alias | HsSWEET1 | |
| Cytomap | 1q22 | |
| Gene Type | protein-coding | GO ID | GO:0006810 | UniProtAcc | Q9BRV3 |
Top |
Malignant transformation analysis |
| Identification of the aberrant gene expression in precancerous and cancerous lesions by comparing the gene expression of stem-like cells in diseased tissues with normal stem cells |
| Entrez ID | Symbol | Replicates | Species | Organ | Tissue | Adj P-value | Log2FC | Malignancy |
| 55974 | SLC50A1 | LN22 | Human | Oral cavity | OSCC | 1.35e-07 | 6.95e-01 | 0.1733 |
| 55974 | SLC50A1 | LN46 | Human | Oral cavity | OSCC | 1.19e-13 | 6.90e-01 | 0.1666 |
| 55974 | SLC50A1 | LP15 | Human | Oral cavity | LP | 3.46e-17 | 4.01e+00 | 0.2174 |
| 55974 | SLC50A1 | SYSMH1 | Human | Oral cavity | OSCC | 1.93e-09 | 3.41e-01 | 0.1127 |
| 55974 | SLC50A1 | SYSMH2 | Human | Oral cavity | OSCC | 9.40e-26 | 7.42e-01 | 0.2326 |
| 55974 | SLC50A1 | SYSMH3 | Human | Oral cavity | OSCC | 6.74e-09 | 4.00e-01 | 0.2442 |
| 55974 | SLC50A1 | SYSMH5 | Human | Oral cavity | OSCC | 9.52e-04 | 2.46e-01 | 0.0647 |
| 55974 | SLC50A1 | SYSMH6 | Human | Oral cavity | OSCC | 4.06e-03 | 2.39e-01 | 0.1275 |
| 55974 | SLC50A1 | P1_cSCC | Human | Skin | cSCC | 1.01e-11 | 4.86e-01 | 0.0292 |
| 55974 | SLC50A1 | P2_cSCC | Human | Skin | cSCC | 5.46e-10 | 3.91e-01 | -0.024 |
| 55974 | SLC50A1 | P4_cSCC | Human | Skin | cSCC | 4.42e-17 | 4.34e-01 | -0.00290000000000005 |
| 55974 | SLC50A1 | P10_cSCC | Human | Skin | cSCC | 1.85e-12 | 4.34e-01 | 0.1017 |
| 55974 | SLC50A1 | cSCC_p8 | Human | Skin | cSCC | 1.32e-02 | 4.97e-02 | -0.1971 |
| 55974 | SLC50A1 | male-WTA | Human | Thyroid | PTC | 1.18e-28 | 2.95e-01 | 0.1037 |
| 55974 | SLC50A1 | PTC01 | Human | Thyroid | PTC | 8.12e-10 | 2.21e-01 | 0.1899 |
| 55974 | SLC50A1 | PTC04 | Human | Thyroid | PTC | 1.15e-08 | 2.04e-01 | 0.1927 |
| 55974 | SLC50A1 | PTC05 | Human | Thyroid | PTC | 1.82e-15 | 6.56e-01 | 0.2065 |
| 55974 | SLC50A1 | PTC06 | Human | Thyroid | PTC | 4.70e-21 | 6.64e-01 | 0.2057 |
| 55974 | SLC50A1 | PTC07 | Human | Thyroid | PTC | 1.98e-29 | 5.26e-01 | 0.2044 |
| 55974 | SLC50A1 | ATC09 | Human | Thyroid | ATC | 6.87e-11 | 4.02e-01 | 0.2871 |
| Page: 1 2 3 4 5 6 7 |
| Tissue | Expression Dynamics | Abbreviation |
| Colorectum (GSE201348) | 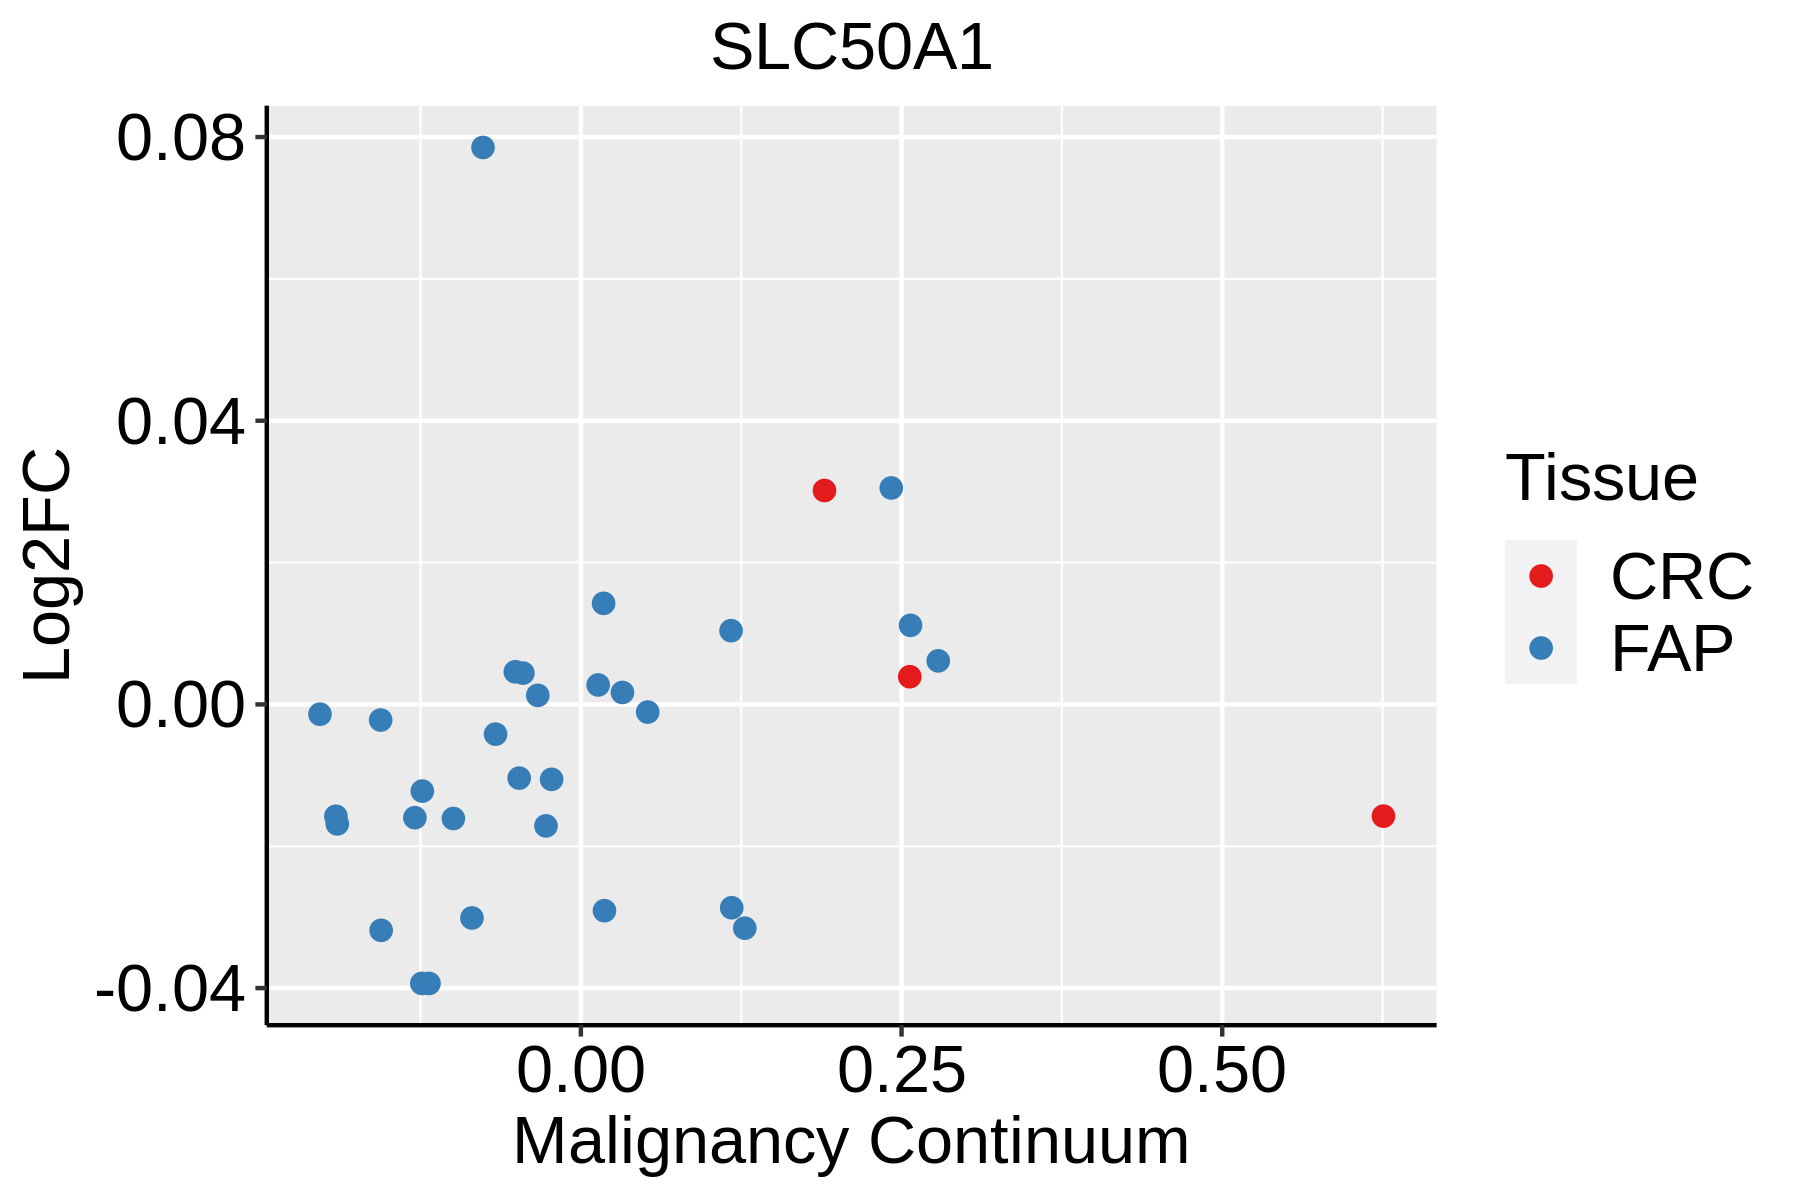 | FAP: Familial adenomatous polyposis |
| CRC: Colorectal cancer | ||
| Colorectum (HTA11) |  | AD: Adenomas |
| SER: Sessile serrated lesions | ||
| MSI-H: Microsatellite-high colorectal cancer | ||
| MSS: Microsatellite stable colorectal cancer | ||
| Esophagus | 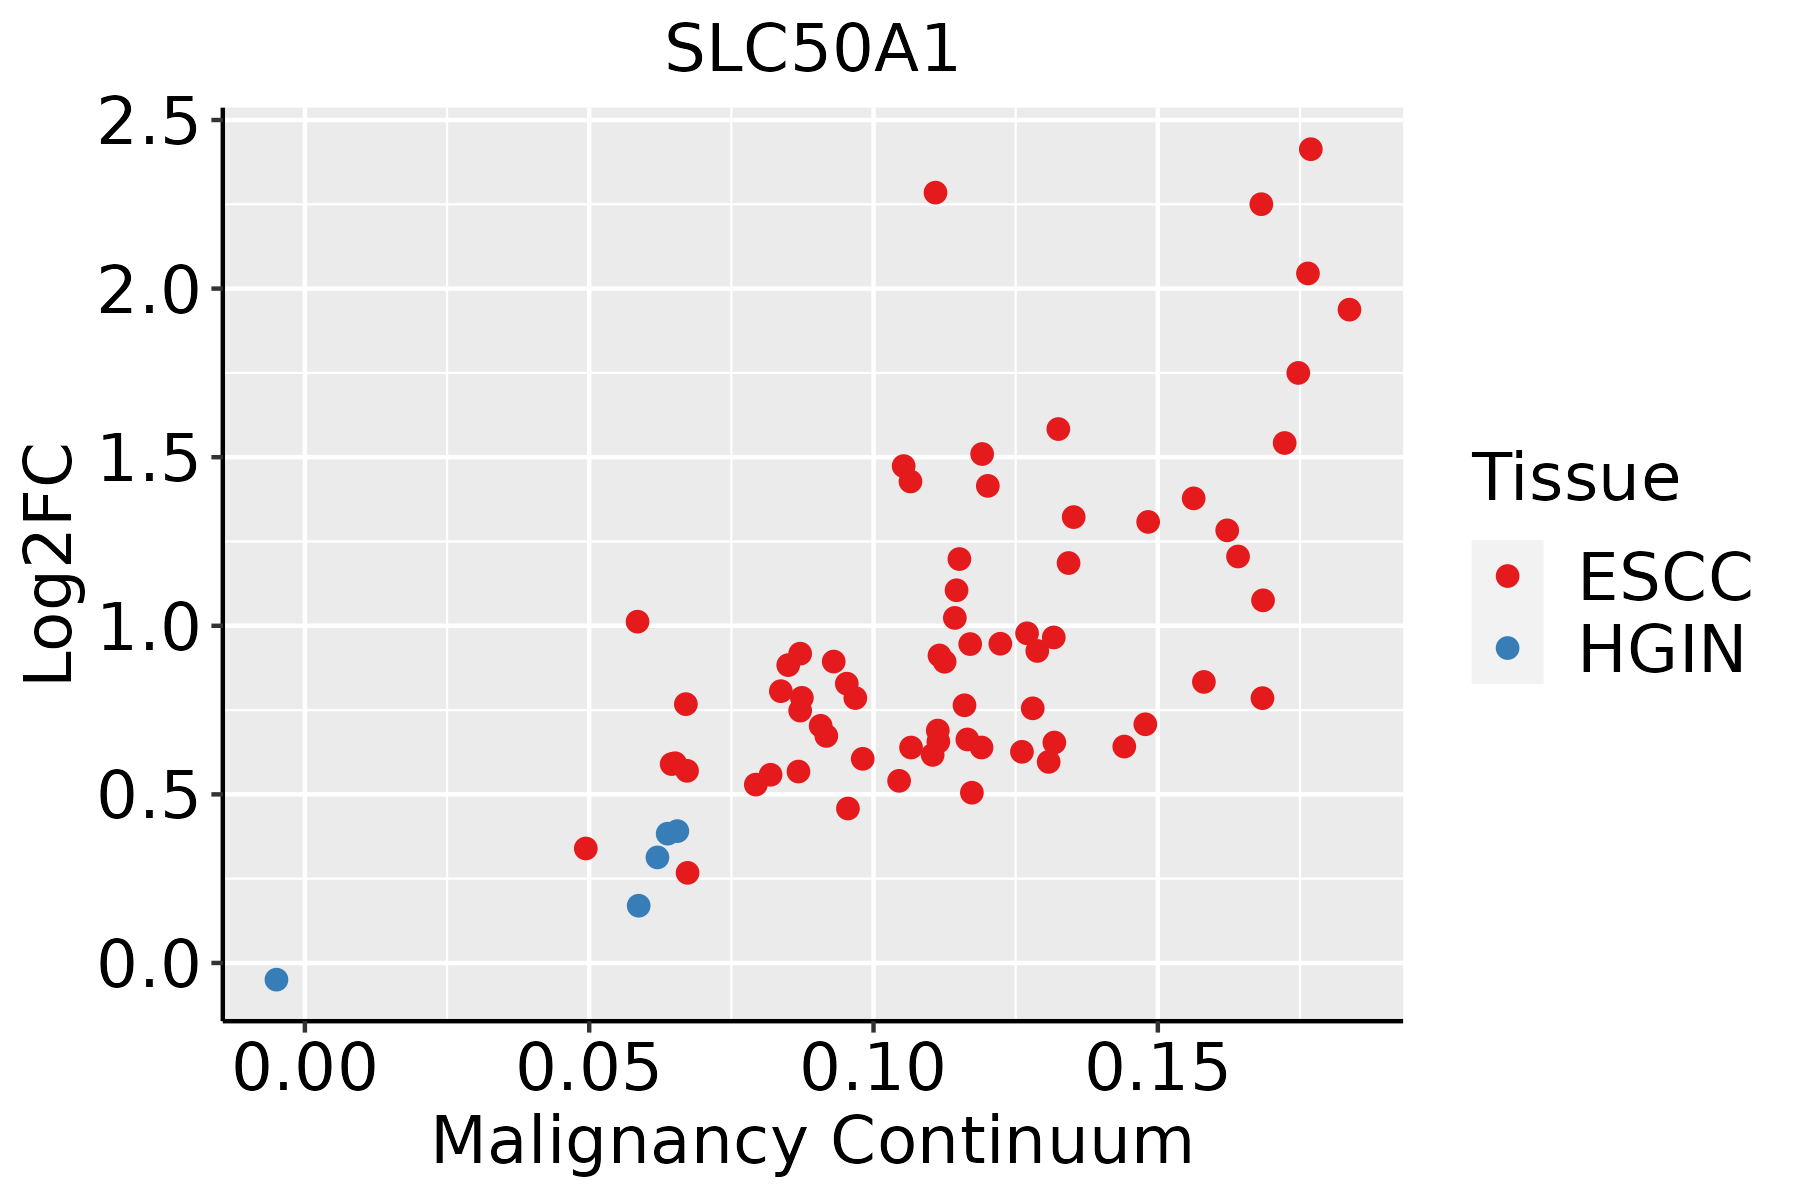 | ESCC: Esophageal squamous cell carcinoma |
| HGIN: High-grade intraepithelial neoplasias | ||
| LGIN: Low-grade intraepithelial neoplasias | ||
| Liver | 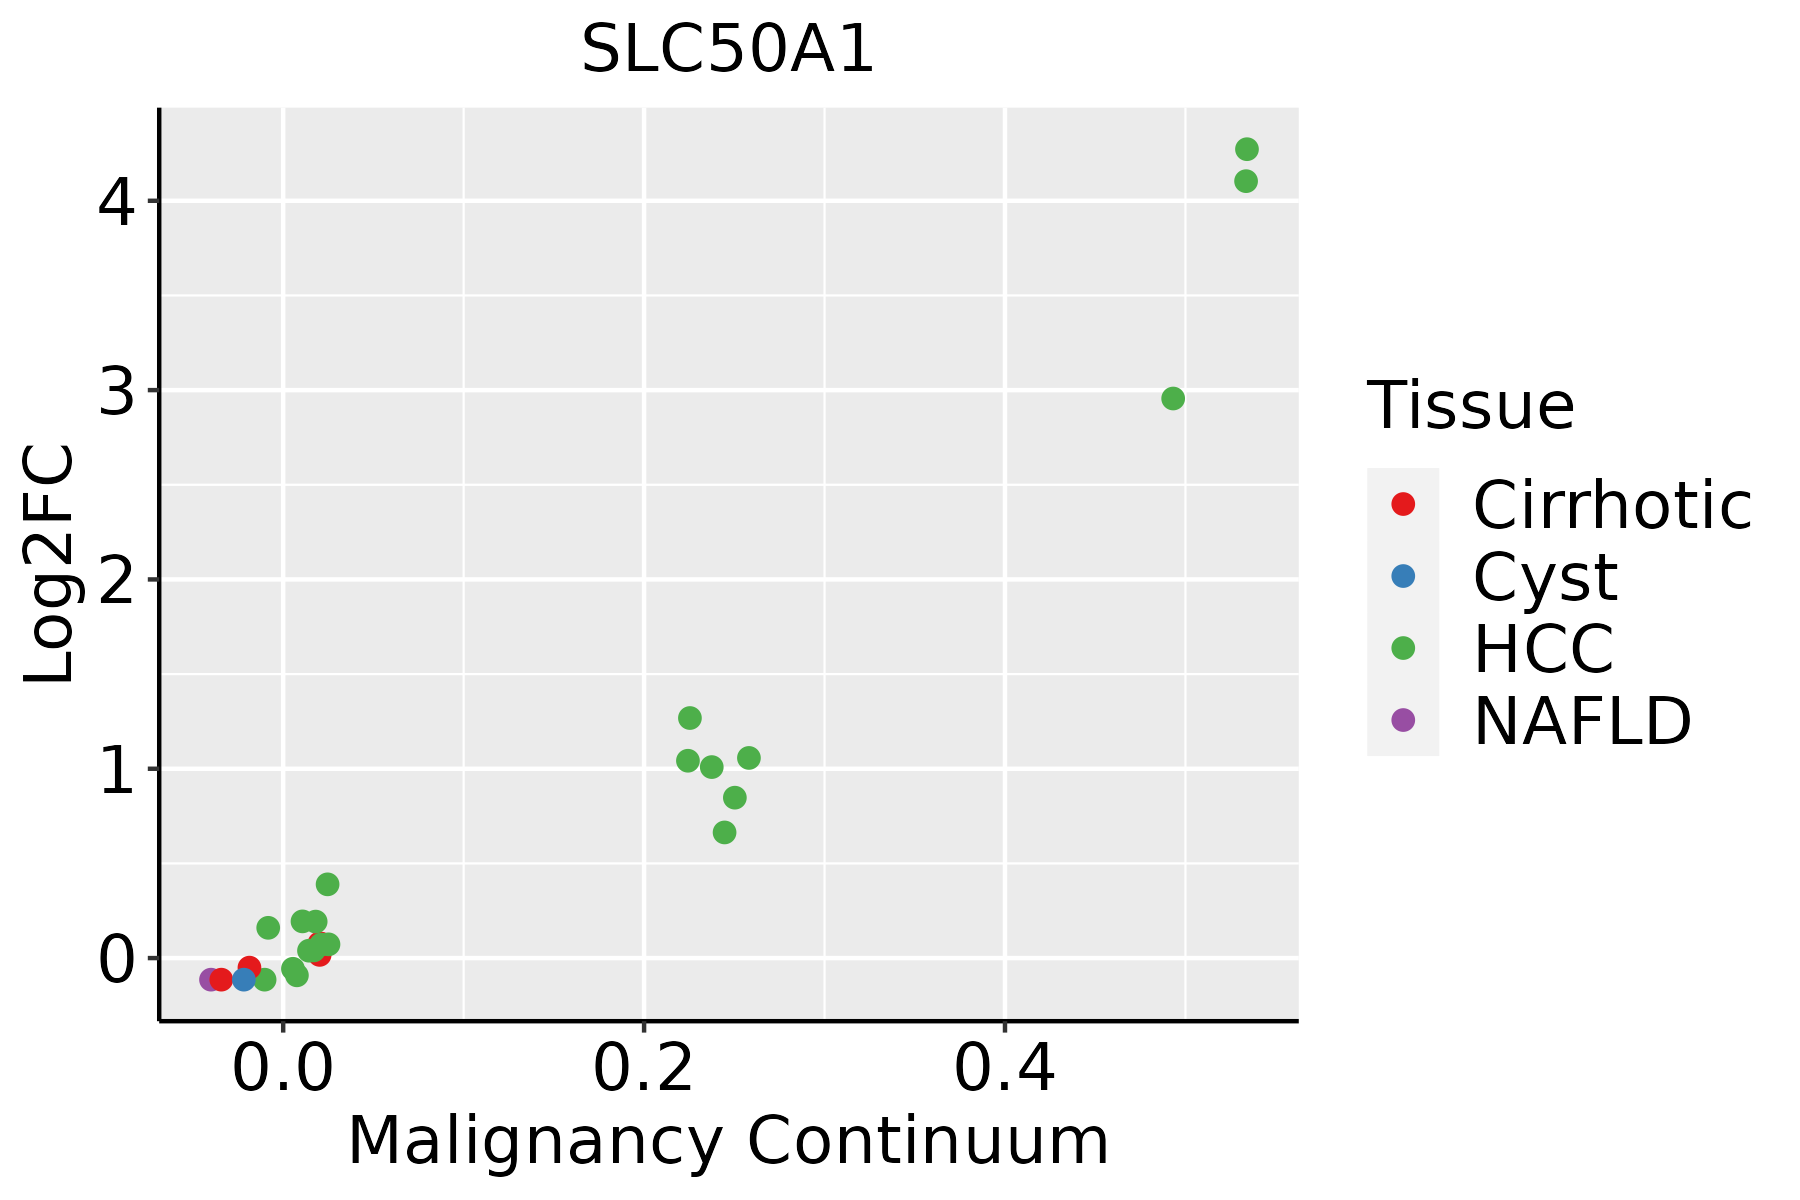 | HCC: Hepatocellular carcinoma |
| NAFLD: Non-alcoholic fatty liver disease | ||
| Oral Cavity | 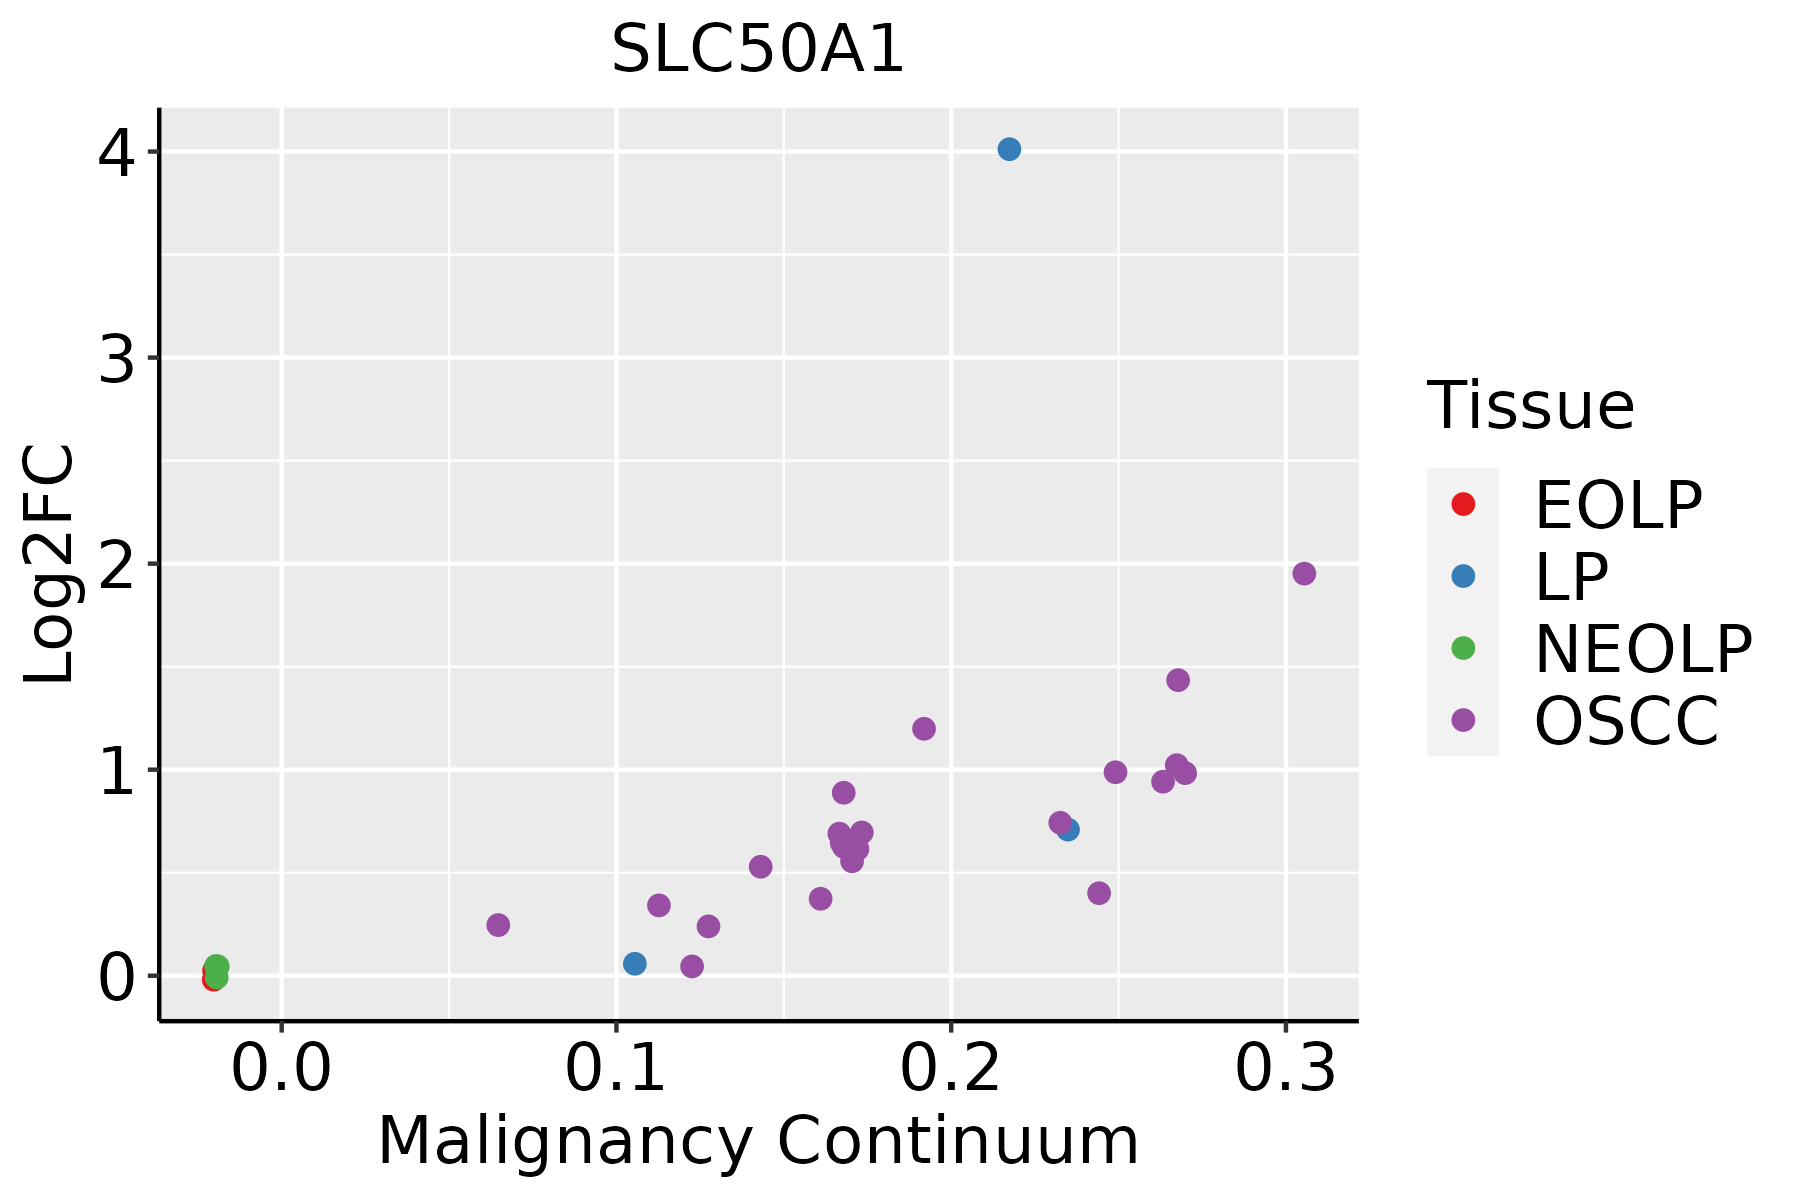 | EOLP: Erosive Oral lichen planus |
| LP: leukoplakia | ||
| NEOLP: Non-erosive oral lichen planus | ||
| OSCC: Oral squamous cell carcinoma | ||
| Skin | 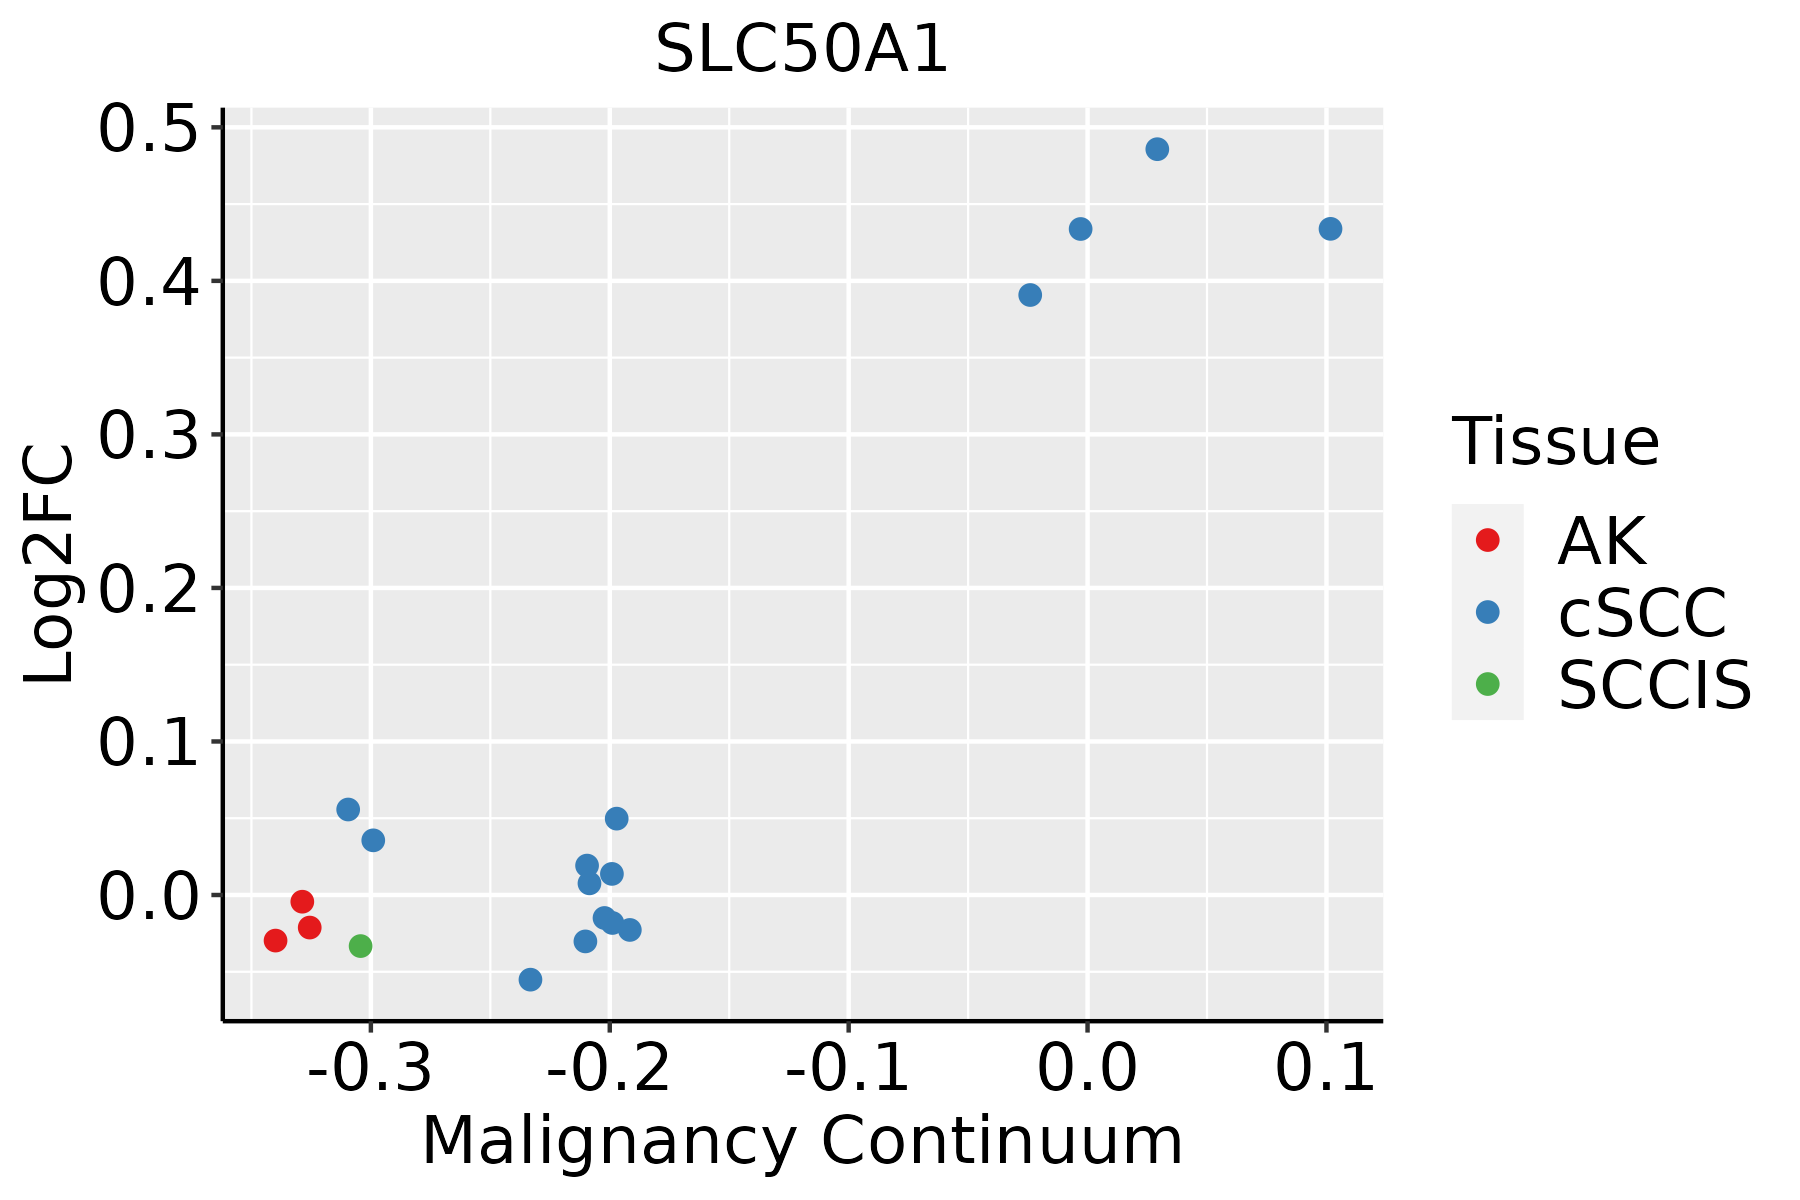 | AK: Actinic keratosis |
| cSCC: Cutaneous squamous cell carcinoma | ||
| SCCIS:squamous cell carcinoma in situ | ||
| Thyroid | 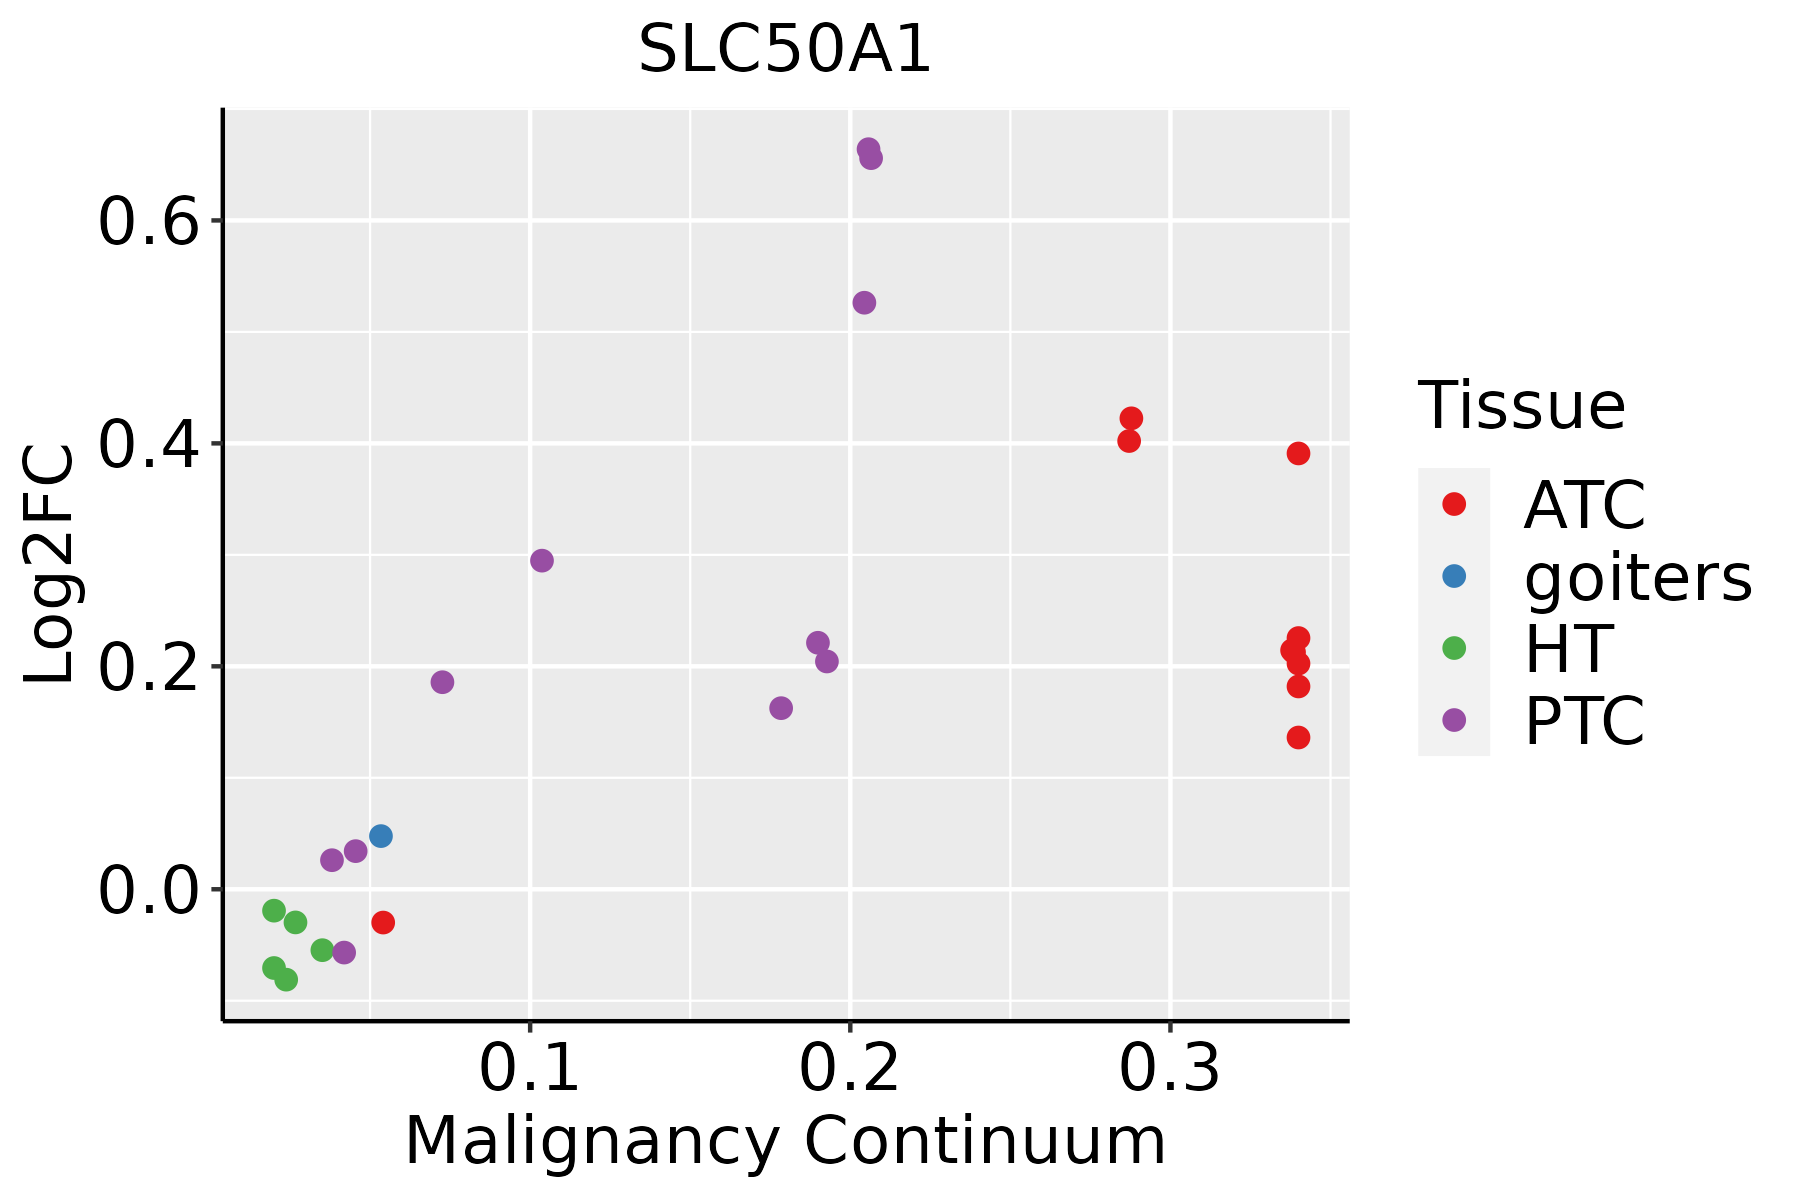 | ATC: Anaplastic thyroid cancer |
| HT: Hashimoto's thyroiditis | ||
| PTC: Papillary thyroid cancer |
| ∗log2FC in expression of this searched gene in stem-like cells from each diseased tissue sample relative to stem-like cells in normal samples in each tissue plotted against the malignancy continuum. Samples are colored based on if they are from different disease stage. |
Top |
Malignant transformation related pathway analysis |
| Find out the enriched GO biological processes and KEGG pathways involved in transition from healthy to precancer to cancer |
| Tissue | Disease Stage | Enriched GO biological Processes |
| Colorectum | AD |  |
| Colorectum | SER |  |
| Colorectum | MSS |  |
| Colorectum | MSI-H |  |
| Colorectum | FAP |  |
| ∗Top 15 enriched GO BP terms are showed in the bar plot of each disease state in each tissue. Each row represents a significant GO biological process which is colored according to the -log10(p.adjust). |
| Page: 1 2 3 4 5 6 7 8 9 |
| GO ID | Tissue | Disease Stage | Description | Gene Ratio | Bg Ratio | pvalue | p.adjust | Count |
| GO:1901264 | Liver | HCC | carbohydrate derivative transport | 48/7958 | 80/18723 | 1.19e-03 | 6.62e-03 | 48 |
| GO:0008643 | Liver | HCC | carbohydrate transport | 80/7958 | 152/18723 | 7.34e-03 | 2.92e-02 | 80 |
| GO:19012642 | Oral cavity | OSCC | carbohydrate derivative transport | 44/7305 | 80/18723 | 2.67e-03 | 1.16e-02 | 44 |
| GO:19012641 | Oral cavity | LP | carbohydrate derivative transport | 31/4623 | 80/18723 | 3.69e-03 | 2.44e-02 | 31 |
| Page: 1 |
| Pathway ID | Tissue | Disease Stage | Description | Gene Ratio | Bg Ratio | pvalue | p.adjust | qvalue | Count |
| Page: 1 |
Top |
Cell-cell communication analysis |
| Identification of potential cell-cell interactions between two cell types and their ligand-receptor pairs for different disease states |
| Ligand | Receptor | LRpair | Pathway | Tissue | Disease Stage |
| Page: 1 |
Top |
Single-cell gene regulatory network inference analysis |
| Find out the significant the regulons (TFs) and the target genes of each regulon across cell types for different disease states |
| TF | Cell Type | Tissue | Disease Stage | Target Gene | RSS | Regulon Activity |
| ∗The dot plots of a searched regulon are shown for all cell subpopulations in each disease state of each tissue based on the regulon specific score inferred using pySCENIC and by calculating the average expression. |
| Page: 1 |
Top |
Somatic mutation of malignant transformation related genes |
| Annotation of somatic variants for genes involved in malignant transformation |
| Hugo Symbol | Variant Class | Variant Classification | dbSNP RS | HGVSc | HGVSp | HGVSp Short | SWISSPROT | BIOTYPE | SIFT | PolyPhen | Tumor Sample Barcode | Tissue | Histology | Sex | Age | Stage | Therapy Types | Drugs | Outcome |
| SLC50A1 | SNV | Missense_Mutation | c.415N>C | p.Ser139Arg | p.S139R | Q9BRV3 | protein_coding | deleterious(0.03) | possibly_damaging(0.532) | TCGA-AO-A128-01 | Breast | breast invasive carcinoma | Female | <65 | I/II | Chemotherapy | doxorubicin | SD | |
| SLC50A1 | SNV | Missense_Mutation | novel | c.262N>G | p.Leu88Val | p.L88V | Q9BRV3 | protein_coding | tolerated(0.13) | benign(0.013) | TCGA-E9-A5FL-01 | Breast | breast invasive carcinoma | Female | >=65 | I/II | Unknown | Unknown | SD |
| SLC50A1 | SNV | Missense_Mutation | novel | c.414N>G | p.Ile138Met | p.I138M | Q9BRV3 | protein_coding | deleterious(0.04) | possibly_damaging(0.672) | TCGA-EK-A2R8-01 | Cervix | cervical & endocervical cancer | Female | <65 | I/II | Unknown | Unknown | SD |
| SLC50A1 | SNV | Missense_Mutation | c.320N>C | p.Val107Ala | p.V107A | Q9BRV3 | protein_coding | tolerated(0.13) | benign(0.003) | TCGA-AA-3815-01 | Colorectum | colon adenocarcinoma | Female | >=65 | I/II | Unknown | Unknown | SD | |
| SLC50A1 | SNV | Missense_Mutation | novel | c.623N>G | p.Tyr208Cys | p.Y208C | Q9BRV3 | protein_coding | deleterious(0) | probably_damaging(0.999) | TCGA-AX-A06F-01 | Endometrium | uterine corpus endometrioid carcinoma | Female | <65 | III/IV | Chemotherapy | carboplatin | SD |
| SLC50A1 | SNV | Missense_Mutation | rs199532576 | c.586G>A | p.Val196Ile | p.V196I | Q9BRV3 | protein_coding | tolerated(0.54) | benign(0.021) | TCGA-B5-A3FC-01 | Endometrium | uterine corpus endometrioid carcinoma | Female | <65 | I/II | Unknown | Unknown | SD |
| SLC50A1 | SNV | Missense_Mutation | rs758705595 | c.7N>A | p.Ala3Thr | p.A3T | Q9BRV3 | protein_coding | tolerated_low_confidence(0.18) | benign(0.005) | TCGA-D1-A2G0-01 | Endometrium | uterine corpus endometrioid carcinoma | Female | >=65 | I/II | Unknown | Unknown | SD |
| SLC50A1 | SNV | Missense_Mutation | novel | c.105N>A | p.Met35Ile | p.M35I | Q9BRV3 | protein_coding | tolerated(0.19) | benign(0.1) | TCGA-D1-A2G0-01 | Endometrium | uterine corpus endometrioid carcinoma | Female | >=65 | I/II | Unknown | Unknown | SD |
| SLC50A1 | SNV | Missense_Mutation | novel | c.65N>C | p.Met22Thr | p.M22T | Q9BRV3 | protein_coding | deleterious(0) | probably_damaging(0.986) | TCGA-DI-A1BU-01 | Endometrium | uterine corpus endometrioid carcinoma | Female | <65 | I/II | Chemotherapy | paclitaxel | SD |
| SLC50A1 | SNV | Missense_Mutation | rs775148763 | c.542N>A | p.Arg181Gln | p.R181Q | Q9BRV3 | protein_coding | tolerated(0.66) | benign(0) | TCGA-EO-A22R-01 | Endometrium | uterine corpus endometrioid carcinoma | Female | <65 | I/II | Unknown | Unknown | SD |
| Page: 1 2 |
Top |
Related drugs of malignant transformation related genes |
| Identification of chemicals and drugs interact with genes involved in malignant transfromation |
| (DGIdb 4.0) |
| Entrez ID | Symbol | Category | Interaction Types | Drug Claim Name | Drug Name | PMIDs |
| Page: 1 |

Copyright 2023-Present -The University of Texas Health Science Center at Houston |