
|
|||||
|
 | |
| |
| |
| |
| |
| |
|
Gene: SIK3 |
Gene summary for SIK3 |
| Gene information | Species | Human | Gene symbol | SIK3 | Gene ID | 23387 |
| Gene name | SIK family kinase 3 | |
| Gene Alias | L19 | |
| Cytomap | 11q23.3 | |
| Gene Type | protein-coding | GO ID | GO:0000226 | UniProtAcc | A1A5A9 |
Top |
Malignant transformation analysis |
| Identification of the aberrant gene expression in precancerous and cancerous lesions by comparing the gene expression of stem-like cells in diseased tissues with normal stem cells |
| Entrez ID | Symbol | Replicates | Species | Organ | Tissue | Adj P-value | Log2FC | Malignancy |
| 23387 | SIK3 | RNA-P25T1-P25T1-1 | Human | Lung | AIS | 1.70e-24 | 9.11e-01 | -0.2116 |
| 23387 | SIK3 | RNA-P25T1-P25T1-2 | Human | Lung | AIS | 2.35e-08 | 8.88e-01 | -0.1941 |
| 23387 | SIK3 | RNA-P25T1-P25T1-3 | Human | Lung | AIS | 4.22e-12 | 9.17e-01 | -0.2107 |
| 23387 | SIK3 | RNA-P25T1-P25T1-4 | Human | Lung | AIS | 3.66e-19 | 9.88e-01 | -0.2119 |
| 23387 | SIK3 | RNA-P3T-P3T-1 | Human | Lung | IAC | 6.22e-09 | 7.85e-01 | 0.1829 |
| 23387 | SIK3 | RNA-P3T-P3T-2 | Human | Lung | IAC | 2.53e-11 | 8.61e-01 | 0.1835 |
| 23387 | SIK3 | RNA-P3T-P3T-4 | Human | Lung | IAC | 5.94e-11 | 8.03e-01 | 0.1859 |
| 23387 | SIK3 | RNA-P5T2-P5T2-1 | Human | Lung | MIAC | 5.66e-07 | 1.44e+00 | -0.0135 |
| 23387 | SIK3 | RNA-P5T2-P5T2-3 | Human | Lung | MIAC | 1.41e-03 | 1.36e+00 | 0.0176 |
| 23387 | SIK3 | RNA-P6T1-P6T1-1 | Human | Lung | MIAC | 5.37e-08 | 1.12e+00 | -0.0238 |
| 23387 | SIK3 | RNA-P6T1-P6T1-2 | Human | Lung | MIAC | 1.43e-03 | 8.40e-01 | -0.0186 |
| 23387 | SIK3 | RNA-P6T1-P6T1-3 | Human | Lung | MIAC | 8.38e-08 | 1.18e+00 | -0.0296 |
| 23387 | SIK3 | RNA-P6T1-P6T1-4 | Human | Lung | MIAC | 6.71e-08 | 9.41e-01 | -0.0263 |
| 23387 | SIK3 | RNA-P6T2-P6T2-1 | Human | Lung | IAC | 1.21e-31 | 8.61e-01 | -0.0166 |
| 23387 | SIK3 | RNA-P6T2-P6T2-2 | Human | Lung | IAC | 3.07e-41 | 9.82e-01 | -0.0132 |
| 23387 | SIK3 | RNA-P6T2-P6T2-3 | Human | Lung | IAC | 6.38e-43 | 9.81e-01 | -0.013 |
| 23387 | SIK3 | RNA-P6T2-P6T2-4 | Human | Lung | IAC | 1.98e-38 | 9.94e-01 | -0.0121 |
| 23387 | SIK3 | RNA-P7T1-P7T1-1 | Human | Lung | AIS | 2.37e-08 | 8.61e-01 | -0.0961 |
| 23387 | SIK3 | RNA-P7T1-P7T1-2 | Human | Lung | AIS | 9.67e-09 | 7.44e-01 | -0.0876 |
| 23387 | SIK3 | RNA-P7T1-P7T1-3 | Human | Lung | AIS | 5.20e-07 | 7.67e-01 | -0.0822 |
| Page: 1 2 3 4 5 6 7 8 9 10 |
| Tissue | Expression Dynamics | Abbreviation |
| Cervix | 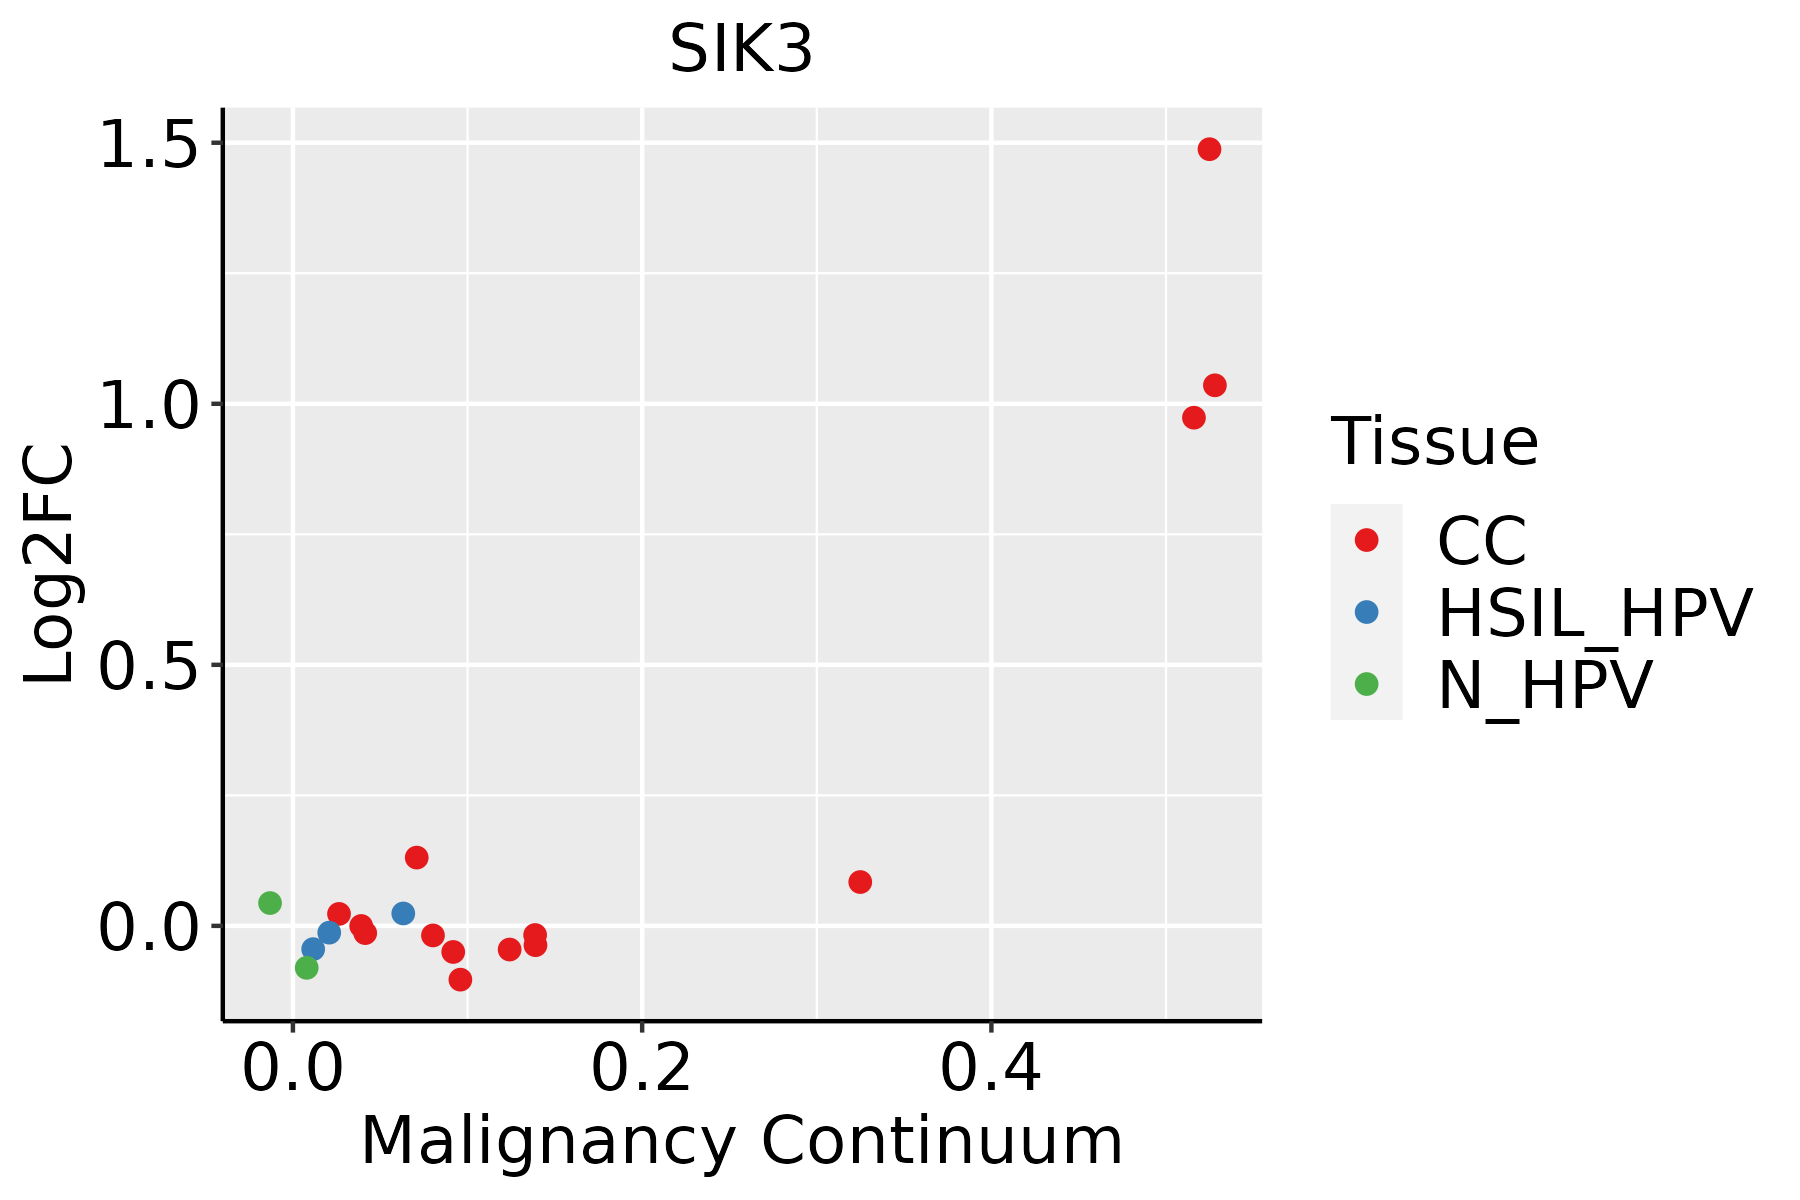 | CC: Cervix cancer |
| HSIL_HPV: HPV-infected high-grade squamous intraepithelial lesions | ||
| N_HPV: HPV-infected normal cervix | ||
| Colorectum (GSE201348) |  | FAP: Familial adenomatous polyposis |
| CRC: Colorectal cancer | ||
| Colorectum (HTA11) |  | AD: Adenomas |
| SER: Sessile serrated lesions | ||
| MSI-H: Microsatellite-high colorectal cancer | ||
| MSS: Microsatellite stable colorectal cancer | ||
| Endometrium | 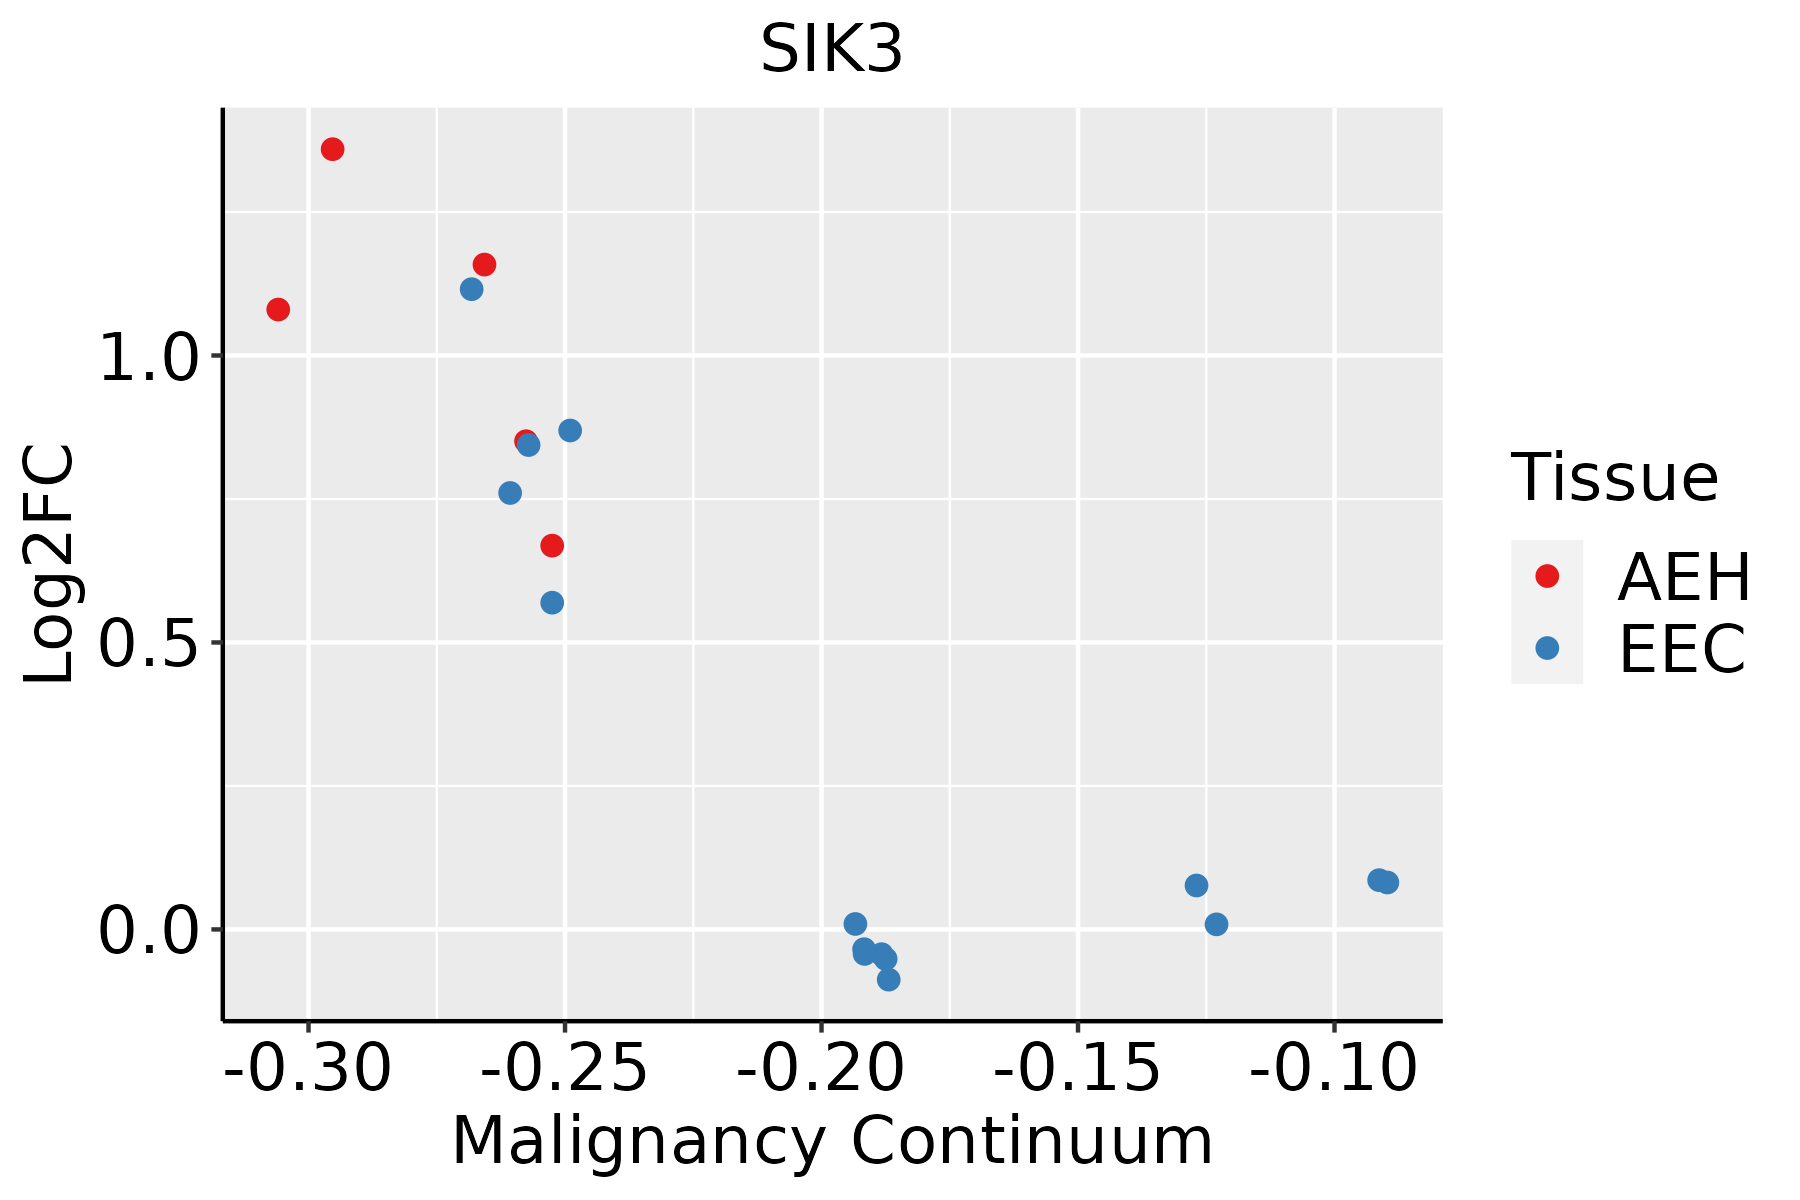 | AEH: Atypical endometrial hyperplasia |
| EEC: Endometrioid Cancer | ||
| GC | 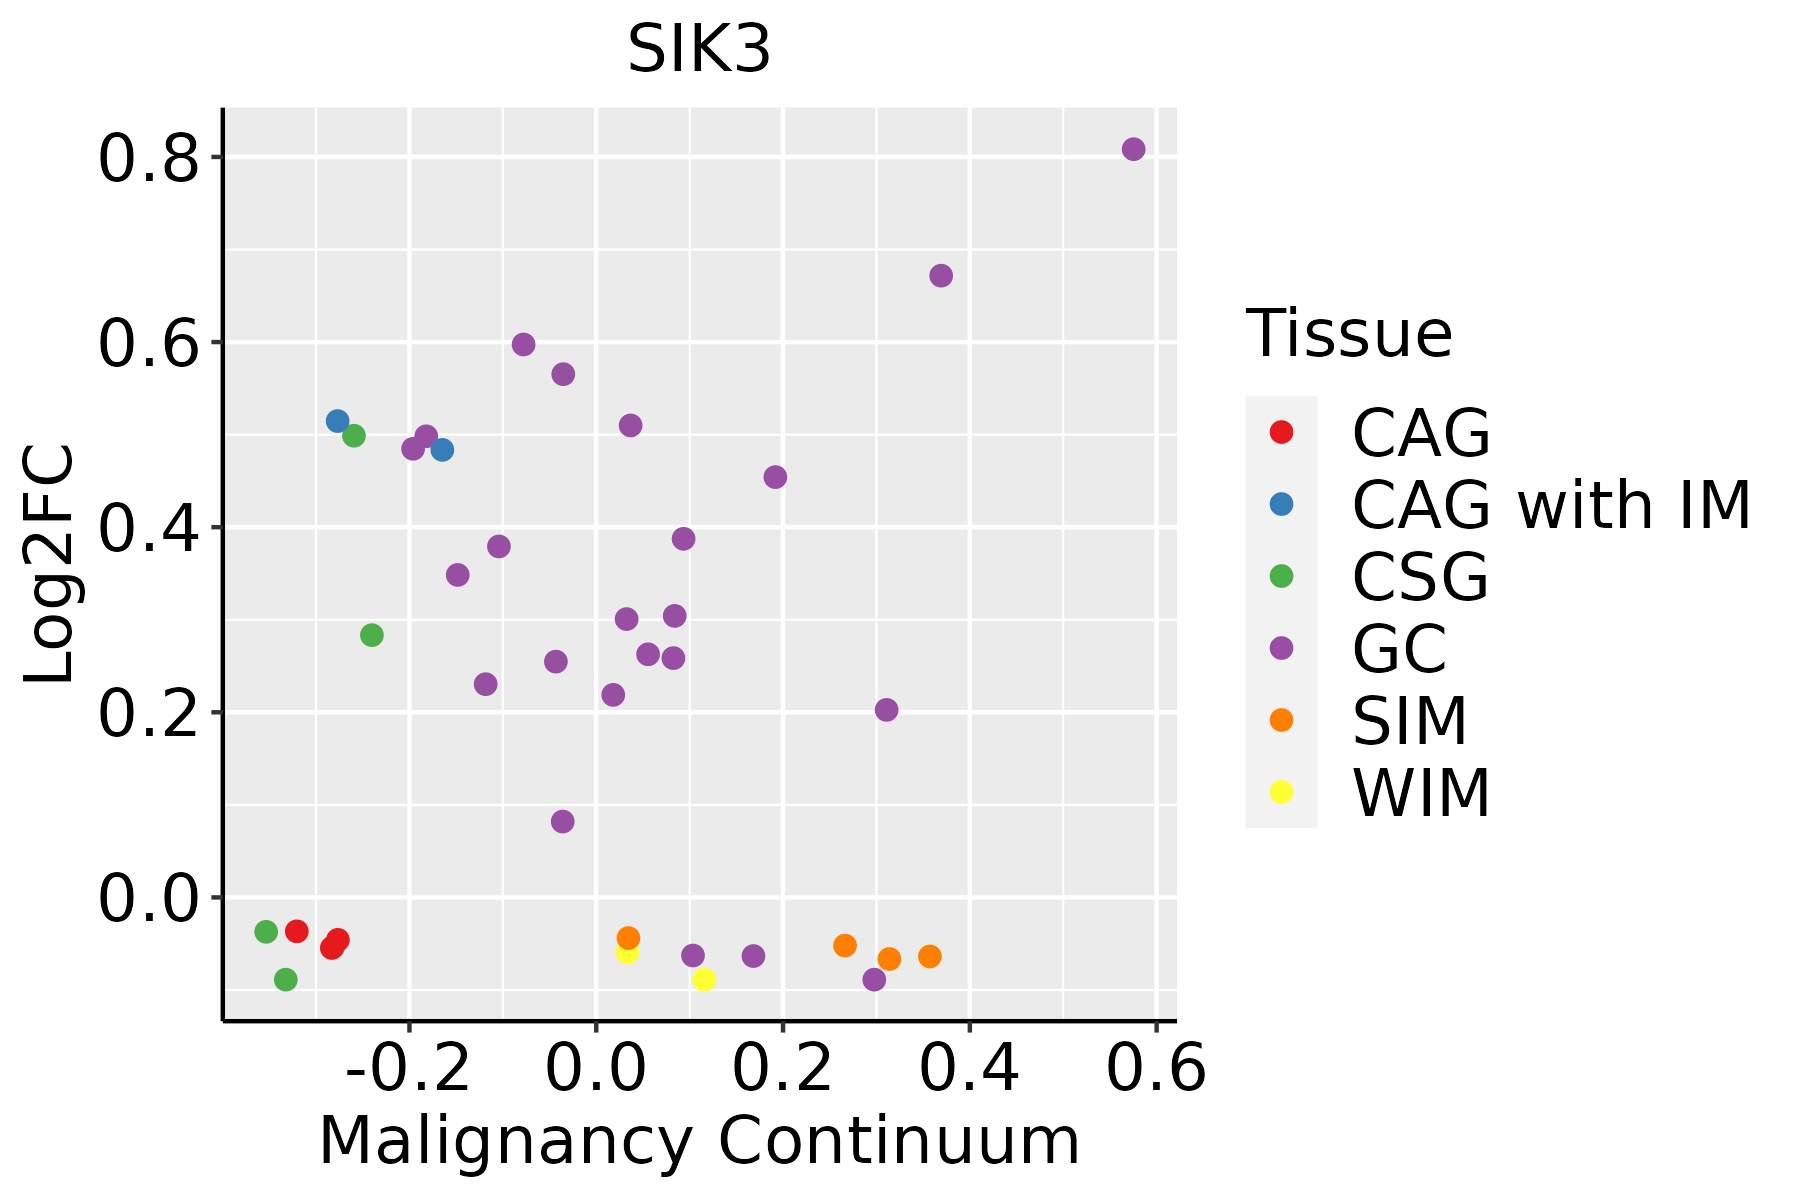 | CAG: Chronic atrophic gastritis |
| CAG with IM: Chronic atrophic gastritis with intestinal metaplasia | ||
| CSG: Chronic superficial gastritis | ||
| GC: Gastric cancer | ||
| SIM: Severe intestinal metaplasia | ||
| WIM: Wild intestinal metaplasia | ||
| Liver |  | HCC: Hepatocellular carcinoma |
| NAFLD: Non-alcoholic fatty liver disease | ||
| Lung |  | AAH: Atypical adenomatous hyperplasia |
| AIS: Adenocarcinoma in situ | ||
| IAC: Invasive lung adenocarcinoma | ||
| MIA: Minimally invasive adenocarcinoma | ||
| Oral Cavity | 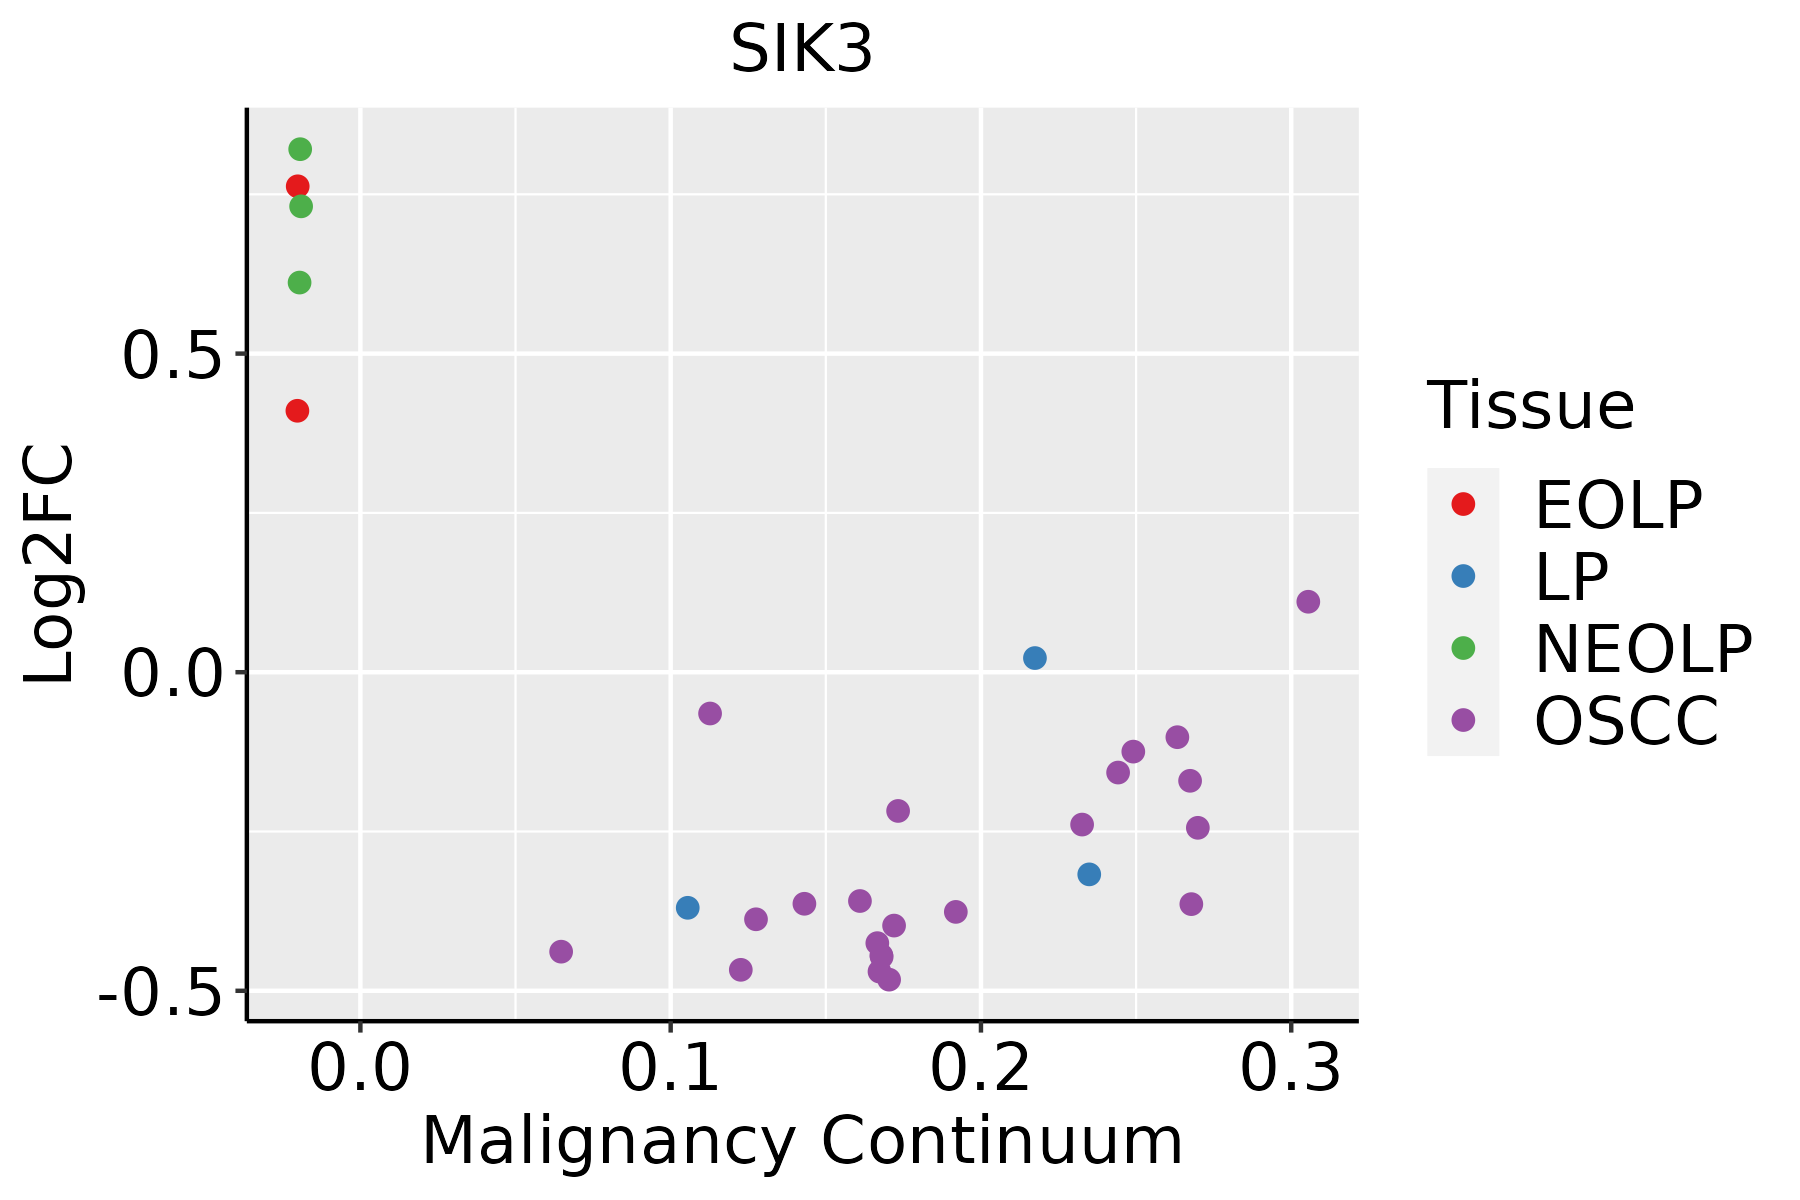 | EOLP: Erosive Oral lichen planus |
| LP: leukoplakia | ||
| NEOLP: Non-erosive oral lichen planus | ||
| OSCC: Oral squamous cell carcinoma | ||
| Prostate |  | BPH: Benign Prostatic Hyperplasia |
| Skin | 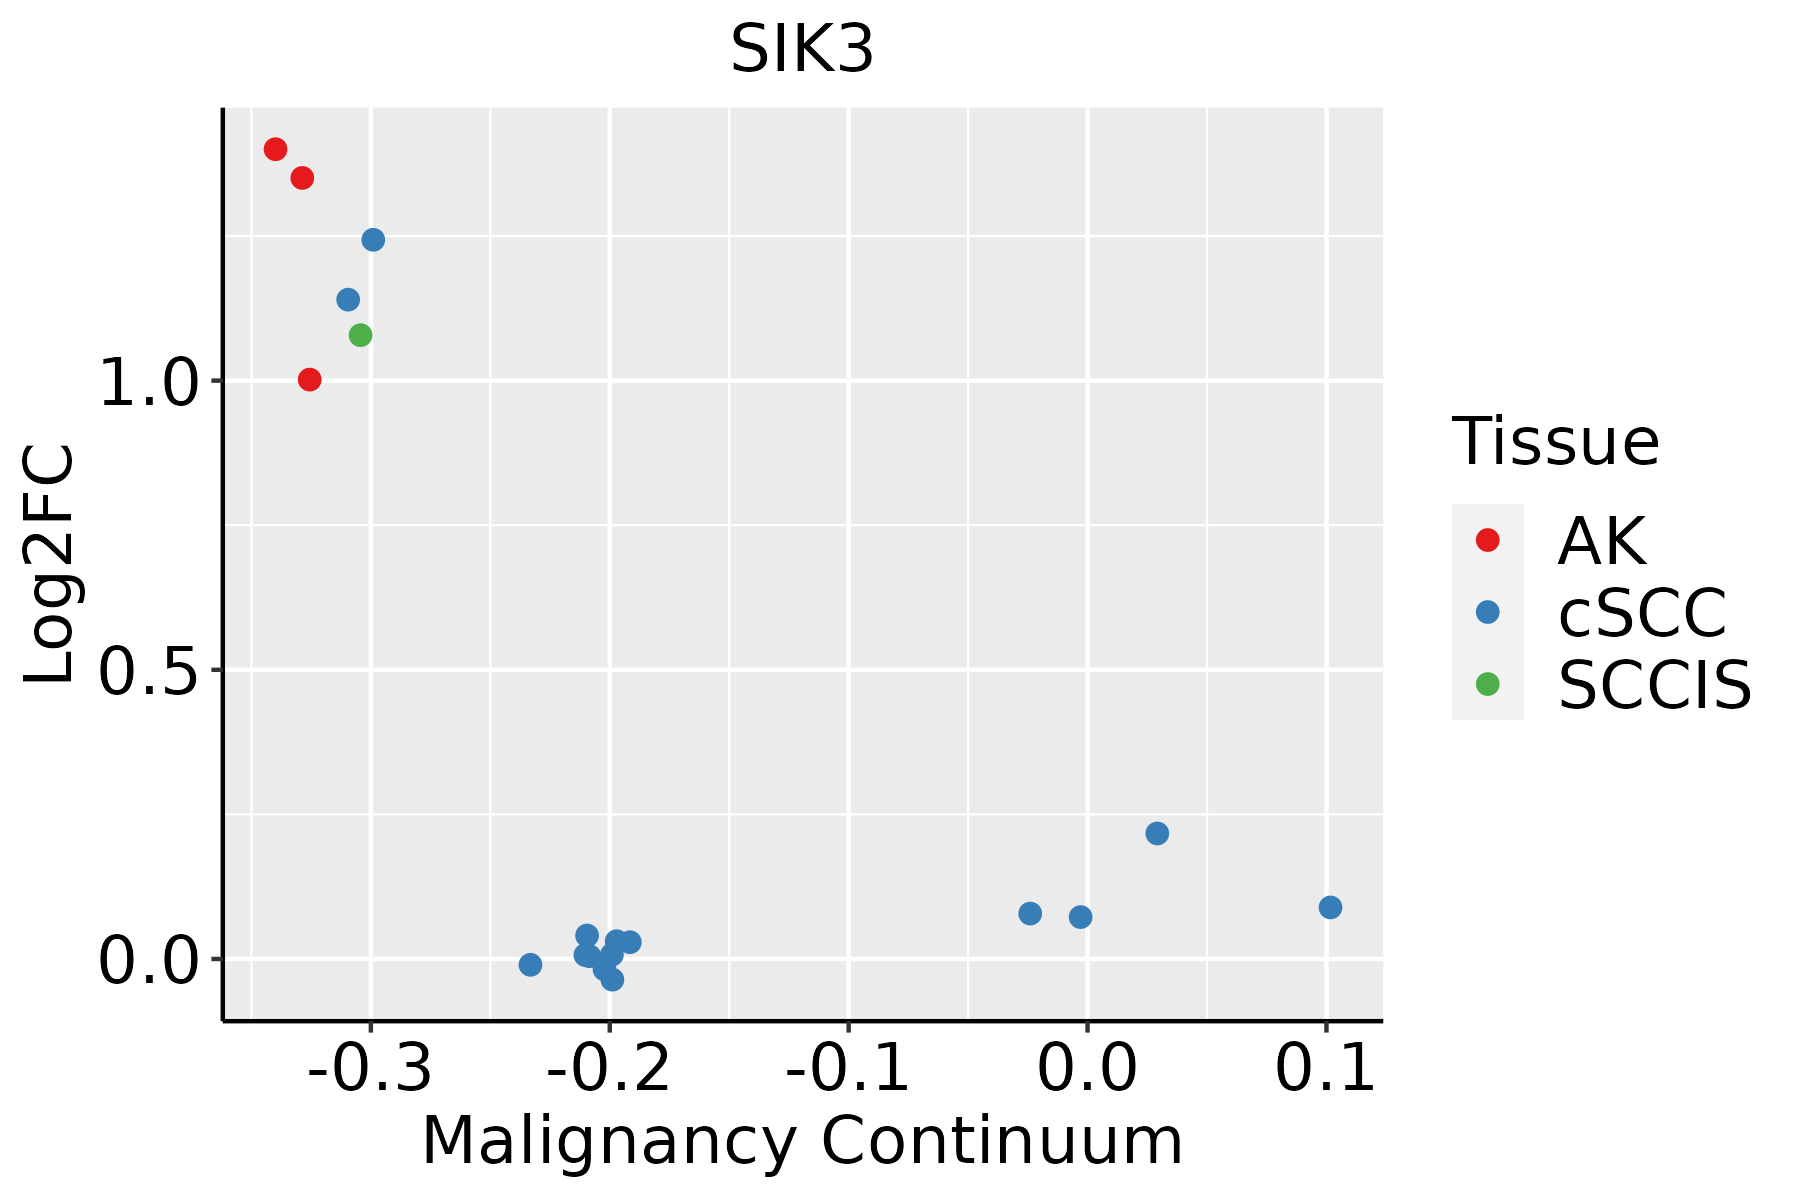 | AK: Actinic keratosis |
| cSCC: Cutaneous squamous cell carcinoma | ||
| SCCIS:squamous cell carcinoma in situ |
| ∗log2FC in expression of this searched gene in stem-like cells from each diseased tissue sample relative to stem-like cells in normal samples in each tissue plotted against the malignancy continuum. Samples are colored based on if they are from different disease stage. |
Top |
Malignant transformation related pathway analysis |
| Find out the enriched GO biological processes and KEGG pathways involved in transition from healthy to precancer to cancer |
| Tissue | Disease Stage | Enriched GO biological Processes |
| Colorectum | AD |  |
| Colorectum | SER |  |
| Colorectum | MSS |  |
| Colorectum | MSI-H |  |
| Colorectum | FAP |  |
| ∗Top 15 enriched GO BP terms are showed in the bar plot of each disease state in each tissue. Each row represents a significant GO biological process which is colored according to the -log10(p.adjust). |
| Page: 1 2 3 4 5 6 7 8 9 |
| GO ID | Tissue | Disease Stage | Description | Gene Ratio | Bg Ratio | pvalue | p.adjust | Count |
| GO:0031929 | Colorectum | MSS | TOR signaling | 35/3467 | 126/18723 | 6.91e-03 | 4.44e-02 | 35 |
| GO:00319292 | Liver | Cirrhotic | TOR signaling | 44/4634 | 126/18723 | 6.69e-03 | 3.30e-02 | 44 |
| GO:00319291 | Liver | HCC | TOR signaling | 78/7958 | 126/18723 | 8.49e-06 | 9.97e-05 | 78 |
| GO:0032006 | Liver | HCC | regulation of TOR signaling | 63/7958 | 104/18723 | 1.50e-04 | 1.20e-03 | 63 |
| GO:0032008 | Liver | HCC | positive regulation of TOR signaling | 31/7958 | 47/18723 | 9.90e-04 | 5.71e-03 | 31 |
| GO:1904263 | Liver | HCC | positive regulation of TORC1 signaling | 14/7958 | 20/18723 | 1.21e-02 | 4.41e-02 | 14 |
| GO:00319293 | Oral cavity | OSCC | TOR signaling | 67/7305 | 126/18723 | 8.52e-04 | 4.50e-03 | 67 |
| GO:0038203 | Oral cavity | OSCC | TORC2 signaling | 10/7305 | 12/18723 | 2.25e-03 | 1.00e-02 | 10 |
| GO:00320081 | Oral cavity | OSCC | positive regulation of TOR signaling | 28/7305 | 47/18723 | 3.41e-03 | 1.45e-02 | 28 |
| Page: 1 |
| Pathway ID | Tissue | Disease Stage | Description | Gene Ratio | Bg Ratio | pvalue | p.adjust | qvalue | Count |
| Page: 1 |
Top |
Cell-cell communication analysis |
| Identification of potential cell-cell interactions between two cell types and their ligand-receptor pairs for different disease states |
| Ligand | Receptor | LRpair | Pathway | Tissue | Disease Stage |
| Page: 1 |
Top |
Single-cell gene regulatory network inference analysis |
| Find out the significant the regulons (TFs) and the target genes of each regulon across cell types for different disease states |
| TF | Cell Type | Tissue | Disease Stage | Target Gene | RSS | Regulon Activity |
| ∗The dot plots of a searched regulon are shown for all cell subpopulations in each disease state of each tissue based on the regulon specific score inferred using pySCENIC and by calculating the average expression. |
| Page: 1 |
Top |
Somatic mutation of malignant transformation related genes |
| Annotation of somatic variants for genes involved in malignant transformation |
| Hugo Symbol | Variant Class | Variant Classification | dbSNP RS | HGVSc | HGVSp | HGVSp Short | SWISSPROT | BIOTYPE | SIFT | PolyPhen | Tumor Sample Barcode | Tissue | Histology | Sex | Age | Stage | Therapy Types | Drugs | Outcome |
| SIK3 | SNV | Missense_Mutation | rs267602706 | c.334N>T | p.Arg112Trp | p.R112W | protein_coding | deleterious(0) | probably_damaging(0.999) | TCGA-A7-A4SB-01 | Breast | breast invasive carcinoma | Female | <65 | III/IV | Chemotherapy | docetaxel | CR | |
| SIK3 | SNV | Missense_Mutation | novel | c.2480N>T | p.Gly827Val | p.G827V | protein_coding | deleterious_low_confidence(0.01) | benign(0.419) | TCGA-A8-A09W-01 | Breast | breast invasive carcinoma | Female | >=65 | III/IV | Unknown | Unknown | SD | |
| SIK3 | SNV | Missense_Mutation | c.292G>C | p.Asp98His | p.D98H | protein_coding | deleterious(0) | probably_damaging(0.999) | TCGA-AC-A23H-01 | Breast | breast invasive carcinoma | Female | >=65 | I/II | Unknown | Unknown | PD | ||
| SIK3 | SNV | Missense_Mutation | novel | c.1567C>A | p.Gln523Lys | p.Q523K | protein_coding | deleterious_low_confidence(0.04) | benign(0.258) | TCGA-D8-A1XF-01 | Breast | breast invasive carcinoma | Female | <65 | I/II | Chemotherapy | adriamycin+cyclophosphamide | SD | |
| SIK3 | SNV | Missense_Mutation | c.1886N>T | p.Ala629Val | p.A629V | protein_coding | deleterious_low_confidence(0) | probably_damaging(0.999) | TCGA-EW-A1IZ-01 | Breast | breast invasive carcinoma | Female | <65 | III/IV | Chemotherapy | taxotere | SD | ||
| SIK3 | insertion | Nonsense_Mutation | novel | c.3048_3049insTGCTGAAAACTCAGCCCCAGGGGGAATTC | p.Glu1017CysfsTer2 | p.E1017Cfs*2 | protein_coding | TCGA-AO-A0J5-01 | Breast | breast invasive carcinoma | Female | <65 | III/IV | Other, specify in notesBisphosphonate | zoledronic | PD | |||
| SIK3 | insertion | Nonsense_Mutation | novel | c.731_732insACAACCTTTTTTAACTCCAGCTTGCTGA | p.Asp245GlnfsTer9 | p.D245Qfs*9 | protein_coding | TCGA-BH-A0BV-01 | Breast | breast invasive carcinoma | Female | >=65 | I/II | Chemotherapy | doxorubicin | SD | |||
| SIK3 | deletion | Frame_Shift_Del | c.2253delC | p.Met752Ter | p.M752* | protein_coding | TCGA-BH-A0W3-01 | Breast | breast invasive carcinoma | Female | <65 | I/II | Unknown | Unknown | SD | ||||
| SIK3 | SNV | Missense_Mutation | rs769986194 | c.3931N>A | p.Glu1311Lys | p.E1311K | protein_coding | deleterious_low_confidence(0) | possibly_damaging(0.829) | TCGA-2W-A8YY-01 | Cervix | cervical & endocervical cancer | Female | <65 | I/II | Chemotherapy | cisplatin | CR | |
| SIK3 | SNV | Missense_Mutation | novel | c.278C>A | p.Ala93Asp | p.A93D | protein_coding | deleterious(0) | probably_damaging(1) | TCGA-EA-A410-01 | Cervix | cervical & endocervical cancer | Female | <65 | I/II | Unknown | Unknown | SD |
| Page: 1 2 3 4 5 6 7 8 9 10 11 12 13 14 |
Top |
Related drugs of malignant transformation related genes |
| Identification of chemicals and drugs interact with genes involved in malignant transfromation |
| (DGIdb 4.0) |
| Entrez ID | Symbol | Category | Interaction Types | Drug Claim Name | Drug Name | PMIDs |
| 23387 | SIK3 | DRUGGABLE GENOME, KINASE, SERINE THREONINE KINASE, ENZYME | inhibitor | 178102336 | BOSUTINIB | |
| 23387 | SIK3 | DRUGGABLE GENOME, KINASE, SERINE THREONINE KINASE, ENZYME | inhibitor | 340590212 | ||
| 23387 | SIK3 | DRUGGABLE GENOME, KINASE, SERINE THREONINE KINASE, ENZYME | inhibitor | 178102305 | DASATINIB | |
| 23387 | SIK3 | DRUGGABLE GENOME, KINASE, SERINE THREONINE KINASE, ENZYME | inhibitor | 249565729 |
| Page: 1 |

Copyright 2023-Present -The University of Texas Health Science Center at Houston |