
|
|||||
|
 | |
| |
| |
| |
| |
| |
|
Gene: SCCPDH |
Gene summary for SCCPDH |
| Gene information | Species | Human | Gene symbol | SCCPDH | Gene ID | 51097 |
| Gene name | saccharopine dehydrogenase (putative) | |
| Gene Alias | CGI-49 | |
| Cytomap | 1q44 | |
| Gene Type | protein-coding | GO ID | GO:0006629 | UniProtAcc | Q8NBX0 |
Top |
Malignant transformation analysis |
| Identification of the aberrant gene expression in precancerous and cancerous lesions by comparing the gene expression of stem-like cells in diseased tissues with normal stem cells |
| Entrez ID | Symbol | Replicates | Species | Organ | Tissue | Adj P-value | Log2FC | Malignancy |
| 51097 | SCCPDH | C04 | Human | Oral cavity | OSCC | 8.27e-06 | 4.74e-01 | 0.2633 |
| 51097 | SCCPDH | C21 | Human | Oral cavity | OSCC | 1.64e-60 | 2.25e+00 | 0.2678 |
| 51097 | SCCPDH | C30 | Human | Oral cavity | OSCC | 3.51e-17 | 8.04e-01 | 0.3055 |
| 51097 | SCCPDH | C38 | Human | Oral cavity | OSCC | 1.42e-06 | 1.05e+00 | 0.172 |
| 51097 | SCCPDH | C43 | Human | Oral cavity | OSCC | 1.56e-25 | 5.40e-01 | 0.1704 |
| 51097 | SCCPDH | C46 | Human | Oral cavity | OSCC | 1.95e-06 | 3.64e-01 | 0.1673 |
| 51097 | SCCPDH | C51 | Human | Oral cavity | OSCC | 3.96e-02 | 3.96e-01 | 0.2674 |
| 51097 | SCCPDH | C08 | Human | Oral cavity | OSCC | 1.04e-31 | 7.08e-01 | 0.1919 |
| 51097 | SCCPDH | C09 | Human | Oral cavity | OSCC | 1.01e-04 | 2.73e-01 | 0.1431 |
| 51097 | SCCPDH | LN22 | Human | Oral cavity | OSCC | 5.15e-06 | 8.46e-01 | 0.1733 |
| 51097 | SCCPDH | SYSMH1 | Human | Oral cavity | OSCC | 3.88e-02 | 1.27e-01 | 0.1127 |
| 51097 | SCCPDH | SYSMH2 | Human | Oral cavity | OSCC | 9.62e-06 | 3.84e-01 | 0.2326 |
| 51097 | SCCPDH | SYSMH3 | Human | Oral cavity | OSCC | 9.44e-03 | 1.51e-01 | 0.2442 |
| 51097 | SCCPDH | SYSMH6 | Human | Oral cavity | OSCC | 6.96e-07 | 2.30e-01 | 0.1275 |
| 51097 | SCCPDH | GSM5252128_BPH327PrGF_Via | Human | Prostate | BPH | 4.51e-03 | 1.48e-01 | -0.1688 |
| 51097 | SCCPDH | GSM5252130_BPH340PrGF_Via | Human | Prostate | BPH | 6.08e-03 | 1.71e-01 | -0.1972 |
| 51097 | SCCPDH | GSM5252133_BPH389PrSF | Human | Prostate | BPH | 1.95e-02 | 5.34e-01 | -0.2027 |
| 51097 | SCCPDH | GSM5252135_BPH511PrPUr_Fcol_3GEX | Human | Prostate | BPH | 2.31e-20 | 7.19e-01 | -0.1833 |
| 51097 | SCCPDH | GSM5252137_BPH556PrGA2_Fcol | Human | Prostate | BPH | 7.06e-13 | 4.26e-01 | -0.23 |
| 51097 | SCCPDH | Dong_P1 | Human | Prostate | Tumor | 3.90e-67 | 6.72e-01 | 0.035 |
| Page: 1 2 3 4 5 6 7 |
| Tissue | Expression Dynamics | Abbreviation |
| Breast |  | IDC: Invasive ductal carcinoma |
| DCIS: Ductal carcinoma in situ | ||
| Precancer(BRCA1-mut): Precancerous lesion from BRCA1 mutation carriers | ||
| Colorectum (GSE201348) |  | FAP: Familial adenomatous polyposis |
| CRC: Colorectal cancer | ||
| Colorectum (HTA11) |  | AD: Adenomas |
| SER: Sessile serrated lesions | ||
| MSI-H: Microsatellite-high colorectal cancer | ||
| MSS: Microsatellite stable colorectal cancer | ||
| Esophagus | 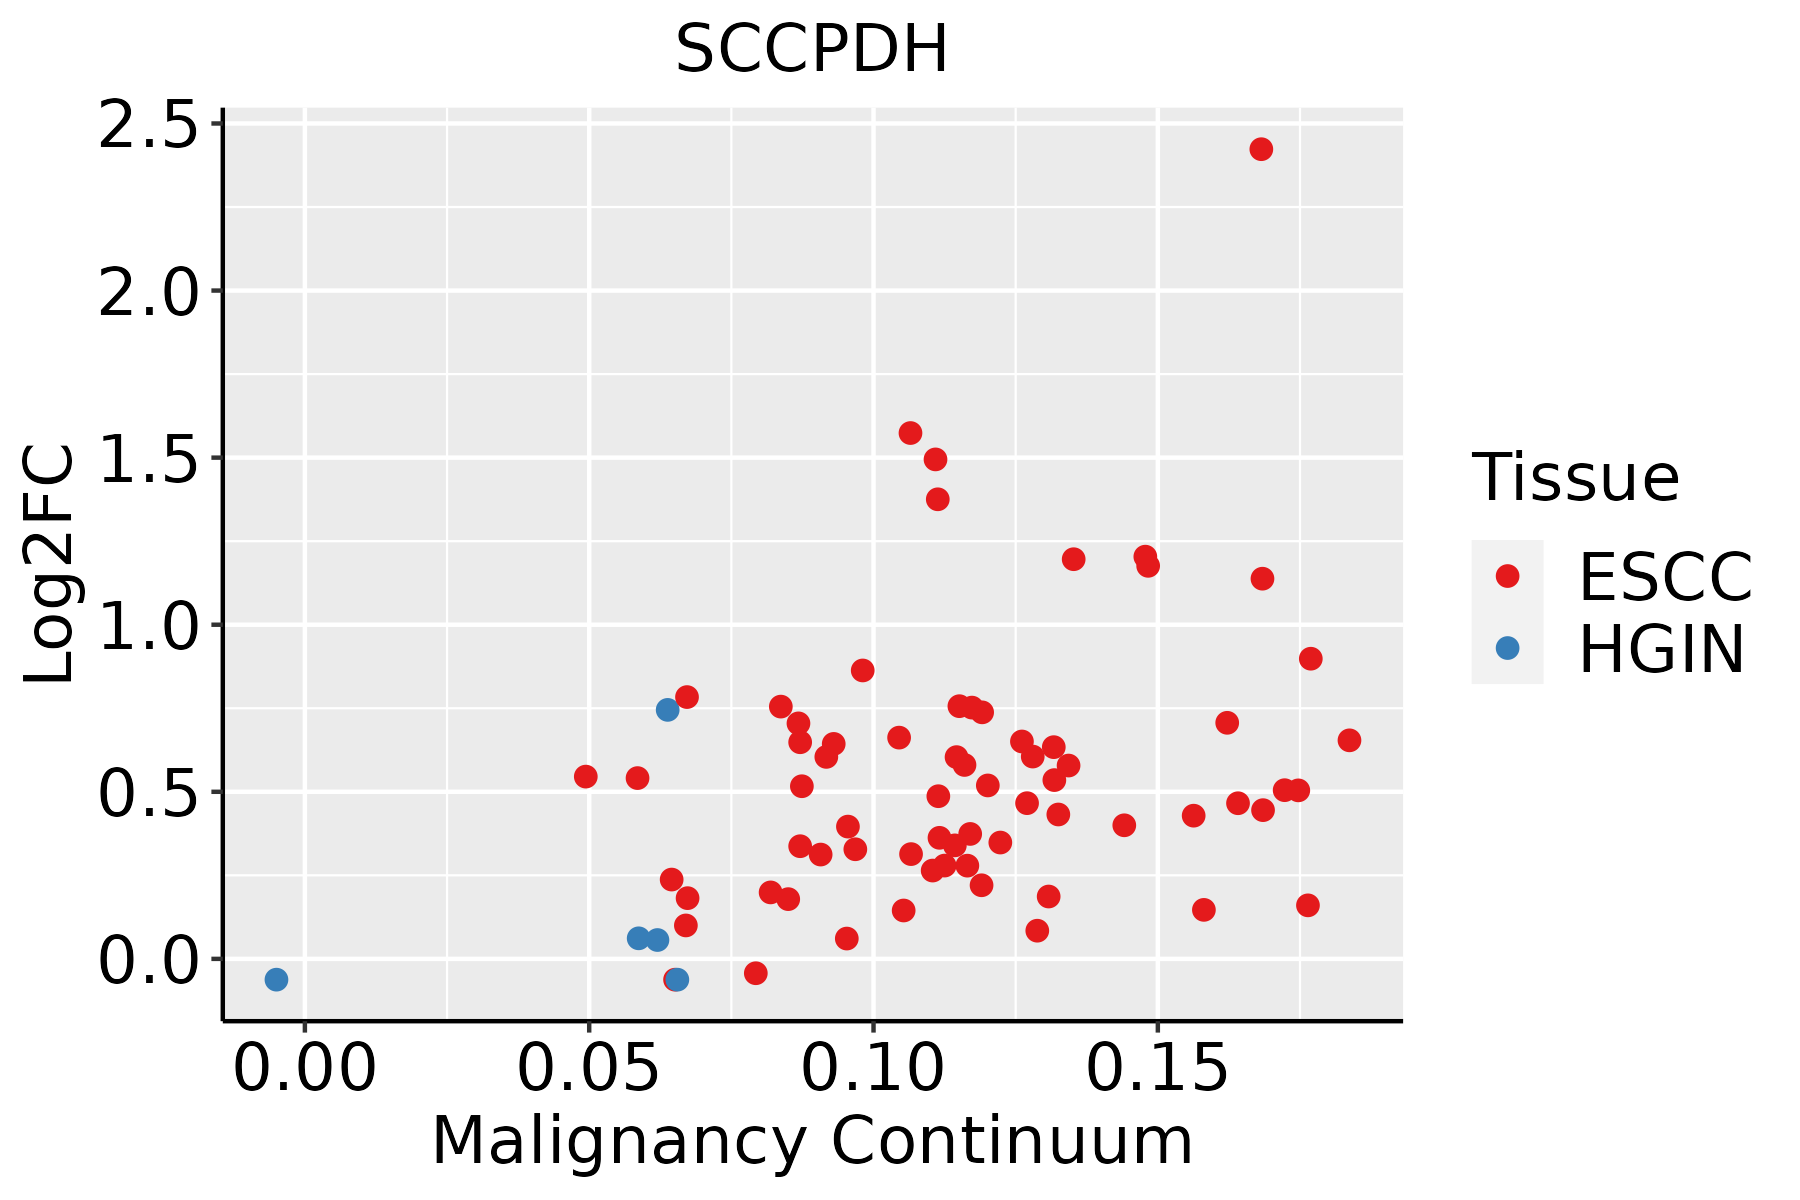 | ESCC: Esophageal squamous cell carcinoma |
| HGIN: High-grade intraepithelial neoplasias | ||
| LGIN: Low-grade intraepithelial neoplasias | ||
| Liver | 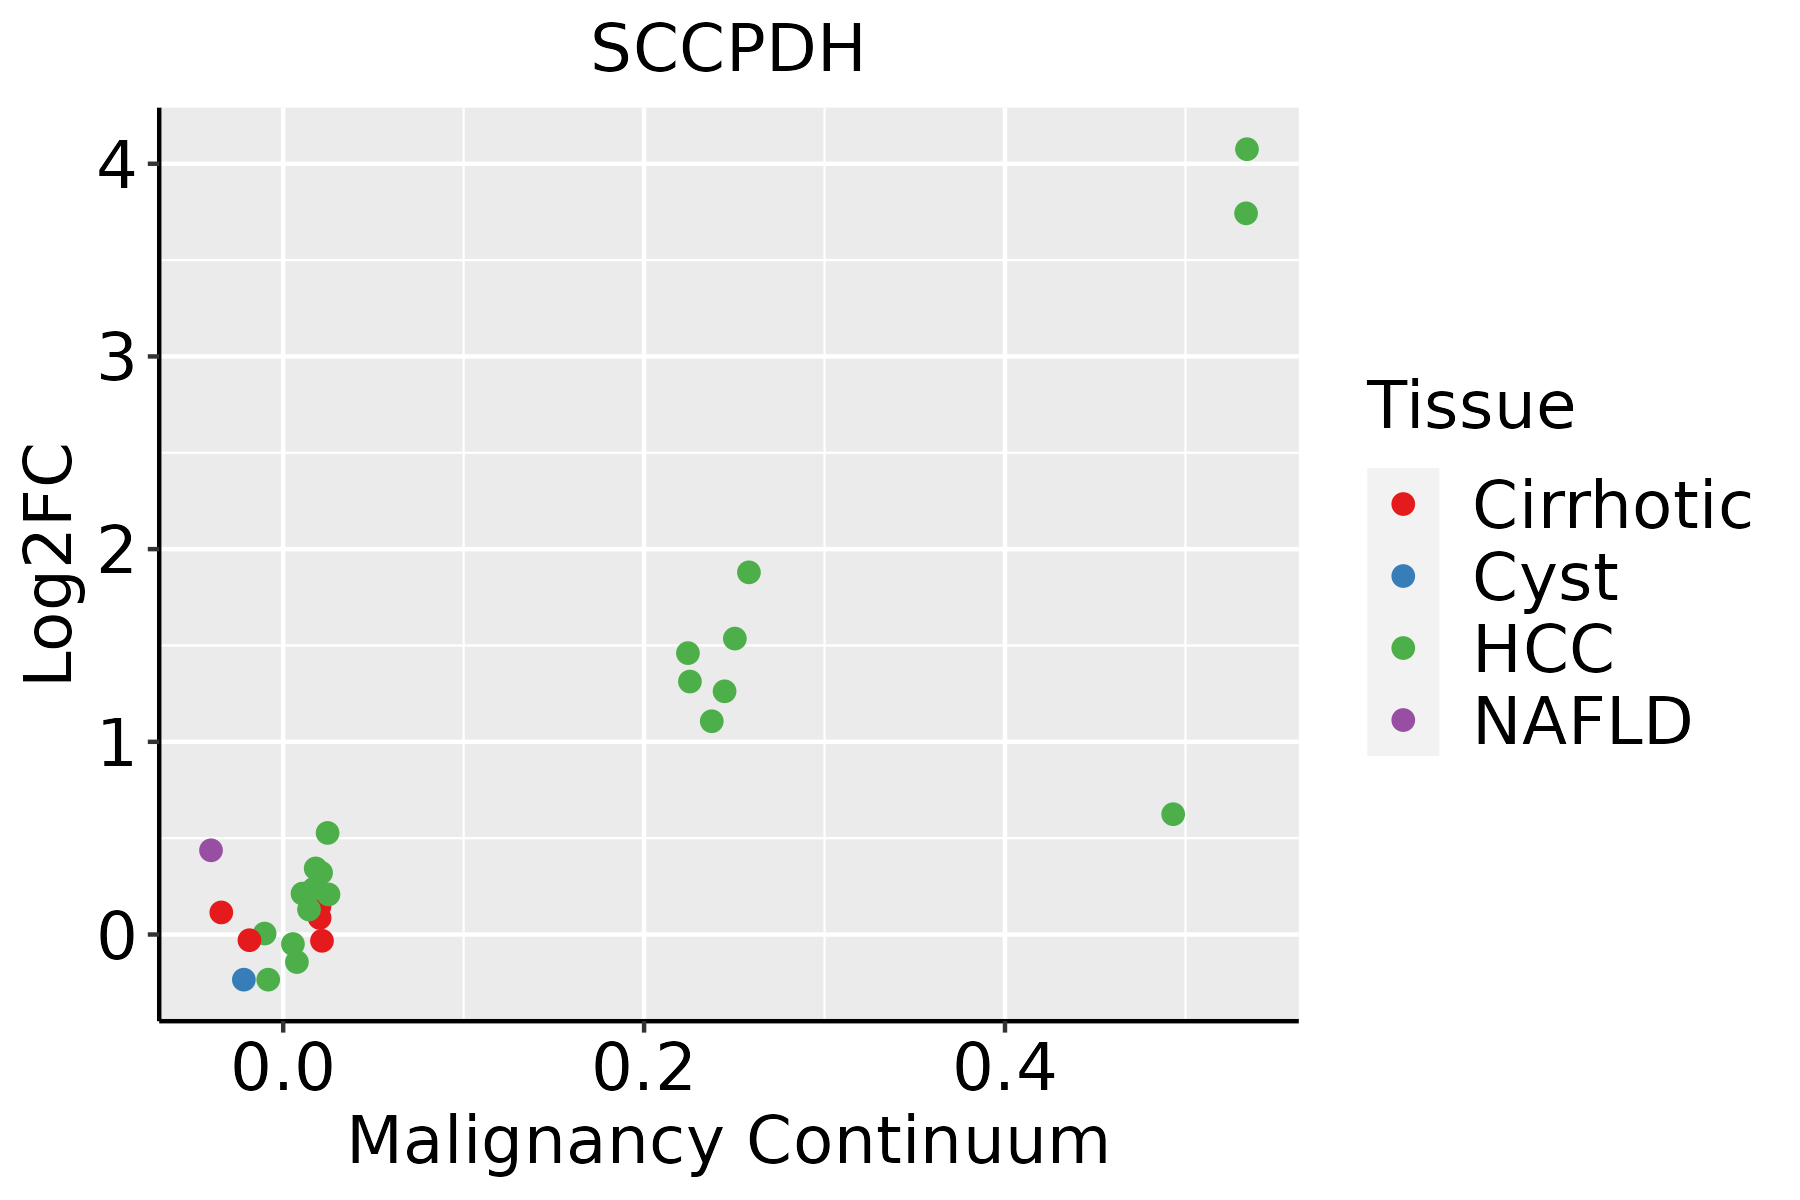 | HCC: Hepatocellular carcinoma |
| NAFLD: Non-alcoholic fatty liver disease | ||
| Oral Cavity | 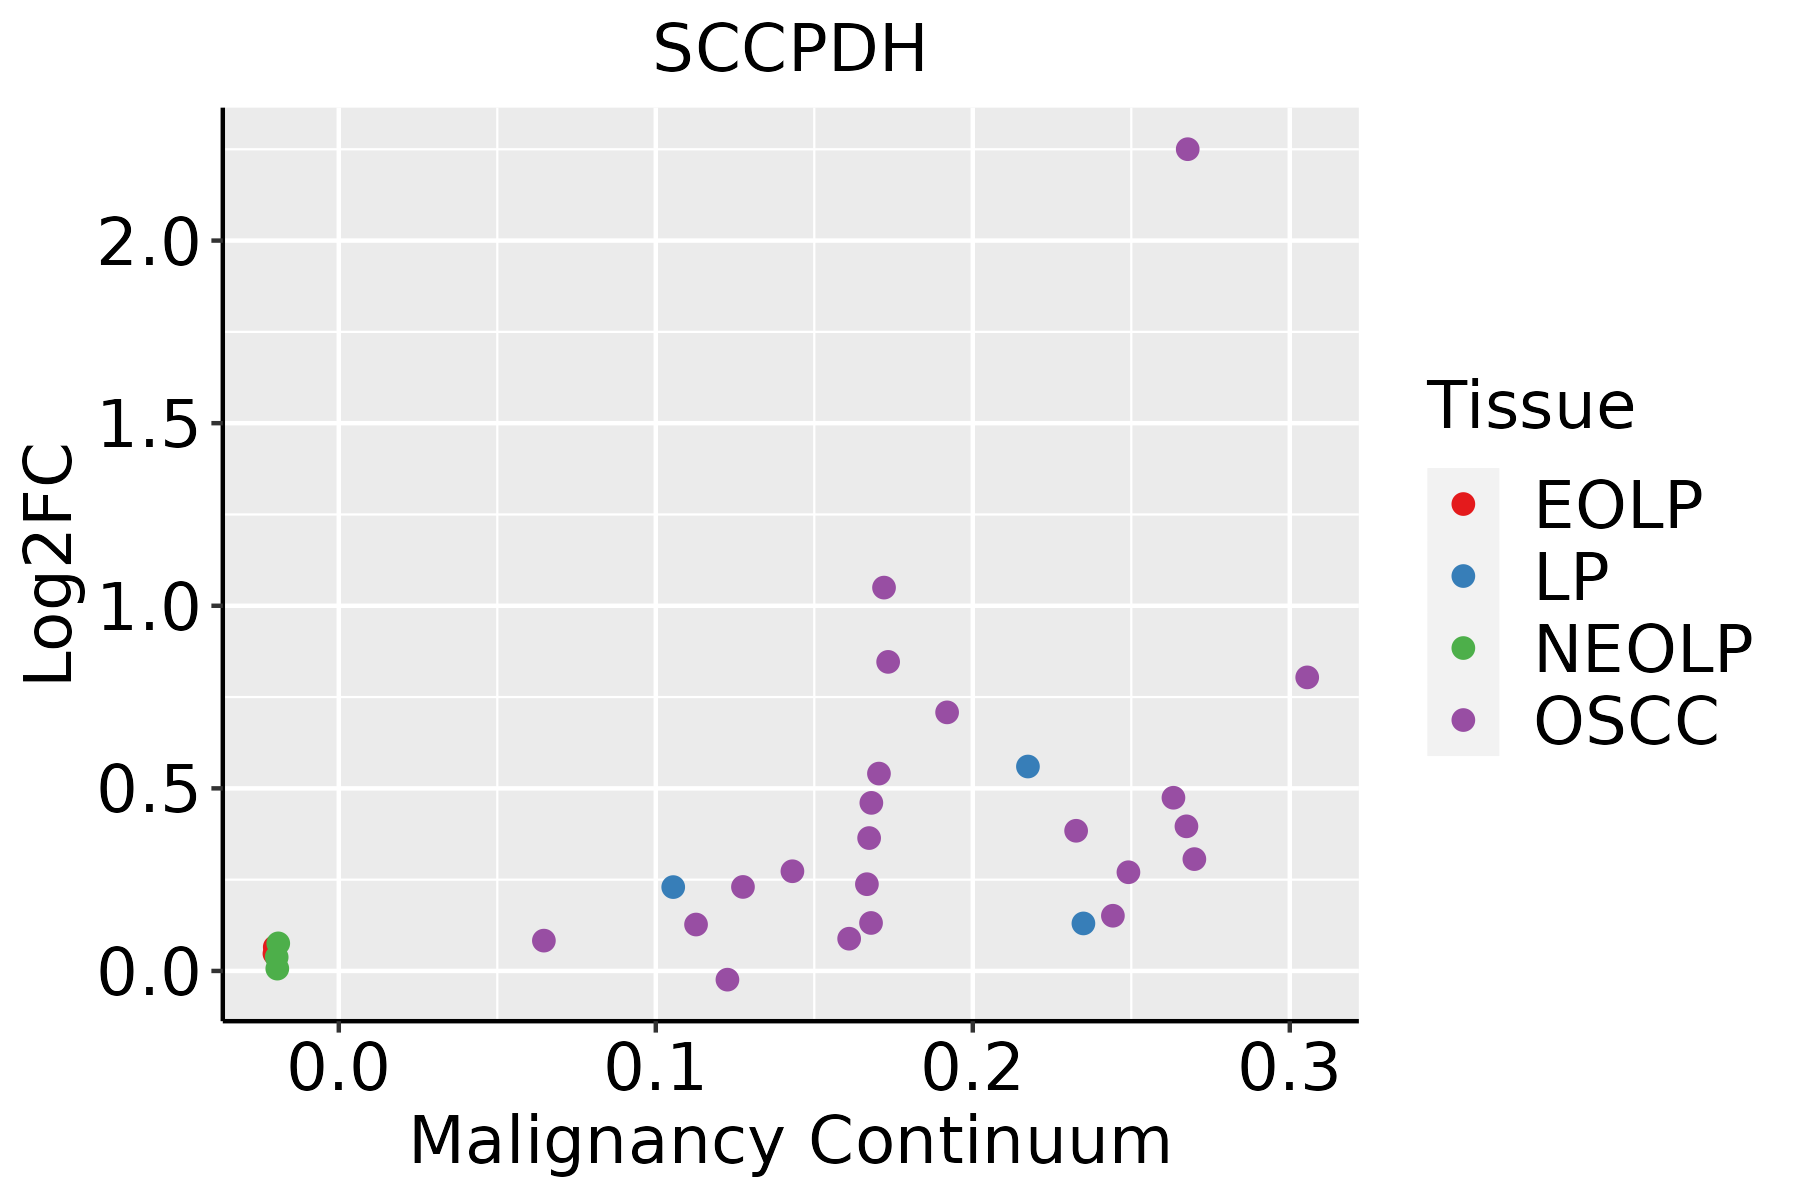 | EOLP: Erosive Oral lichen planus |
| LP: leukoplakia | ||
| NEOLP: Non-erosive oral lichen planus | ||
| OSCC: Oral squamous cell carcinoma | ||
| Prostate | 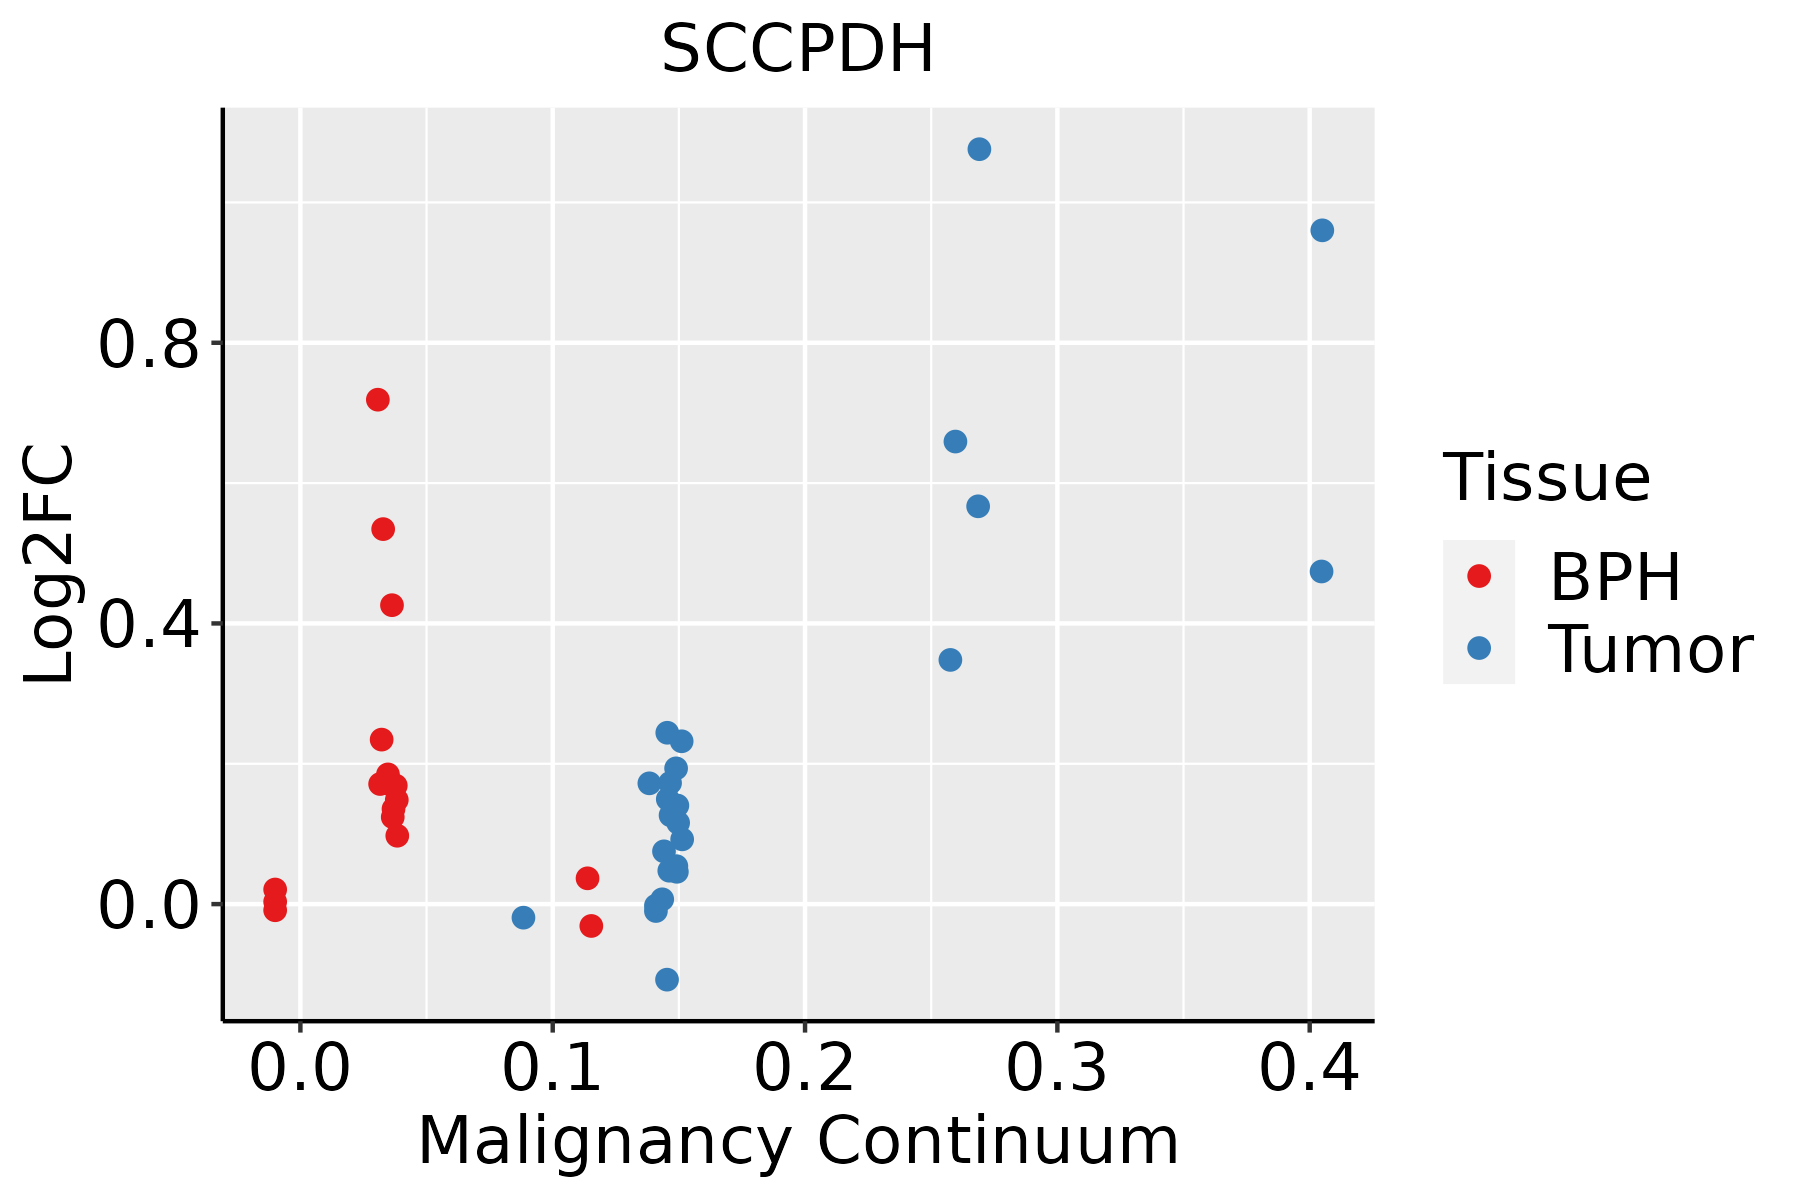 | BPH: Benign Prostatic Hyperplasia |
| Thyroid |  | ATC: Anaplastic thyroid cancer |
| HT: Hashimoto's thyroiditis | ||
| PTC: Papillary thyroid cancer |
| ∗log2FC in expression of this searched gene in stem-like cells from each diseased tissue sample relative to stem-like cells in normal samples in each tissue plotted against the malignancy continuum. Samples are colored based on if they are from different disease stage. |
Top |
Malignant transformation related pathway analysis |
| Find out the enriched GO biological processes and KEGG pathways involved in transition from healthy to precancer to cancer |
| Tissue | Disease Stage | Enriched GO biological Processes |
| Colorectum | AD |  |
| Colorectum | SER |  |
| Colorectum | MSS |  |
| Colorectum | MSI-H |  |
| Colorectum | FAP |  |
| ∗Top 15 enriched GO BP terms are showed in the bar plot of each disease state in each tissue. Each row represents a significant GO biological process which is colored according to the -log10(p.adjust). |
| Page: 1 2 3 4 5 6 7 8 9 |
| GO ID | Tissue | Disease Stage | Description | Gene Ratio | Bg Ratio | pvalue | p.adjust | Count |
| GO:00066433 | Esophagus | ESCC | membrane lipid metabolic process | 130/8552 | 203/18723 | 9.29e-08 | 1.54e-06 | 130 |
| GO:00464673 | Esophagus | ESCC | membrane lipid biosynthetic process | 91/8552 | 142/18723 | 7.19e-06 | 7.19e-05 | 91 |
| GO:00066642 | Esophagus | ESCC | glycolipid metabolic process | 63/8552 | 100/18723 | 3.55e-04 | 2.06e-03 | 63 |
| GO:19035092 | Esophagus | ESCC | liposaccharide metabolic process | 63/8552 | 101/18723 | 5.25e-04 | 2.90e-03 | 63 |
| GO:0009247 | Esophagus | ESCC | glycolipid biosynthetic process | 42/8552 | 68/18723 | 5.48e-03 | 2.05e-02 | 42 |
| GO:0006643 | Liver | Cirrhotic | membrane lipid metabolic process | 69/4634 | 203/18723 | 1.89e-03 | 1.19e-02 | 69 |
| GO:00066431 | Liver | HCC | membrane lipid metabolic process | 115/7958 | 203/18723 | 3.17e-05 | 3.22e-04 | 115 |
| GO:0046467 | Liver | HCC | membrane lipid biosynthetic process | 78/7958 | 142/18723 | 1.85e-03 | 9.46e-03 | 78 |
| GO:0006664 | Liver | HCC | glycolipid metabolic process | 57/7958 | 100/18723 | 2.40e-03 | 1.17e-02 | 57 |
| GO:1903509 | Liver | HCC | liposaccharide metabolic process | 57/7958 | 101/18723 | 3.25e-03 | 1.49e-02 | 57 |
| GO:00066432 | Oral cavity | OSCC | membrane lipid metabolic process | 111/7305 | 203/18723 | 4.02e-06 | 4.69e-05 | 111 |
| GO:00464672 | Oral cavity | OSCC | membrane lipid biosynthetic process | 77/7305 | 142/18723 | 1.63e-04 | 1.13e-03 | 77 |
| GO:00066641 | Oral cavity | OSCC | glycolipid metabolic process | 53/7305 | 100/18723 | 3.09e-03 | 1.33e-02 | 53 |
| GO:19035091 | Oral cavity | OSCC | liposaccharide metabolic process | 53/7305 | 101/18723 | 4.06e-03 | 1.66e-02 | 53 |
| Page: 1 |
| Pathway ID | Tissue | Disease Stage | Description | Gene Ratio | Bg Ratio | pvalue | p.adjust | qvalue | Count |
| Page: 1 |
Top |
Cell-cell communication analysis |
| Identification of potential cell-cell interactions between two cell types and their ligand-receptor pairs for different disease states |
| Ligand | Receptor | LRpair | Pathway | Tissue | Disease Stage |
| Page: 1 |
Top |
Single-cell gene regulatory network inference analysis |
| Find out the significant the regulons (TFs) and the target genes of each regulon across cell types for different disease states |
| TF | Cell Type | Tissue | Disease Stage | Target Gene | RSS | Regulon Activity |
| ∗The dot plots of a searched regulon are shown for all cell subpopulations in each disease state of each tissue based on the regulon specific score inferred using pySCENIC and by calculating the average expression. |
| Page: 1 |
Top |
Somatic mutation of malignant transformation related genes |
| Annotation of somatic variants for genes involved in malignant transformation |
| Hugo Symbol | Variant Class | Variant Classification | dbSNP RS | HGVSc | HGVSp | HGVSp Short | SWISSPROT | BIOTYPE | SIFT | PolyPhen | Tumor Sample Barcode | Tissue | Histology | Sex | Age | Stage | Therapy Types | Drugs | Outcome |
| SCCPDH | SNV | Missense_Mutation | c.1230N>T | p.Leu410Phe | p.L410F | Q8NBX0 | protein_coding | deleterious(0) | probably_damaging(0.997) | TCGA-A8-A07B-01 | Breast | breast invasive carcinoma | Female | >=65 | I/II | Unknown | Unknown | SD | |
| SCCPDH | SNV | Missense_Mutation | c.256G>C | p.Asp86His | p.D86H | Q8NBX0 | protein_coding | tolerated(0.12) | benign(0.213) | TCGA-BH-A18V-01 | Breast | breast invasive carcinoma | Female | <65 | I/II | Unknown | Unknown | SD | |
| SCCPDH | insertion | Nonsense_Mutation | novel | c.359_360insAGGAAGGGCTTCAGCTGATTTAAATTGGAAGTTCTT | p.Cys120delinsTer | p.C120delins* | Q8NBX0 | protein_coding | TCGA-A2-A04V-01 | Breast | breast invasive carcinoma | Female | <65 | I/II | Chemotherapy | cytoxan | PD | ||
| SCCPDH | SNV | Missense_Mutation | c.467C>A | p.Ser156Tyr | p.S156Y | Q8NBX0 | protein_coding | deleterious(0) | probably_damaging(0.984) | TCGA-EA-A439-01 | Cervix | cervical & endocervical cancer | Female | <65 | I/II | Unknown | Unknown | PD | |
| SCCPDH | SNV | Missense_Mutation | c.931N>C | p.Lys311Gln | p.K311Q | Q8NBX0 | protein_coding | tolerated(0.06) | benign(0.303) | TCGA-A6-6141-01 | Colorectum | colon adenocarcinoma | Male | <65 | I/II | Chemotherapy | 5-fu | SD | |
| SCCPDH | SNV | Missense_Mutation | c.4G>A | p.Ala2Thr | p.A2T | Q8NBX0 | protein_coding | deleterious(0.04) | benign(0.017) | TCGA-AA-3510-01 | Colorectum | colon adenocarcinoma | Male | >=65 | I/II | Unknown | Unknown | SD | |
| SCCPDH | SNV | Missense_Mutation | novel | c.545N>T | p.Thr182Ile | p.T182I | Q8NBX0 | protein_coding | deleterious(0.02) | possibly_damaging(0.882) | TCGA-CM-5348-01 | Colorectum | colon adenocarcinoma | Male | >=65 | III/IV | Unknown | Unknown | SD |
| SCCPDH | SNV | Missense_Mutation | c.1148N>C | p.Met383Thr | p.M383T | Q8NBX0 | protein_coding | tolerated(0.15) | benign(0.079) | TCGA-QG-A5Z2-01 | Colorectum | colon adenocarcinoma | Male | <65 | I/II | Unknown | Unknown | SD | |
| SCCPDH | insertion | Nonsense_Mutation | novel | c.919_920insAAAGTTAG | p.Leu308SerfsTer2 | p.L308Sfs*2 | Q8NBX0 | protein_coding | TCGA-AM-5820-01 | Colorectum | colon adenocarcinoma | Female | <65 | I/II | Unknown | Unknown | SD | ||
| SCCPDH | insertion | Frame_Shift_Ins | novel | c.1184_1184+1insGGGCGGG | p.Val398GlyfsTer17 | p.V398Gfs*17 | Q8NBX0 | protein_coding | TCGA-G4-6299-01 | Colorectum | colon adenocarcinoma | Male | >=65 | III/IV | Ancillary | leucovorin | SD |
| Page: 1 2 3 4 5 |
Top |
Related drugs of malignant transformation related genes |
| Identification of chemicals and drugs interact with genes involved in malignant transfromation |
| (DGIdb 4.0) |
| Entrez ID | Symbol | Category | Interaction Types | Drug Claim Name | Drug Name | PMIDs |
| Page: 1 |

Copyright 2023-Present -The University of Texas Health Science Center at Houston |