
|
|||||
|
 | |
| |
| |
| |
| |
| |
|
Gene: RNF145 |
Gene summary for RNF145 |
| Gene information | Species | Human | Gene symbol | RNF145 | Gene ID | 153830 |
| Gene name | ring finger protein 145 | |
| Gene Alias | RNF145 | |
| Cytomap | 5q33.3 | |
| Gene Type | protein-coding | GO ID | GO:0006464 | UniProtAcc | Q8NDT8 |
Top |
Malignant transformation analysis |
| Identification of the aberrant gene expression in precancerous and cancerous lesions by comparing the gene expression of stem-like cells in diseased tissues with normal stem cells |
| Entrez ID | Symbol | Replicates | Species | Organ | Tissue | Adj P-value | Log2FC | Malignancy |
| 153830 | RNF145 | SYSMH4 | Human | Oral cavity | OSCC | 1.52e-06 | 1.11e-01 | 0.1226 |
| 153830 | RNF145 | HTA12-23-1 | Human | Pancreas | PDAC | 5.58e-04 | 6.31e-01 | 0.3405 |
| 153830 | RNF145 | HTA12-25-1 | Human | Pancreas | PDAC | 6.26e-04 | 5.65e-01 | 0.313 |
| 153830 | RNF145 | HTA12-26-1 | Human | Pancreas | PDAC | 5.75e-14 | 6.95e-01 | 0.3728 |
| 153830 | RNF145 | HTA12-29-1 | Human | Pancreas | PDAC | 2.31e-15 | 4.42e-01 | 0.3722 |
| 153830 | RNF145 | GSM5252130_BPH340PrGF_Via | Human | Prostate | BPH | 2.50e-10 | 6.11e-01 | -0.1972 |
| 153830 | RNF145 | GSM5252131_BPH340PrSF_Via | Human | Prostate | BPH | 1.17e-08 | 6.39e-01 | -0.2126 |
| 153830 | RNF145 | 047563_1562-all-cells | Human | Prostate | BPH | 3.40e-12 | 4.83e-02 | 0.0791 |
| 153830 | RNF145 | 048752_1579-all-cells | Human | Prostate | BPH | 7.38e-03 | 2.47e-01 | 0.1008 |
| 153830 | RNF145 | 052095_1628-all-cells | Human | Prostate | BPH | 2.28e-06 | 4.20e-01 | 0.1032 |
| 153830 | RNF145 | 052097_1595-all-cells | Human | Prostate | BPH | 3.40e-05 | 2.95e-01 | 0.0972 |
| 153830 | RNF145 | 052099_1652-all-cells | Human | Prostate | BPH | 4.41e-03 | 2.63e-01 | 0.1038 |
| 153830 | RNF145 | Dong_P1 | Human | Prostate | Tumor | 6.02e-32 | 3.96e-01 | 0.035 |
| 153830 | RNF145 | Dong_P3 | Human | Prostate | Tumor | 3.37e-07 | -1.19e-02 | 0.0278 |
| 153830 | RNF145 | Dong_P4 | Human | Prostate | Tumor | 1.14e-06 | 3.93e-02 | 0.0292 |
| 153830 | RNF145 | Dong_P5 | Human | Prostate | Tumor | 1.69e-31 | 1.27e-01 | 0.053 |
| 153830 | RNF145 | GSM5353225_PA_PR5196-1_Pool_1_2_3_S53_L002 | Human | Prostate | Tumor | 4.51e-02 | 3.42e-01 | 0.1619 |
| 153830 | RNF145 | GSM5353240_PA_PR5254_T1_S15_L001 | Human | Prostate | Tumor | 9.47e-03 | -1.28e-02 | 0.1575 |
| 153830 | RNF145 | GSM5353243_PA_PR5261_T1_S23_L002 | Human | Prostate | Tumor | 1.14e-07 | -1.44e-01 | 0.1545 |
| 153830 | RNF145 | GSM5353244_PA_PR5261_T2_S24_L002 | Human | Prostate | Tumor | 1.20e-06 | -1.64e-02 | 0.1569 |
| Page: 1 2 3 4 5 6 7 8 |
| Tissue | Expression Dynamics | Abbreviation |
| Cervix |  | CC: Cervix cancer |
| HSIL_HPV: HPV-infected high-grade squamous intraepithelial lesions | ||
| N_HPV: HPV-infected normal cervix | ||
| Esophagus | 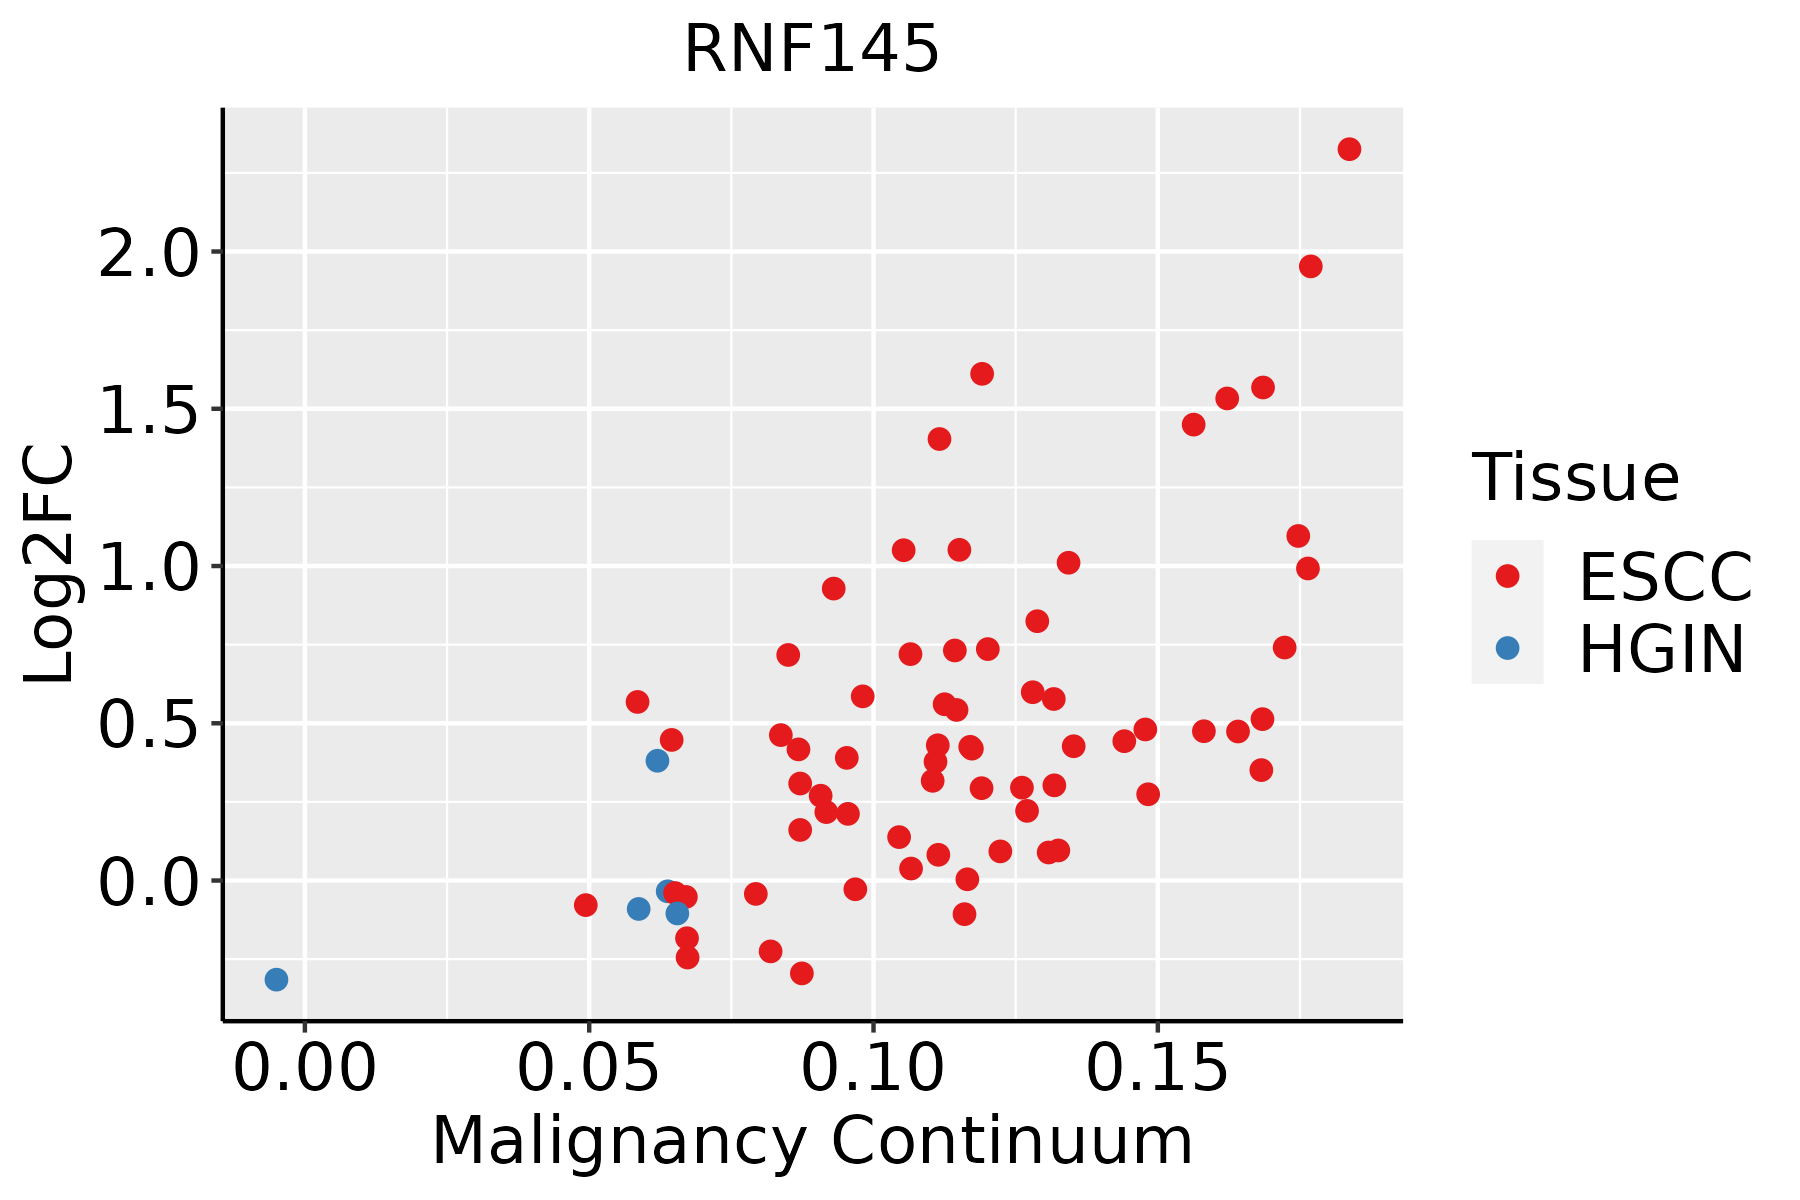 | ESCC: Esophageal squamous cell carcinoma |
| HGIN: High-grade intraepithelial neoplasias | ||
| LGIN: Low-grade intraepithelial neoplasias | ||
| Liver | 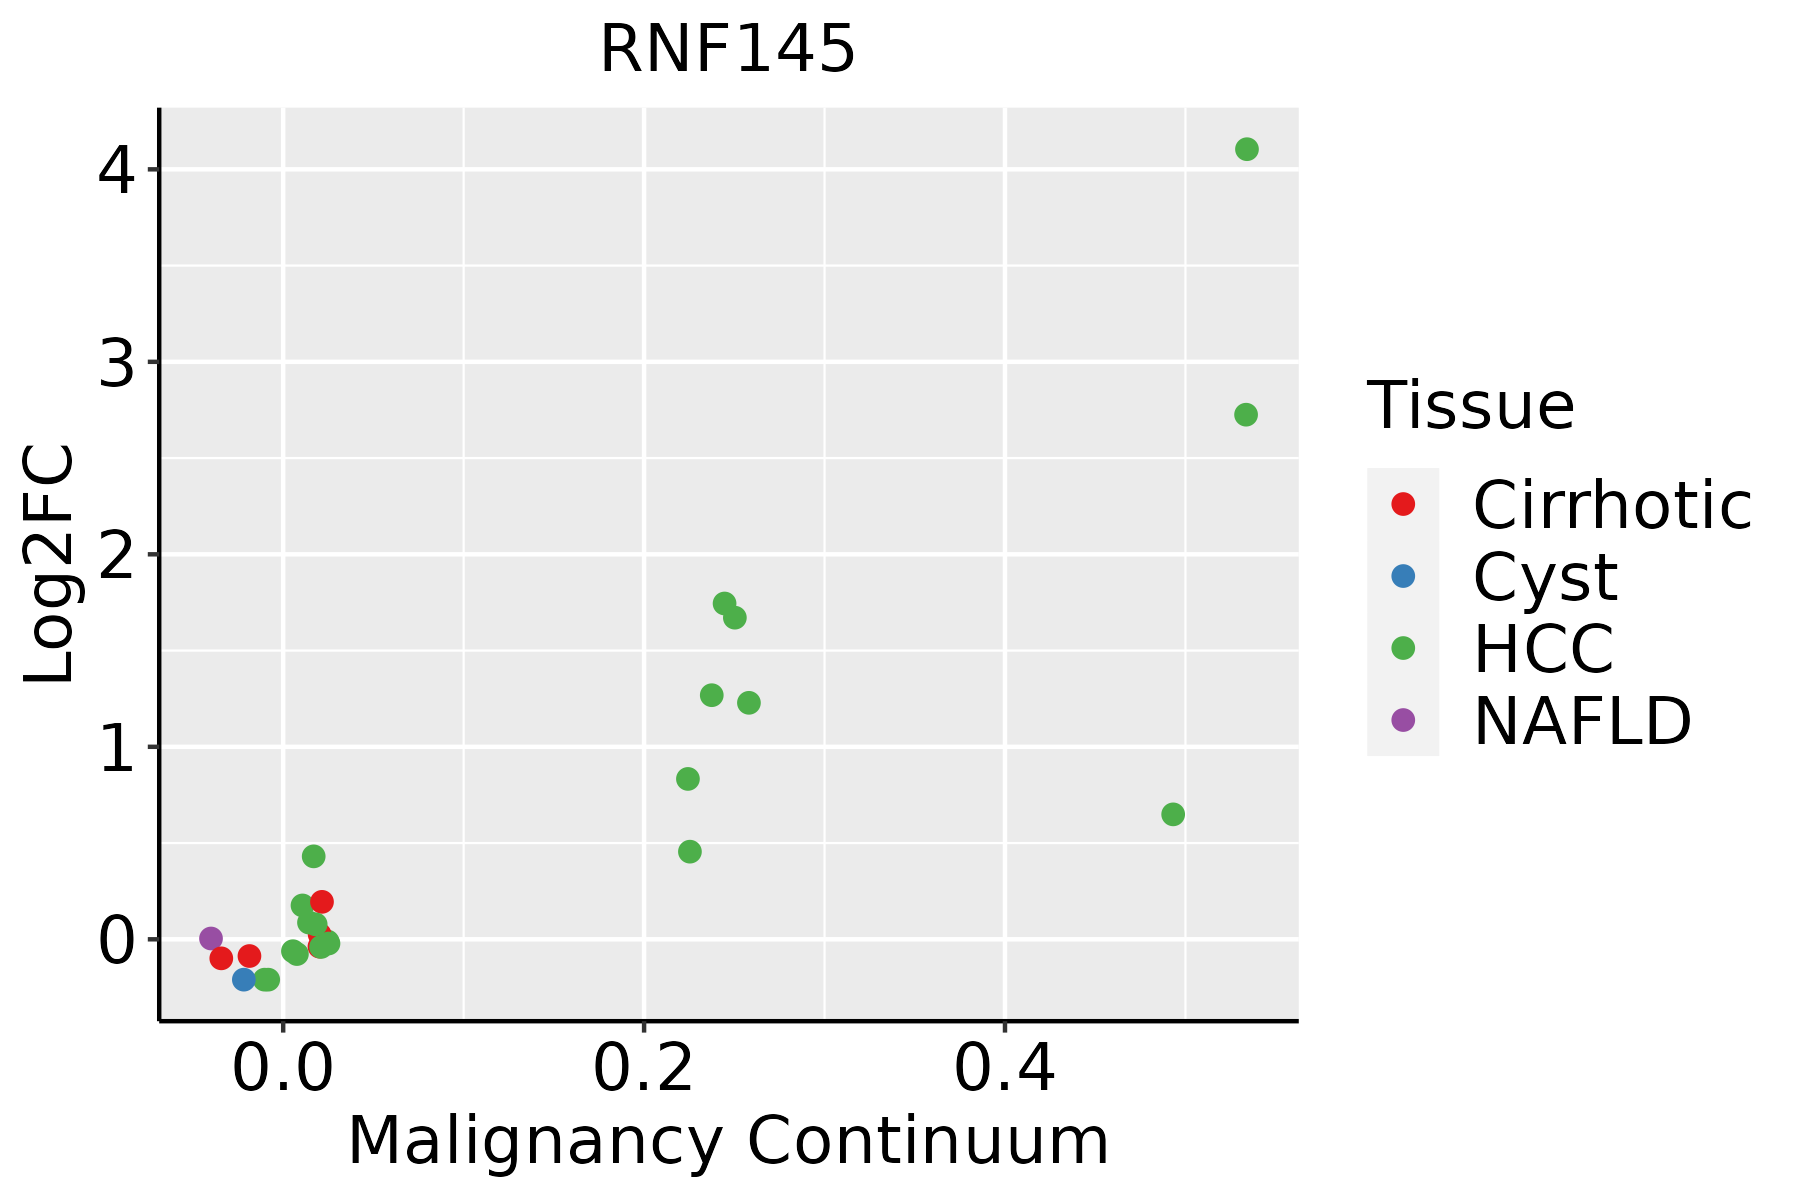 | HCC: Hepatocellular carcinoma |
| NAFLD: Non-alcoholic fatty liver disease | ||
| Oral Cavity | 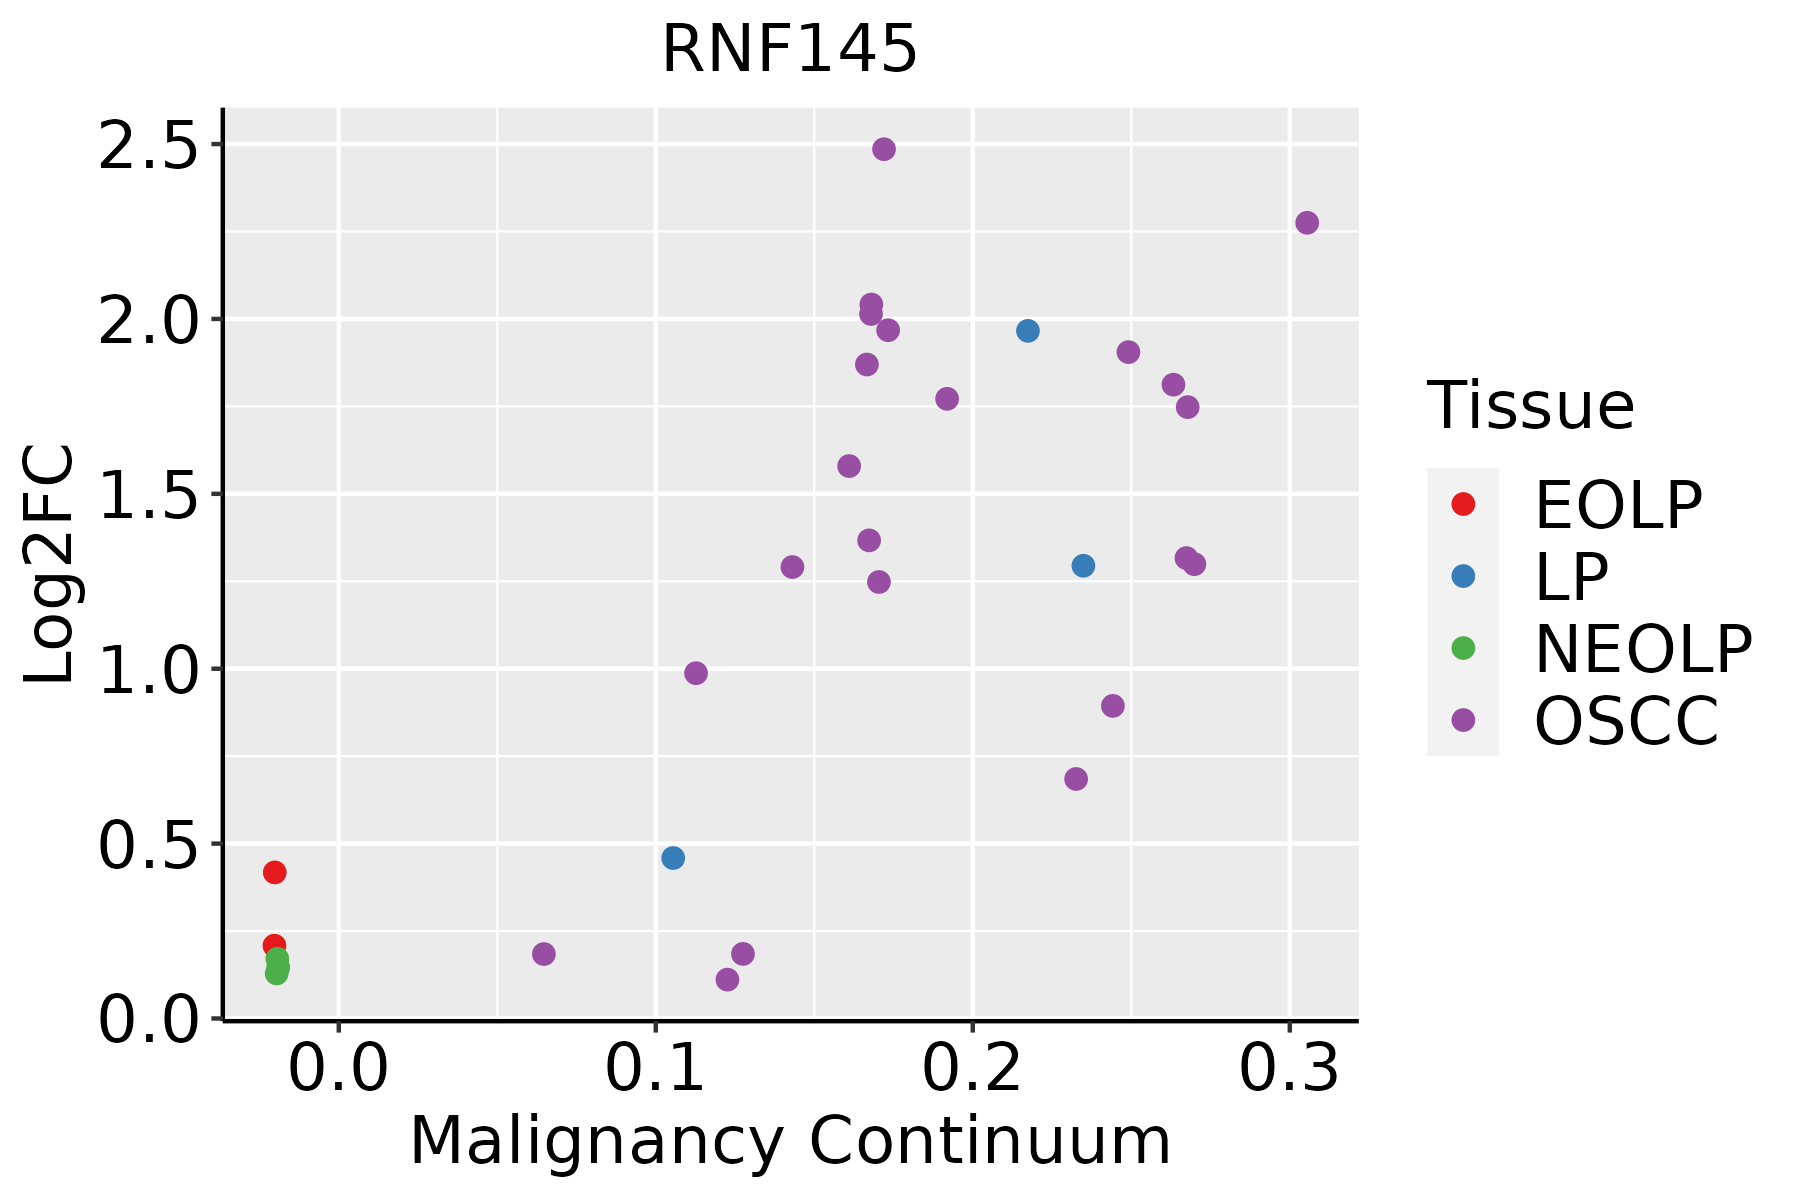 | EOLP: Erosive Oral lichen planus |
| LP: leukoplakia | ||
| NEOLP: Non-erosive oral lichen planus | ||
| OSCC: Oral squamous cell carcinoma | ||
| Prostate | 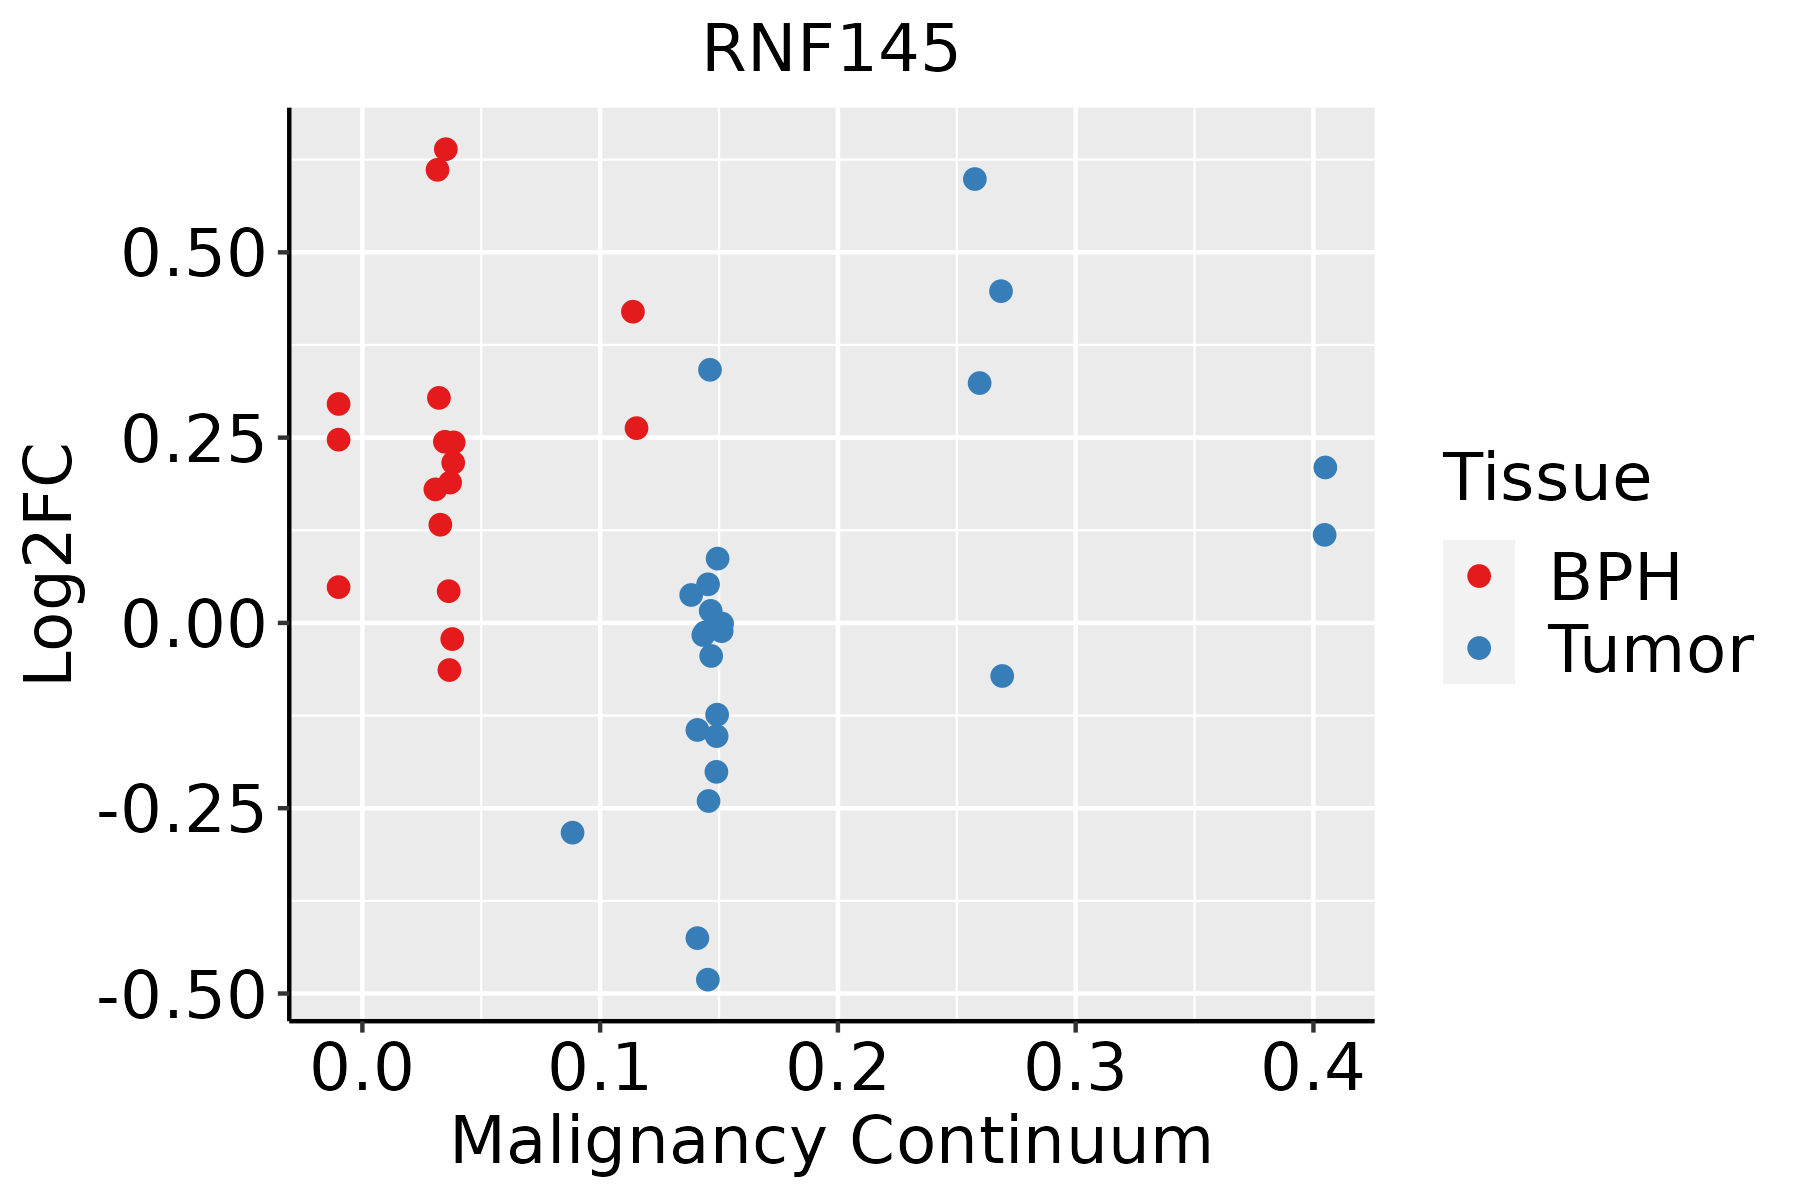 | BPH: Benign Prostatic Hyperplasia |
| Skin |  | AK: Actinic keratosis |
| cSCC: Cutaneous squamous cell carcinoma | ||
| SCCIS:squamous cell carcinoma in situ | ||
| Thyroid |  | ATC: Anaplastic thyroid cancer |
| HT: Hashimoto's thyroiditis | ||
| PTC: Papillary thyroid cancer |
| ∗log2FC in expression of this searched gene in stem-like cells from each diseased tissue sample relative to stem-like cells in normal samples in each tissue plotted against the malignancy continuum. Samples are colored based on if they are from different disease stage. |
Top |
Malignant transformation related pathway analysis |
| Find out the enriched GO biological processes and KEGG pathways involved in transition from healthy to precancer to cancer |
| Tissue | Disease Stage | Enriched GO biological Processes |
| Colorectum | AD |  |
| Colorectum | SER |  |
| Colorectum | MSS |  |
| Colorectum | MSI-H |  |
| Colorectum | FAP |  |
| ∗Top 15 enriched GO BP terms are showed in the bar plot of each disease state in each tissue. Each row represents a significant GO biological process which is colored according to the -log10(p.adjust). |
| Page: 1 2 3 4 5 6 7 8 9 |
| GO ID | Tissue | Disease Stage | Description | Gene Ratio | Bg Ratio | pvalue | p.adjust | Count |
| Page: 1 |
| Pathway ID | Tissue | Disease Stage | Description | Gene Ratio | Bg Ratio | pvalue | p.adjust | qvalue | Count |
| Page: 1 |
Top |
Cell-cell communication analysis |
| Identification of potential cell-cell interactions between two cell types and their ligand-receptor pairs for different disease states |
| Ligand | Receptor | LRpair | Pathway | Tissue | Disease Stage |
| Page: 1 |
Top |
Single-cell gene regulatory network inference analysis |
| Find out the significant the regulons (TFs) and the target genes of each regulon across cell types for different disease states |
| TF | Cell Type | Tissue | Disease Stage | Target Gene | RSS | Regulon Activity |
| ∗The dot plots of a searched regulon are shown for all cell subpopulations in each disease state of each tissue based on the regulon specific score inferred using pySCENIC and by calculating the average expression. |
| Page: 1 |
Top |
Somatic mutation of malignant transformation related genes |
| Annotation of somatic variants for genes involved in malignant transformation |
| Hugo Symbol | Variant Class | Variant Classification | dbSNP RS | HGVSc | HGVSp | HGVSp Short | SWISSPROT | BIOTYPE | SIFT | PolyPhen | Tumor Sample Barcode | Tissue | Histology | Sex | Age | Stage | Therapy Types | Drugs | Outcome |
| RNF145 | SNV | Missense_Mutation | novel | c.116N>T | p.Ala39Val | p.A39V | Q96MT1 | protein_coding | tolerated(0.13) | possibly_damaging(0.862) | TCGA-A2-A3Y0-01 | Breast | breast invasive carcinoma | Female | <65 | I/II | Chemotherapy | adriamycin | CR |
| RNF145 | SNV | Missense_Mutation | rs150853320 | c.998N>A | p.Arg333Gln | p.R333Q | Q96MT1 | protein_coding | tolerated(0.53) | benign(0.076) | TCGA-AN-A046-01 | Breast | breast invasive carcinoma | Female | >=65 | I/II | Unknown | Unknown | SD |
| RNF145 | SNV | Missense_Mutation | c.722N>C | p.Val241Ala | p.V241A | Q96MT1 | protein_coding | tolerated(0.29) | benign(0.159) | TCGA-AN-A046-01 | Breast | breast invasive carcinoma | Female | >=65 | I/II | Unknown | Unknown | SD | |
| RNF145 | SNV | Missense_Mutation | novel | c.146N>T | p.Ser49Ile | p.S49I | Q96MT1 | protein_coding | deleterious(0) | probably_damaging(0.977) | TCGA-AN-A046-01 | Breast | breast invasive carcinoma | Female | >=65 | I/II | Unknown | Unknown | SD |
| RNF145 | SNV | Missense_Mutation | c.1789G>C | p.Val597Leu | p.V597L | Q96MT1 | protein_coding | deleterious(0.02) | probably_damaging(0.939) | TCGA-BH-A0B4-01 | Breast | breast invasive carcinoma | Male | >=65 | III/IV | Hormone Therapy | tamoxiphen | SD | |
| RNF145 | SNV | Missense_Mutation | c.1517N>C | p.Glu506Ala | p.E506A | Q96MT1 | protein_coding | deleterious(0) | probably_damaging(0.99) | TCGA-C8-A26X-01 | Breast | breast invasive carcinoma | Female | <65 | I/II | Chemotherapy | 5-fluorouracil | CR | |
| RNF145 | insertion | Nonsense_Mutation | novel | c.274_274+1insTAATAACCCTCTTTTCCAGTATAAGTATTTGGCTCTTAATATGCATTATGTAG | p.Gly92ValfsTer18 | p.G92Vfs*18 | Q96MT1 | protein_coding | TCGA-C8-A1HN-01 | Breast | breast invasive carcinoma | Female | <65 | I/II | Unknown | Unknown | SD | ||
| RNF145 | SNV | Missense_Mutation | rs377687714 | c.1703C>T | p.Ala568Val | p.A568V | Q96MT1 | protein_coding | deleterious(0.01) | possibly_damaging(0.657) | TCGA-2W-A8YY-01 | Cervix | cervical & endocervical cancer | Female | <65 | I/II | Chemotherapy | cisplatin | CR |
| RNF145 | SNV | Missense_Mutation | novel | c.1832N>A | p.Ser611Tyr | p.S611Y | Q96MT1 | protein_coding | deleterious(0.03) | benign(0.191) | TCGA-EA-A43B-01 | Cervix | cervical & endocervical cancer | Female | <65 | I/II | Chemotherapy | cisplatin | CR |
| RNF145 | SNV | Missense_Mutation | c.936N>G | p.Phe312Leu | p.F312L | Q96MT1 | protein_coding | deleterious(0.01) | possibly_damaging(0.813) | TCGA-IR-A3LL-01 | Cervix | cervical & endocervical cancer | Female | <65 | I/II | Chemotherapy | cisplatin | CR |
| Page: 1 2 3 4 5 6 7 8 |
Top |
Related drugs of malignant transformation related genes |
| Identification of chemicals and drugs interact with genes involved in malignant transfromation |
| (DGIdb 4.0) |
| Entrez ID | Symbol | Category | Interaction Types | Drug Claim Name | Drug Name | PMIDs |
| Page: 1 |

Copyright 2023-Present -The University of Texas Health Science Center at Houston |