
|
|||||
|
 | |
| |
| |
| |
| |
| |
|
Gene: PTRF |
Gene summary for PTRF |
| Gene information | Species | Human | Gene symbol | PTRF | Gene ID | 284119 |
| Gene name | caveolae associated protein 1 | |
| Gene Alias | CAVIN | |
| Cytomap | 17q21.2 | |
| Gene Type | protein-coding | GO ID | GO:0006139 | UniProtAcc | Q6NZI2 |
Top |
Malignant transformation analysis |
| Identification of the aberrant gene expression in precancerous and cancerous lesions by comparing the gene expression of stem-like cells in diseased tissues with normal stem cells |
| Entrez ID | Symbol | Replicates | Species | Organ | Tissue | Adj P-value | Log2FC | Malignancy |
| 284119 | PTRF | Dong_P1 | Human | Prostate | Tumor | 9.92e-34 | 3.70e-01 | 0.035 |
| 284119 | PTRF | Dong_P3 | Human | Prostate | Tumor | 1.50e-29 | 4.06e-01 | 0.0278 |
| 284119 | PTRF | Dong_P4 | Human | Prostate | Tumor | 1.39e-12 | 3.65e-01 | 0.0292 |
| 284119 | PTRF | P7 | Human | Prostate | Tumor | 4.73e-27 | 1.15e+00 | -0.1025 |
| 284119 | PTRF | P9 | Human | Prostate | Tumor | 8.78e-31 | 9.77e-01 | -0.0285 |
| 284119 | PTRF | P10 | Human | Prostate | Tumor | 5.69e-36 | 1.47e+00 | -0.0902 |
| 284119 | PTRF | GSM5353215_PA_AUG_PB_1B_S2 | Human | Prostate | Tumor | 1.03e-11 | 9.77e-01 | 0.1557 |
| 284119 | PTRF | GSM5353216_PA_PB1A_Pool_1_3_S50_L002 | Human | Prostate | Tumor | 1.72e-12 | 1.02e+00 | 0.159 |
| 284119 | PTRF | GSM5353218_PA_PB1B_Pool_1_2_S74_L003 | Human | Prostate | Tumor | 7.60e-04 | 5.50e-01 | 0.1479 |
| 284119 | PTRF | GSM5353220_PA_PB1B_Pool_3_S51_L002 | Human | Prostate | Tumor | 1.29e-04 | 6.71e-01 | 0.1531 |
| 284119 | PTRF | GSM5353221_PA_PB2A_Pool_1_3_S25_L001 | Human | Prostate | Tumor | 4.28e-30 | 9.15e-01 | 0.1633 |
| 284119 | PTRF | GSM5353222_PA_PB2B_Pool_1_3_S52_L002 | Human | Prostate | Tumor | 8.71e-38 | 1.04e+00 | 0.1608 |
| 284119 | PTRF | GSM5353223_PA_PB2B_Pool_2_S26_L001 | Human | Prostate | Tumor | 1.41e-29 | 1.06e+00 | 0.1604 |
| 284119 | PTRF | GSM5353224_PA_PR5186_Pool_1_2_3_S27_L001 | Human | Prostate | Tumor | 1.72e-21 | 7.58e-01 | 0.1621 |
| 284119 | PTRF | GSM5353225_PA_PR5196-1_Pool_1_2_3_S53_L002 | Human | Prostate | Tumor | 6.77e-14 | 8.49e-01 | 0.1619 |
| 284119 | PTRF | GSM5353226_PA_PR5196-2_Pool_1_2_3_S54_L002 | Human | Prostate | Tumor | 1.14e-06 | 6.18e-01 | 0.159 |
| 284119 | PTRF | GSM5353227_PA_PR5199-193K_Pool_1_2_3_S55_L002 | Human | Prostate | Tumor | 3.07e-09 | 4.74e-01 | 0.1602 |
| 284119 | PTRF | GSM5353232_PA_PR5249_T1_S3_L001 | Human | Prostate | Tumor | 1.73e-03 | 5.96e-01 | 0.1439 |
| 284119 | PTRF | GSM5353236_PA_PR5251_T1_S7_L001 | Human | Prostate | Tumor | 1.52e-22 | 1.06e+00 | 0.1608 |
| 284119 | PTRF | GSM5353237_PA_PR5251_T2_S8_L001 | Human | Prostate | Tumor | 2.25e-14 | 9.61e-01 | 0.1622 |
| Page: 1 2 3 4 5 6 7 |
| Tissue | Expression Dynamics | Abbreviation |
| Endometrium | 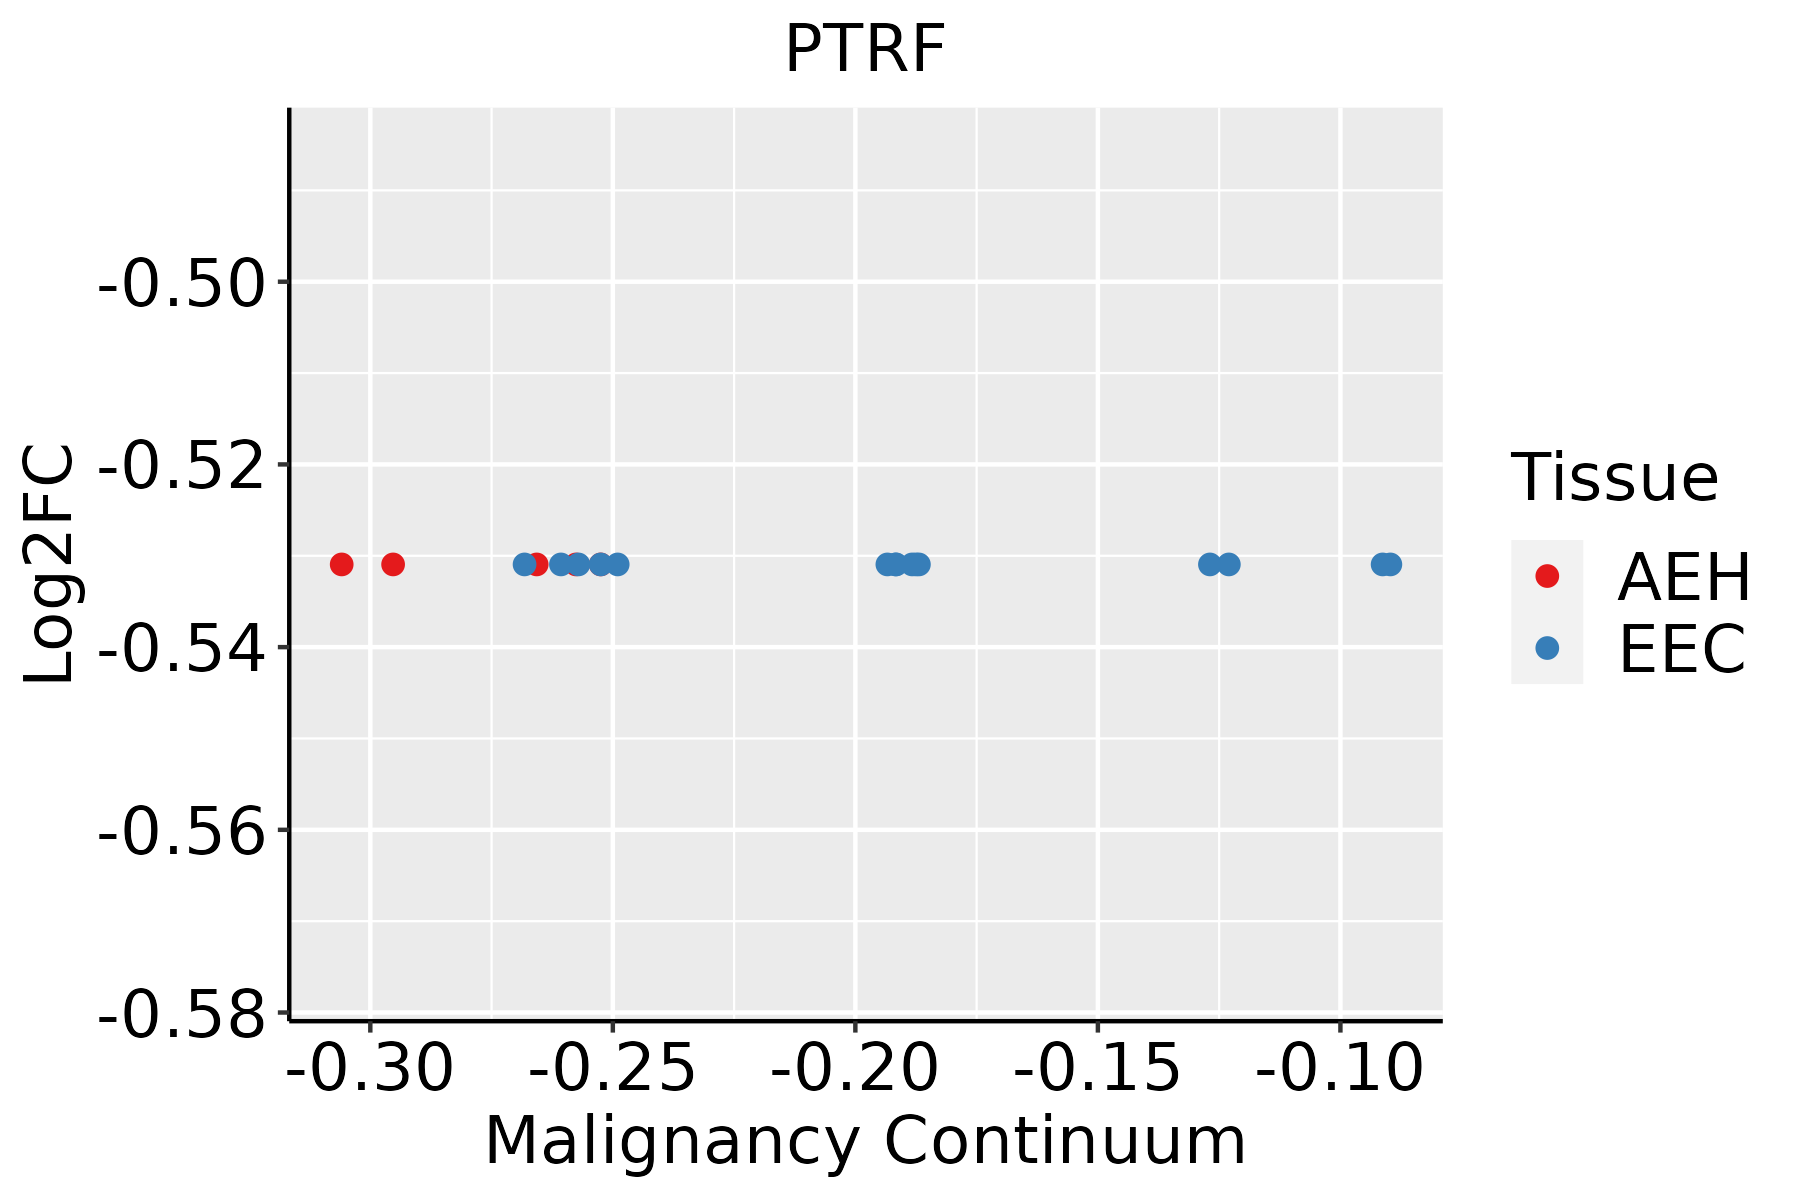 | AEH: Atypical endometrial hyperplasia |
| EEC: Endometrioid Cancer | ||
| Esophagus | 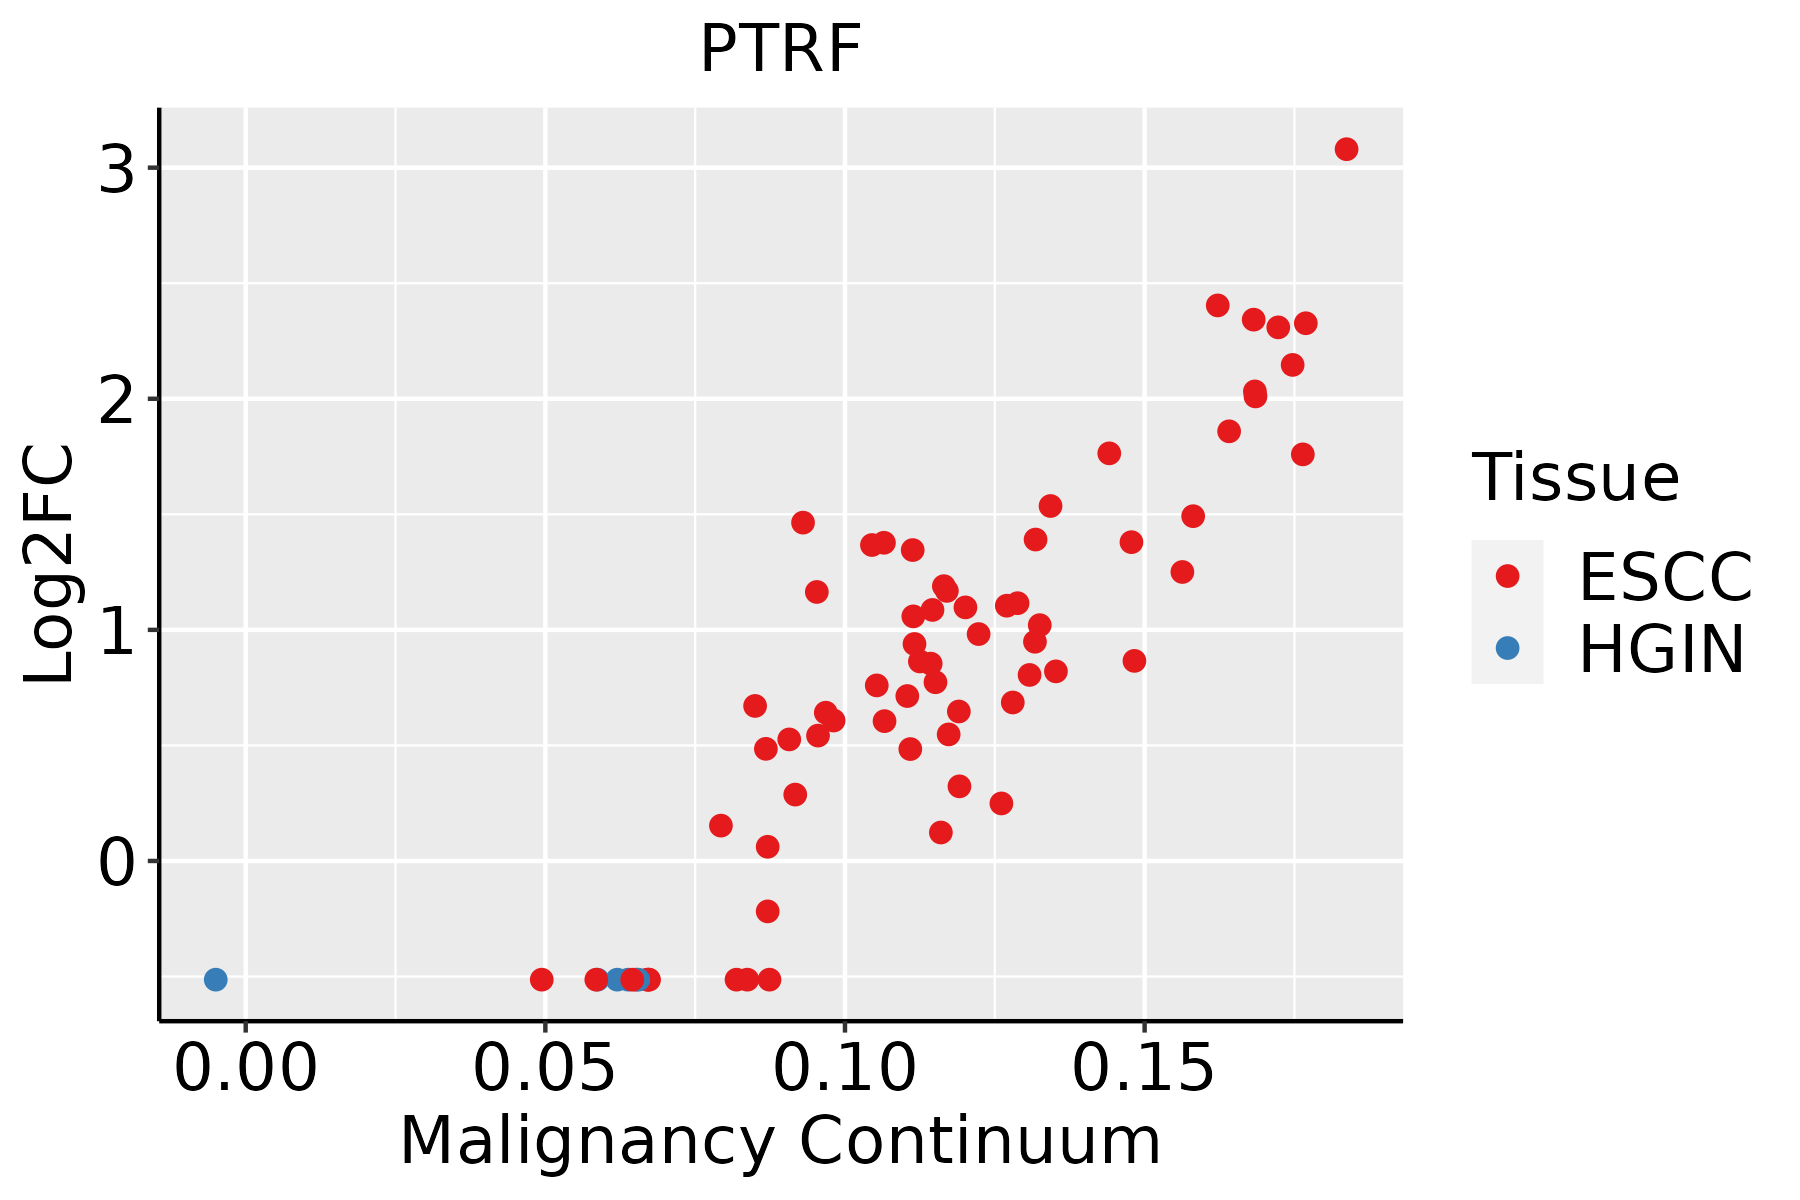 | ESCC: Esophageal squamous cell carcinoma |
| HGIN: High-grade intraepithelial neoplasias | ||
| LGIN: Low-grade intraepithelial neoplasias | ||
| Oral Cavity | 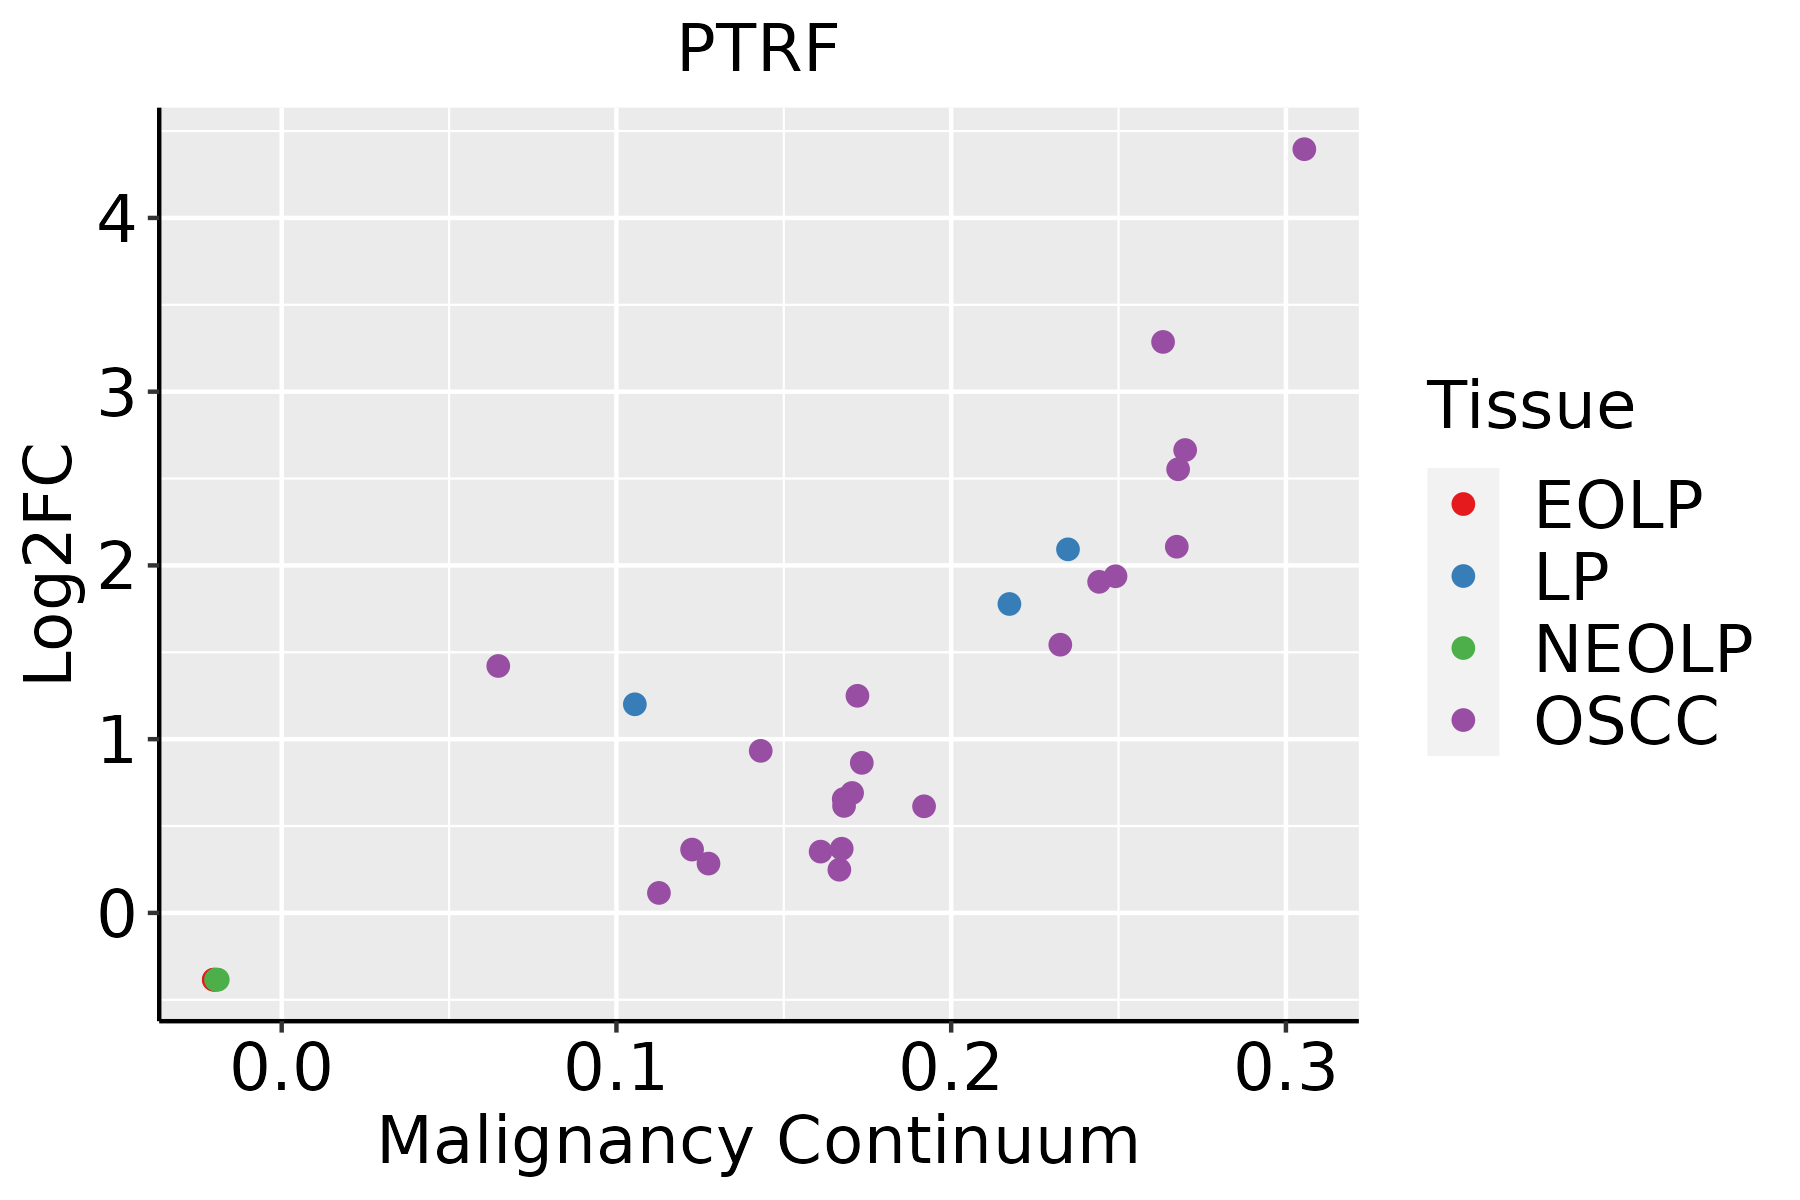 | EOLP: Erosive Oral lichen planus |
| LP: leukoplakia | ||
| NEOLP: Non-erosive oral lichen planus | ||
| OSCC: Oral squamous cell carcinoma | ||
| Prostate | 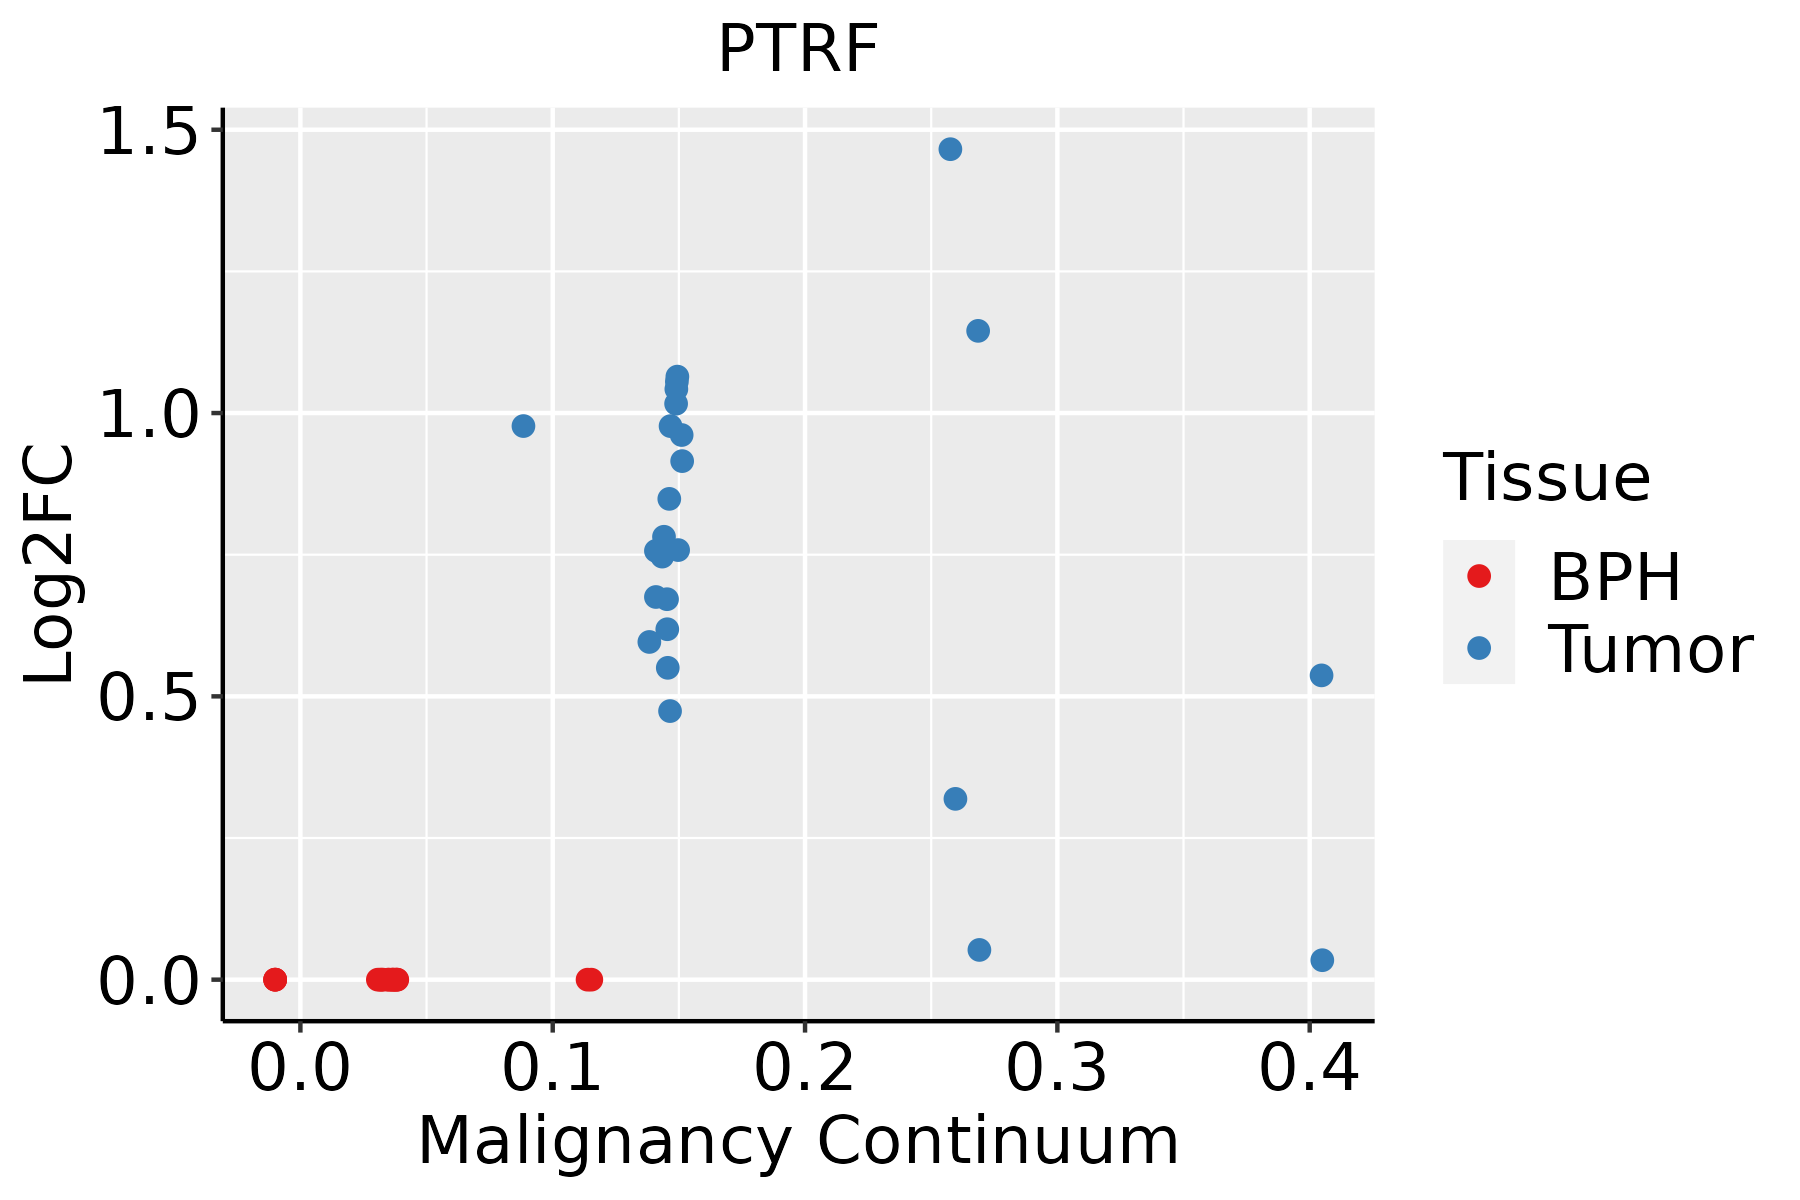 | BPH: Benign Prostatic Hyperplasia |
| Skin |  | AK: Actinic keratosis |
| cSCC: Cutaneous squamous cell carcinoma | ||
| SCCIS:squamous cell carcinoma in situ |
| ∗log2FC in expression of this searched gene in stem-like cells from each diseased tissue sample relative to stem-like cells in normal samples in each tissue plotted against the malignancy continuum. Samples are colored based on if they are from different disease stage. |
Top |
Malignant transformation related pathway analysis |
| Find out the enriched GO biological processes and KEGG pathways involved in transition from healthy to precancer to cancer |
| Tissue | Disease Stage | Enriched GO biological Processes |
| Colorectum | AD |  |
| Colorectum | SER |  |
| Colorectum | MSS |  |
| Colorectum | MSI-H |  |
| Colorectum | FAP |  |
| ∗Top 15 enriched GO BP terms are showed in the bar plot of each disease state in each tissue. Each row represents a significant GO biological process which is colored according to the -log10(p.adjust). |
| Page: 1 2 3 4 5 6 7 8 9 |
| GO ID | Tissue | Disease Stage | Description | Gene Ratio | Bg Ratio | pvalue | p.adjust | Count |
| Page: 1 |
| Pathway ID | Tissue | Disease Stage | Description | Gene Ratio | Bg Ratio | pvalue | p.adjust | qvalue | Count |
| Page: 1 |
Top |
Cell-cell communication analysis |
| Identification of potential cell-cell interactions between two cell types and their ligand-receptor pairs for different disease states |
| Ligand | Receptor | LRpair | Pathway | Tissue | Disease Stage |
| Page: 1 |
Top |
Single-cell gene regulatory network inference analysis |
| Find out the significant the regulons (TFs) and the target genes of each regulon across cell types for different disease states |
| TF | Cell Type | Tissue | Disease Stage | Target Gene | RSS | Regulon Activity |
| ∗The dot plots of a searched regulon are shown for all cell subpopulations in each disease state of each tissue based on the regulon specific score inferred using pySCENIC and by calculating the average expression. |
| Page: 1 |
Top |
Somatic mutation of malignant transformation related genes |
| Annotation of somatic variants for genes involved in malignant transformation |
| Hugo Symbol | Variant Class | Variant Classification | dbSNP RS | HGVSc | HGVSp | HGVSp Short | SWISSPROT | BIOTYPE | SIFT | PolyPhen | Tumor Sample Barcode | Tissue | Histology | Sex | Age | Stage | Therapy Types | Drugs | Outcome |
| PTRF | SNV | Missense_Mutation | novel | c.981N>C | p.Lys327Asn | p.K327N | Q6NZI2 | protein_coding | deleterious(0) | probably_damaging(0.999) | TCGA-AC-A6IW-01 | Breast | breast invasive carcinoma | Female | >=65 | I/II | Unknown | Unknown | SD |
| PTRF | SNV | Missense_Mutation | c.797N>T | p.Thr266Met | p.T266M | Q6NZI2 | protein_coding | deleterious(0) | probably_damaging(0.999) | TCGA-AO-A128-01 | Breast | breast invasive carcinoma | Female | <65 | I/II | Chemotherapy | doxorubicin | SD | |
| PTRF | SNV | Missense_Mutation | novel | c.1060N>C | p.Glu354Gln | p.E354Q | Q6NZI2 | protein_coding | tolerated(0.07) | benign(0.354) | TCGA-BH-A1F8-01 | Breast | breast invasive carcinoma | Female | >=65 | III/IV | Unknown | Unknown | PD |
| PTRF | SNV | Missense_Mutation | c.104N>T | p.Pro35Leu | p.P35L | Q6NZI2 | protein_coding | tolerated(0.12) | benign(0.001) | TCGA-D8-A1XV-01 | Breast | breast invasive carcinoma | Female | >=65 | I/II | Unknown | Unknown | SD | |
| PTRF | SNV | Missense_Mutation | novel | c.941N>T | p.Ala314Val | p.A314V | Q6NZI2 | protein_coding | deleterious(0) | benign(0.242) | TCGA-2W-A8YY-01 | Cervix | cervical & endocervical cancer | Female | <65 | I/II | Chemotherapy | cisplatin | CR |
| PTRF | SNV | Missense_Mutation | novel | c.838N>T | p.Arg280Cys | p.R280C | Q6NZI2 | protein_coding | deleterious(0) | possibly_damaging(0.862) | TCGA-VS-A9V5-01 | Cervix | cervical & endocervical cancer | Female | <65 | I/II | Chemotherapy | carboplatin | PD |
| PTRF | SNV | Missense_Mutation | c.506G>A | p.Ser169Asn | p.S169N | Q6NZI2 | protein_coding | tolerated(0.14) | benign(0.092) | TCGA-A6-6780-01 | Colorectum | colon adenocarcinoma | Male | >=65 | I/II | Unknown | Unknown | SD | |
| PTRF | SNV | Missense_Mutation | c.652N>A | p.Ala218Thr | p.A218T | Q6NZI2 | protein_coding | tolerated(0.1) | benign(0.214) | TCGA-AA-3864-01 | Colorectum | colon adenocarcinoma | Male | >=65 | I/II | Unknown | Unknown | SD | |
| PTRF | SNV | Missense_Mutation | novel | c.586N>A | p.Ala196Thr | p.A196T | Q6NZI2 | protein_coding | tolerated(0.57) | benign(0) | TCGA-AA-3950-01 | Colorectum | colon adenocarcinoma | Female | >=65 | I/II | Unknown | Unknown | SD |
| PTRF | SNV | Missense_Mutation | c.764N>T | p.Thr255Met | p.T255M | Q6NZI2 | protein_coding | deleterious(0) | probably_damaging(0.966) | TCGA-AD-5900-01 | Colorectum | colon adenocarcinoma | Male | >=65 | I/II | Unknown | Unknown | SD |
| Page: 1 2 3 4 5 6 |
Top |
Related drugs of malignant transformation related genes |
| Identification of chemicals and drugs interact with genes involved in malignant transfromation |
| (DGIdb 4.0) |
| Entrez ID | Symbol | Category | Interaction Types | Drug Claim Name | Drug Name | PMIDs |
| Page: 1 |

Copyright 2023-Present -The University of Texas Health Science Center at Houston |