
|
|||||
|
 | |
| |
| |
| |
| |
| |
|
Gene: PRRC2A |
Gene summary for PRRC2A |
| Gene information | Species | Human | Gene symbol | PRRC2A | Gene ID | 7916 |
| Gene name | proline rich coiled-coil 2A | |
| Gene Alias | BAT2 | |
| Cytomap | 6p21.33 | |
| Gene Type | protein-coding | GO ID | GO:0008150 | UniProtAcc | A0A1U9X974 |
Top |
Malignant transformation analysis |
| Identification of the aberrant gene expression in precancerous and cancerous lesions by comparing the gene expression of stem-like cells in diseased tissues with normal stem cells |
| Entrez ID | Symbol | Replicates | Species | Organ | Tissue | Adj P-value | Log2FC | Malignancy |
| 7916 | PRRC2A | C06 | Human | Oral cavity | OSCC | 1.27e-05 | 8.38e-01 | 0.2699 |
| 7916 | PRRC2A | C07 | Human | Oral cavity | OSCC | 1.76e-02 | 6.88e-01 | 0.2491 |
| 7916 | PRRC2A | C08 | Human | Oral cavity | OSCC | 1.10e-16 | 4.49e-01 | 0.1919 |
| 7916 | PRRC2A | C09 | Human | Oral cavity | OSCC | 1.54e-07 | 3.69e-01 | 0.1431 |
| 7916 | PRRC2A | LN22 | Human | Oral cavity | OSCC | 3.54e-02 | 7.78e-01 | 0.1733 |
| 7916 | PRRC2A | LN38 | Human | Oral cavity | OSCC | 3.33e-07 | 1.49e+00 | 0.168 |
| 7916 | PRRC2A | LN46 | Human | Oral cavity | OSCC | 5.35e-08 | 4.16e-01 | 0.1666 |
| 7916 | PRRC2A | LP15 | Human | Oral cavity | LP | 7.69e-08 | 1.09e+00 | 0.2174 |
| 7916 | PRRC2A | LP17 | Human | Oral cavity | LP | 7.89e-07 | 6.08e-01 | 0.2349 |
| 7916 | PRRC2A | SYSMH2 | Human | Oral cavity | OSCC | 3.84e-12 | 4.44e-01 | 0.2326 |
| 7916 | PRRC2A | SYSMH3 | Human | Oral cavity | OSCC | 1.42e-25 | 6.63e-01 | 0.2442 |
| 7916 | PRRC2A | SYSMH4 | Human | Oral cavity | OSCC | 4.83e-02 | 7.64e-02 | 0.1226 |
| 7916 | PRRC2A | SYSMH5 | Human | Oral cavity | OSCC | 3.45e-04 | 2.23e-01 | 0.0647 |
| 7916 | PRRC2A | SYSMH6 | Human | Oral cavity | OSCC | 2.55e-04 | 2.20e-01 | 0.1275 |
| 7916 | PRRC2A | P4_S8_cSCC | Human | Skin | cSCC | 2.17e-04 | 1.41e-01 | -0.3095 |
| 7916 | PRRC2A | P5_S10_cSCC | Human | Skin | cSCC | 8.24e-04 | 1.63e-01 | -0.299 |
| 7916 | PRRC2A | P1_cSCC | Human | Skin | cSCC | 1.92e-11 | 5.98e-01 | 0.0292 |
| 7916 | PRRC2A | P2_cSCC | Human | Skin | cSCC | 1.90e-13 | 4.74e-01 | -0.024 |
| 7916 | PRRC2A | P4_cSCC | Human | Skin | cSCC | 1.74e-02 | 2.39e-01 | -0.00290000000000005 |
| 7916 | PRRC2A | P10_cSCC | Human | Skin | cSCC | 8.11e-05 | 3.70e-01 | 0.1017 |
| Page: 1 2 3 4 5 6 7 |
| Tissue | Expression Dynamics | Abbreviation |
| Colorectum (GSE201348) |  | FAP: Familial adenomatous polyposis |
| CRC: Colorectal cancer | ||
| Colorectum (HTA11) |  | AD: Adenomas |
| SER: Sessile serrated lesions | ||
| MSI-H: Microsatellite-high colorectal cancer | ||
| MSS: Microsatellite stable colorectal cancer | ||
| Esophagus |  | ESCC: Esophageal squamous cell carcinoma |
| HGIN: High-grade intraepithelial neoplasias | ||
| LGIN: Low-grade intraepithelial neoplasias | ||
| Liver | 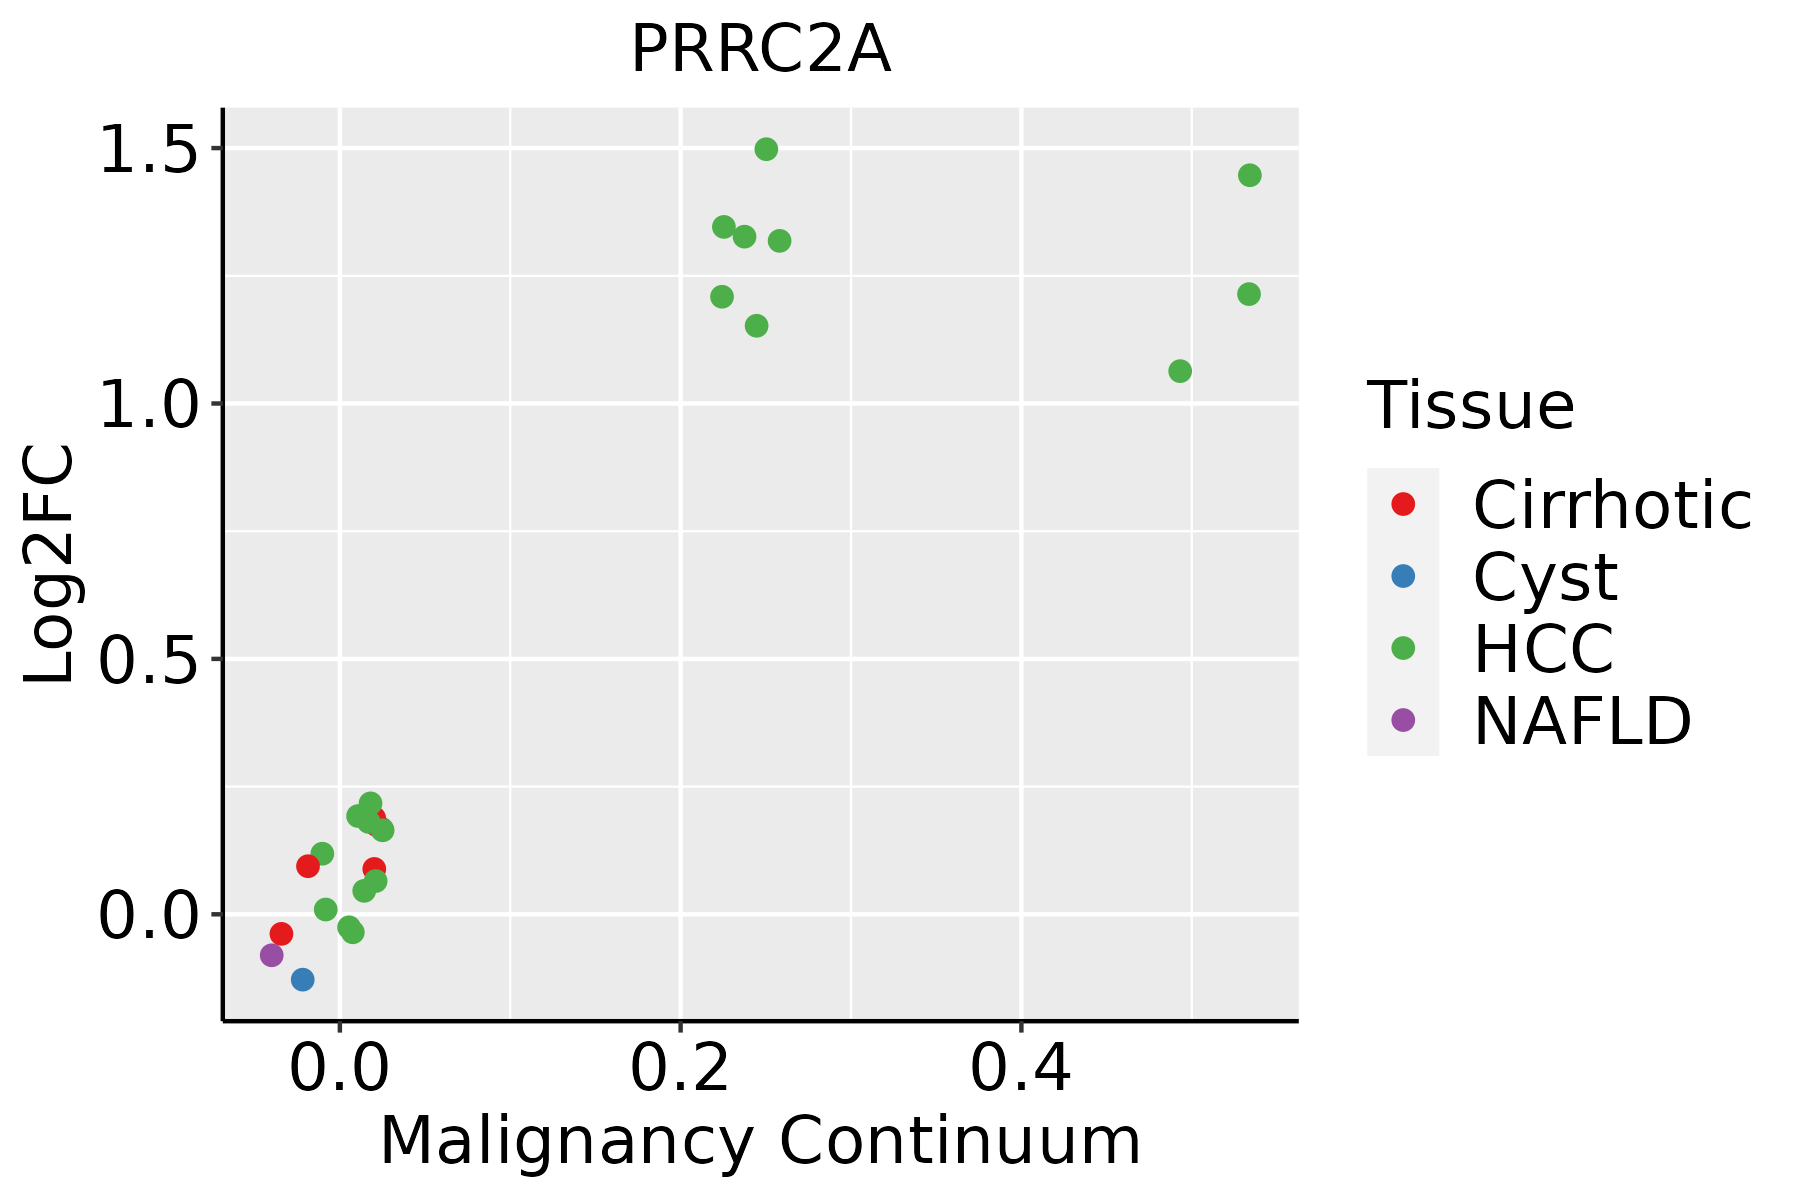 | HCC: Hepatocellular carcinoma |
| NAFLD: Non-alcoholic fatty liver disease | ||
| Oral Cavity | 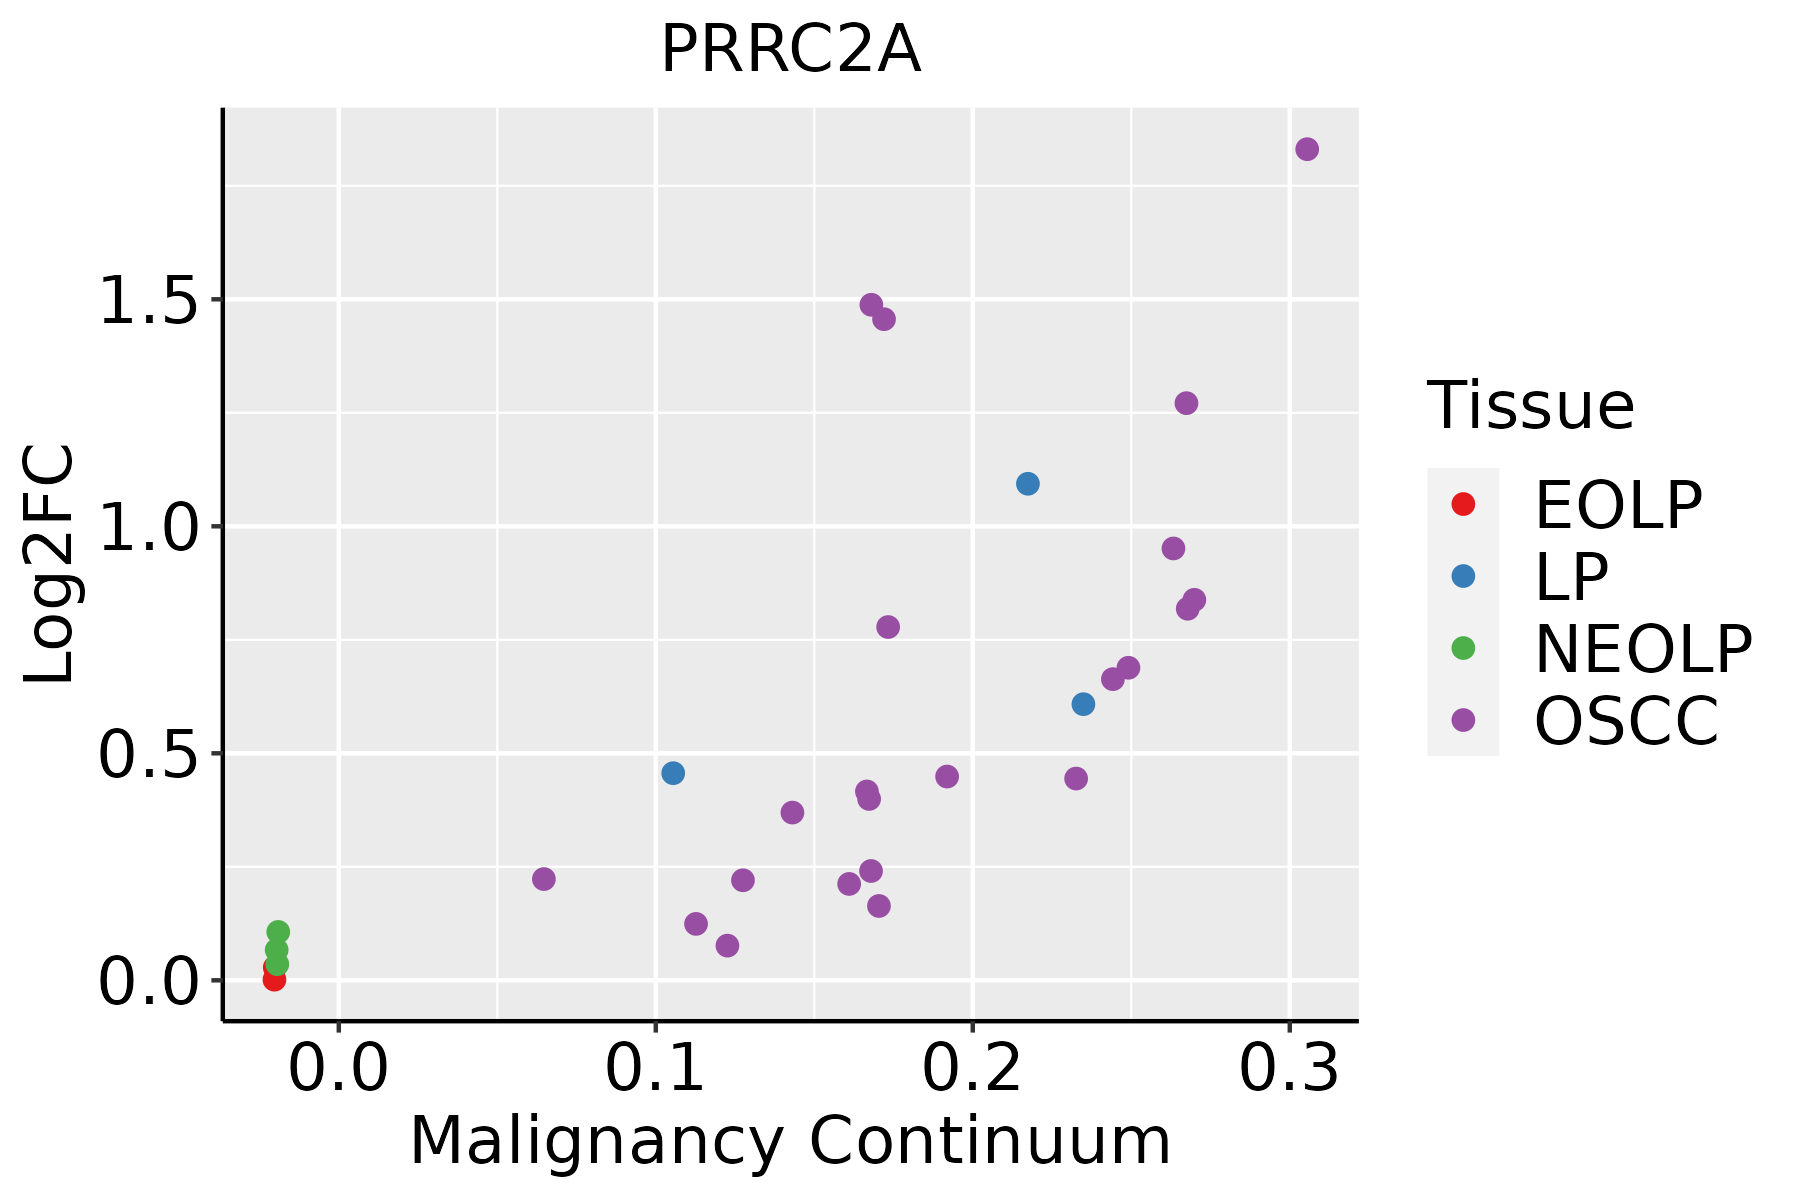 | EOLP: Erosive Oral lichen planus |
| LP: leukoplakia | ||
| NEOLP: Non-erosive oral lichen planus | ||
| OSCC: Oral squamous cell carcinoma | ||
| Prostate |  | BPH: Benign Prostatic Hyperplasia |
| Skin | 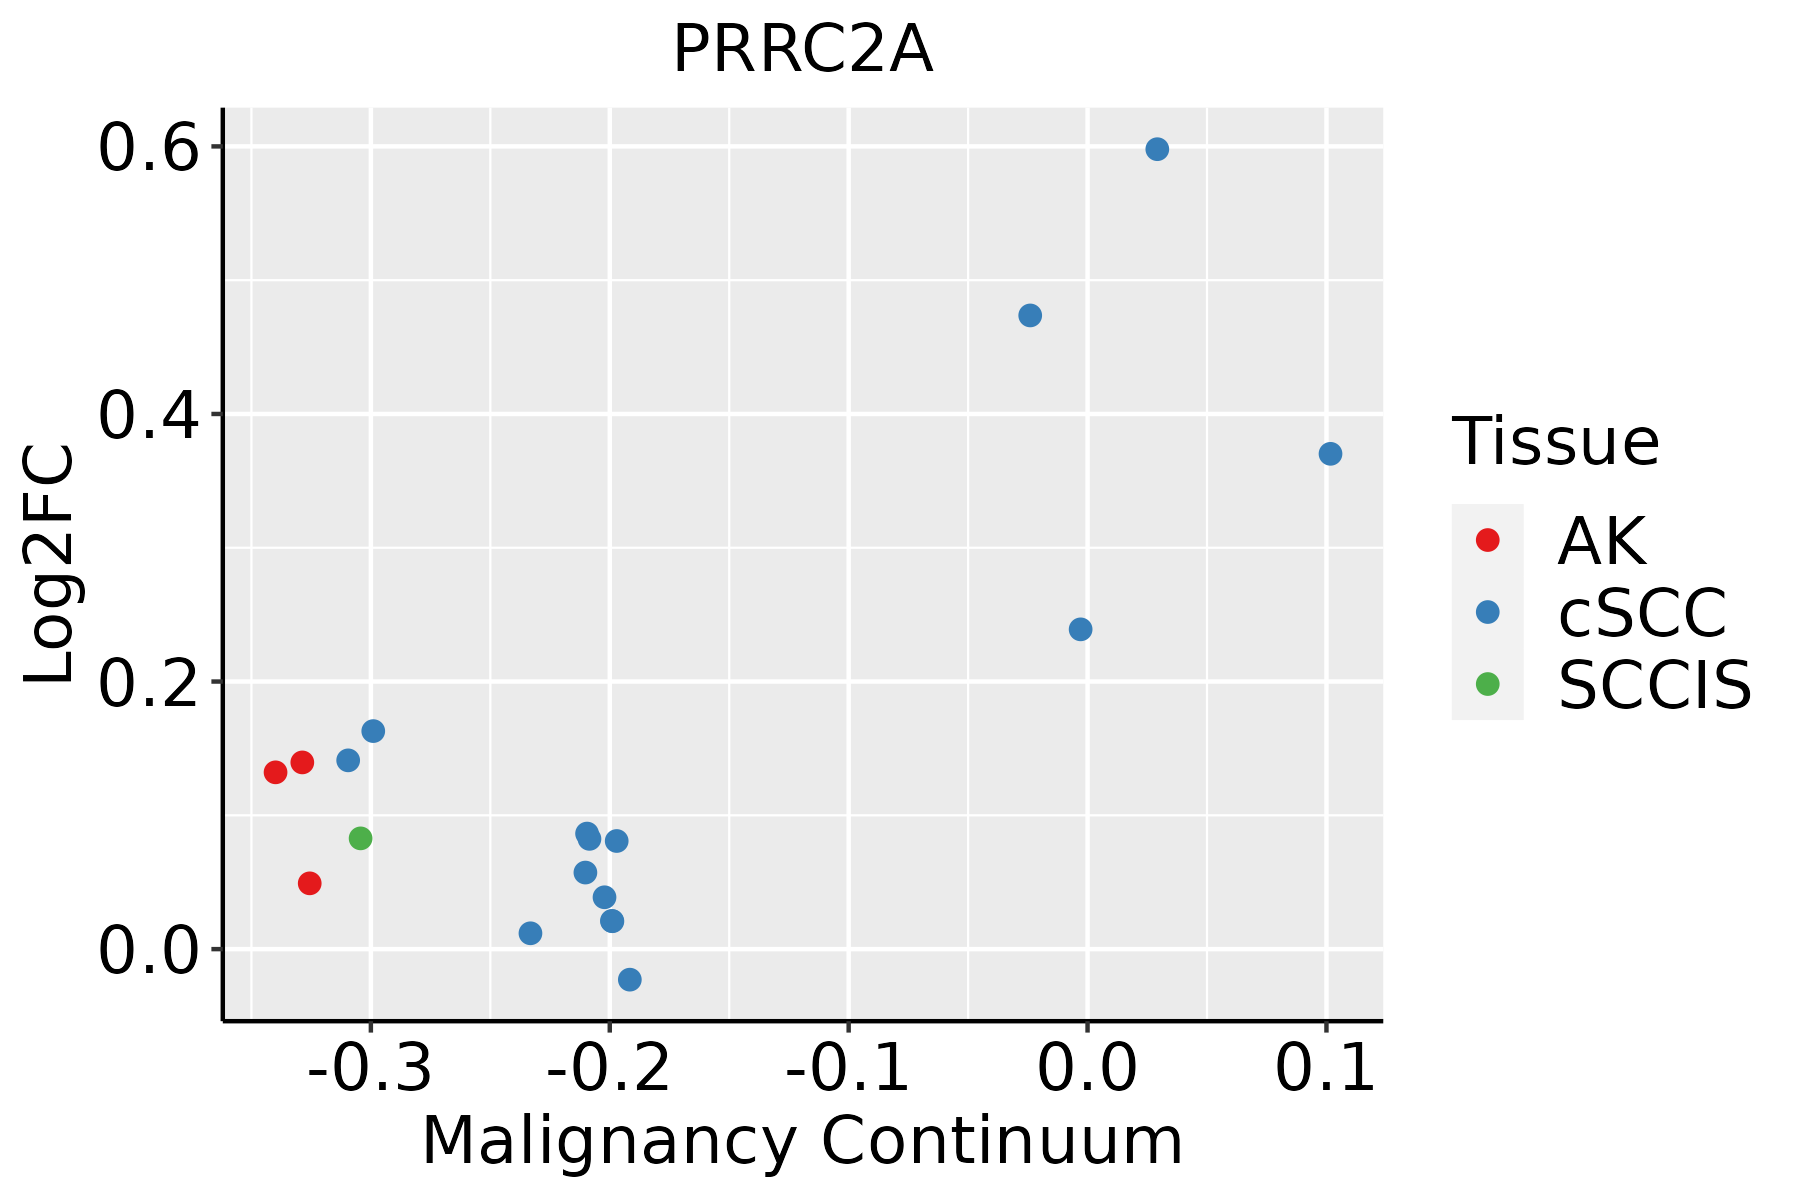 | AK: Actinic keratosis |
| cSCC: Cutaneous squamous cell carcinoma | ||
| SCCIS:squamous cell carcinoma in situ | ||
| Thyroid | 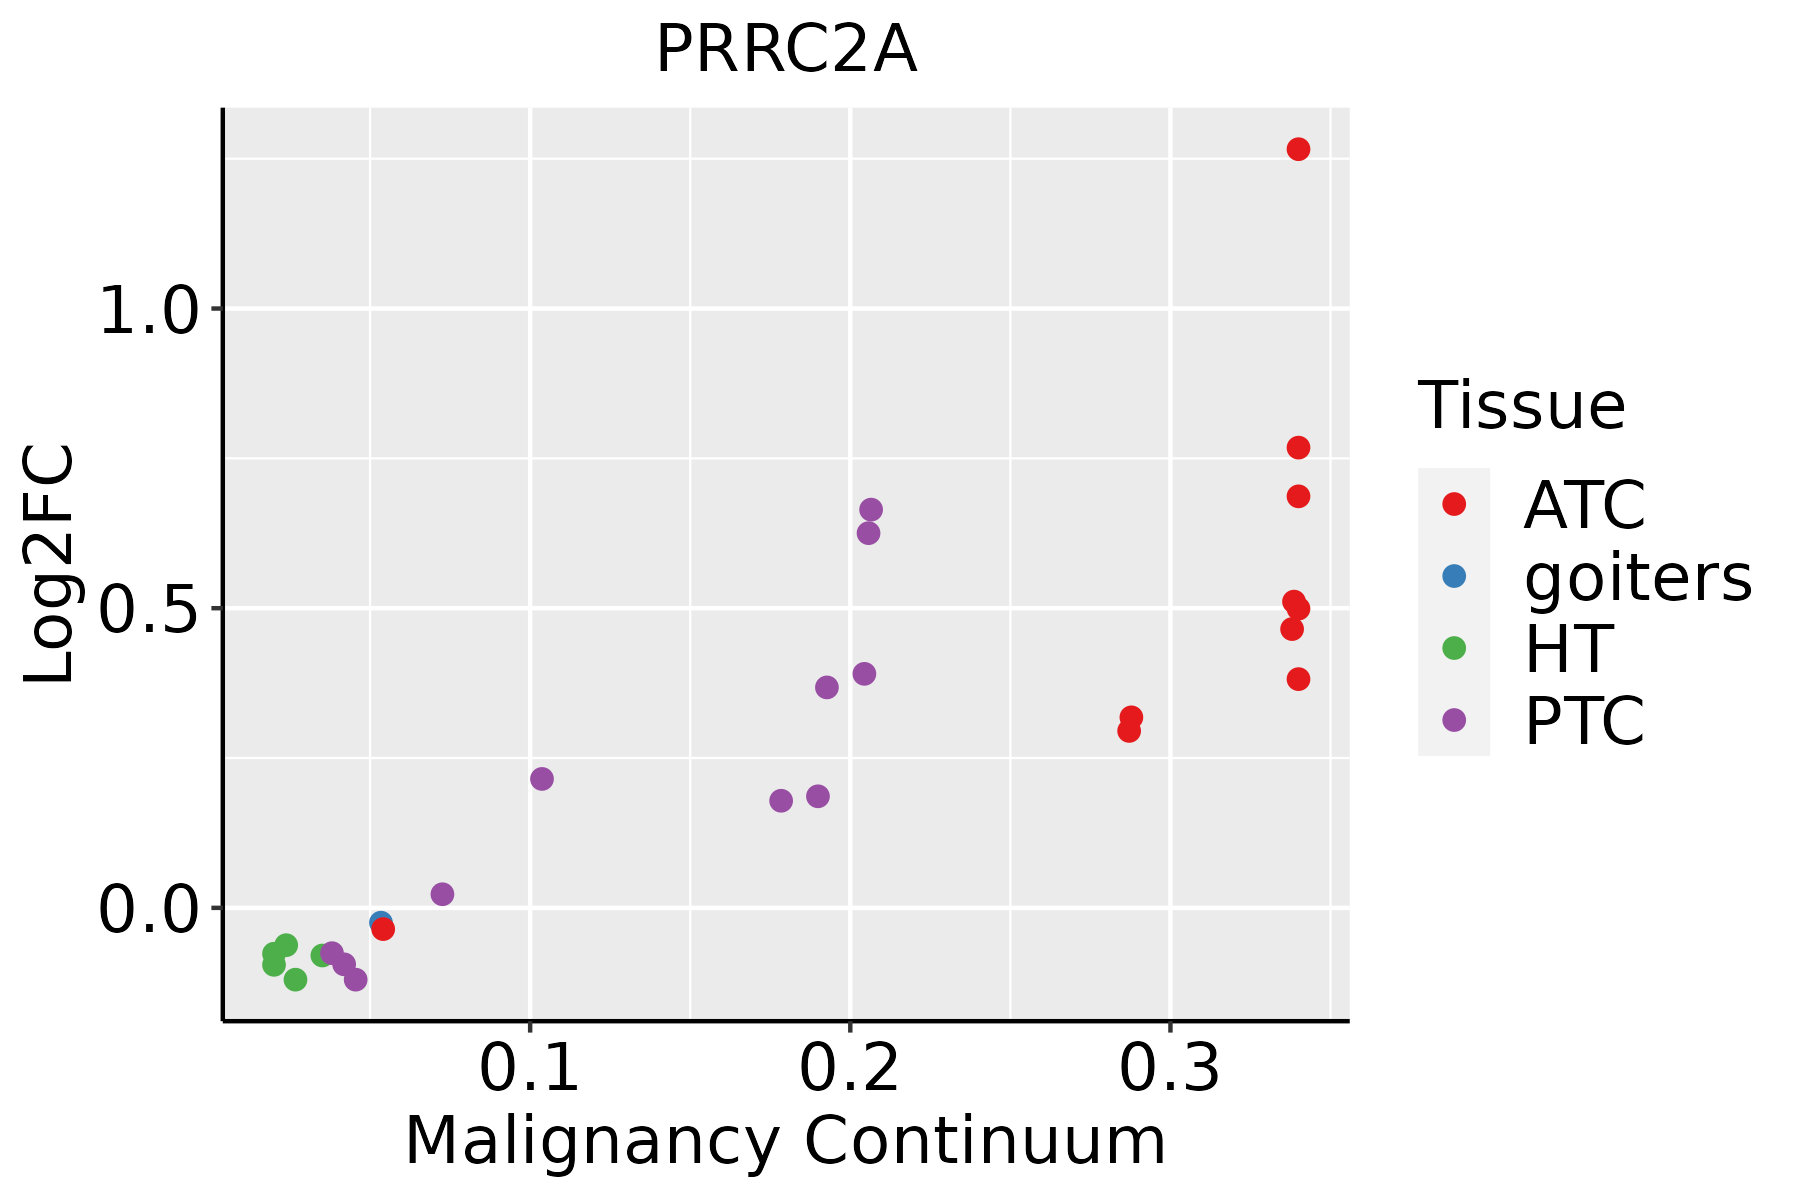 | ATC: Anaplastic thyroid cancer |
| HT: Hashimoto's thyroiditis | ||
| PTC: Papillary thyroid cancer |
| ∗log2FC in expression of this searched gene in stem-like cells from each diseased tissue sample relative to stem-like cells in normal samples in each tissue plotted against the malignancy continuum. Samples are colored based on if they are from different disease stage. |
Top |
Malignant transformation related pathway analysis |
| Find out the enriched GO biological processes and KEGG pathways involved in transition from healthy to precancer to cancer |
| Tissue | Disease Stage | Enriched GO biological Processes |
| Colorectum | AD |  |
| Colorectum | SER |  |
| Colorectum | MSS |  |
| Colorectum | MSI-H |  |
| Colorectum | FAP |  |
| ∗Top 15 enriched GO BP terms are showed in the bar plot of each disease state in each tissue. Each row represents a significant GO biological process which is colored according to the -log10(p.adjust). |
| Page: 1 2 3 4 5 6 7 8 9 |
| GO ID | Tissue | Disease Stage | Description | Gene Ratio | Bg Ratio | pvalue | p.adjust | Count |
| Page: 1 |
| Pathway ID | Tissue | Disease Stage | Description | Gene Ratio | Bg Ratio | pvalue | p.adjust | qvalue | Count |
| Page: 1 |
Top |
Cell-cell communication analysis |
| Identification of potential cell-cell interactions between two cell types and their ligand-receptor pairs for different disease states |
| Ligand | Receptor | LRpair | Pathway | Tissue | Disease Stage |
| Page: 1 |
Top |
Single-cell gene regulatory network inference analysis |
| Find out the significant the regulons (TFs) and the target genes of each regulon across cell types for different disease states |
| TF | Cell Type | Tissue | Disease Stage | Target Gene | RSS | Regulon Activity |
| ∗The dot plots of a searched regulon are shown for all cell subpopulations in each disease state of each tissue based on the regulon specific score inferred using pySCENIC and by calculating the average expression. |
| Page: 1 |
Top |
Somatic mutation of malignant transformation related genes |
| Annotation of somatic variants for genes involved in malignant transformation |
| Hugo Symbol | Variant Class | Variant Classification | dbSNP RS | HGVSc | HGVSp | HGVSp Short | SWISSPROT | BIOTYPE | SIFT | PolyPhen | Tumor Sample Barcode | Tissue | Histology | Sex | Age | Stage | Therapy Types | Drugs | Outcome |
| PRRC2A | SNV | Missense_Mutation | rs779373727 | c.649G>A | p.Glu217Lys | p.E217K | P48634 | protein_coding | tolerated(0.07) | benign(0.051) | TCGA-AC-A23H-01 | Breast | breast invasive carcinoma | Female | >=65 | I/II | Unknown | Unknown | PD |
| PRRC2A | SNV | Missense_Mutation | novel | c.2611N>A | p.Asp871Asn | p.D871N | P48634 | protein_coding | deleterious(0.02) | benign(0.031) | TCGA-AC-A5XS-01 | Breast | breast invasive carcinoma | Female | >=65 | I/II | Hormone Therapy | femara | SD |
| PRRC2A | SNV | Missense_Mutation | rs763007534 | c.2267G>A | p.Arg756Gln | p.R756Q | P48634 | protein_coding | tolerated(0.32) | probably_damaging(0.992) | TCGA-D8-A1JA-01 | Breast | breast invasive carcinoma | Female | <65 | III/IV | Chemotherapy | adriamycin | PD |
| PRRC2A | insertion | Frame_Shift_Ins | novel | c.874_875insCCTGCTTTCTTCCCCACTATTTCTCATCTCTTTACACTGTTCCC | p.Gly292AlafsTer21 | p.G292Afs*21 | P48634 | protein_coding | TCGA-A8-A07J-01 | Breast | breast invasive carcinoma | Female | <65 | I/II | Chemotherapy | 5-fluorouracil | CR | ||
| PRRC2A | deletion | Frame_Shift_Del | novel | c.238delN | p.Pro80GlnfsTer60 | p.P80Qfs*60 | P48634 | protein_coding | TCGA-EW-A2FV-01 | Breast | breast invasive carcinoma | Female | <65 | III/IV | Chemotherapy | docetaxel | SD | ||
| PRRC2A | deletion | Frame_Shift_Del | novel | c.2920_2927delNNNNNNNN | p.Glu974GlnfsTer40 | p.E974Qfs*40 | P48634 | protein_coding | TCGA-LL-A6FP-01 | Breast | breast invasive carcinoma | Female | >=65 | I/II | Hormone Therapy | arimidex | SD | ||
| PRRC2A | SNV | Missense_Mutation | c.1426C>T | p.Arg476Trp | p.R476W | P48634 | protein_coding | deleterious(0) | probably_damaging(0.998) | TCGA-2W-A8YY-01 | Cervix | cervical & endocervical cancer | Female | <65 | I/II | Chemotherapy | cisplatin | CR | |
| PRRC2A | SNV | Missense_Mutation | c.3743N>T | p.Ala1248Val | p.A1248V | P48634 | protein_coding | tolerated(0.08) | benign(0.095) | TCGA-C5-A1MH-01 | Cervix | cervical & endocervical cancer | Female | >=65 | III/IV | Chemotherapy | cisplatin | PD | |
| PRRC2A | SNV | Missense_Mutation | c.1327N>A | p.Glu443Lys | p.E443K | P48634 | protein_coding | deleterious(0) | possibly_damaging(0.761) | TCGA-EK-A2RK-01 | Cervix | cervical & endocervical cancer | Female | >=65 | I/II | Unknown | Unknown | SD | |
| PRRC2A | SNV | Missense_Mutation | c.1519N>C | p.Glu507Gln | p.E507Q | P48634 | protein_coding | tolerated(0.41) | possibly_damaging(0.55) | TCGA-EK-A2RK-01 | Cervix | cervical & endocervical cancer | Female | >=65 | I/II | Unknown | Unknown | SD |
| Page: 1 2 3 4 5 6 7 8 9 10 11 12 13 14 15 16 17 18 |
Top |
Related drugs of malignant transformation related genes |
| Identification of chemicals and drugs interact with genes involved in malignant transfromation |
| (DGIdb 4.0) |
| Entrez ID | Symbol | Category | Interaction Types | Drug Claim Name | Drug Name | PMIDs |
| 7916 | PRRC2A | NA | carbamazepine | CARBAMAZEPINE | 16538176 | |
| 7916 | PRRC2A | NA | carboplatin | CARBOPLATIN | 31616045 | |
| 7916 | PRRC2A | NA | gemcitabine | GEMCITABINE | 31616045 |
| Page: 1 |

Copyright 2023-Present -The University of Texas Health Science Center at Houston |