
|
|||||
|
 | |
| |
| |
| |
| |
| |
|
Gene: PRR13 |
Gene summary for PRR13 |
| Gene information | Species | Human | Gene symbol | PRR13 | Gene ID | 54458 |
| Gene name | proline rich 13 | |
| Gene Alias | TXR1 | |
| Cytomap | 12q13.13 | |
| Gene Type | protein-coding | GO ID | GO:0005575 | UniProtAcc | Q9NZ81 |
Top |
Malignant transformation analysis |
| Identification of the aberrant gene expression in precancerous and cancerous lesions by comparing the gene expression of stem-like cells in diseased tissues with normal stem cells |
| Entrez ID | Symbol | Replicates | Species | Organ | Tissue | Adj P-value | Log2FC | Malignancy |
| 54458 | PRR13 | P127T-E | Human | Esophagus | ESCC | 6.70e-37 | 8.16e-01 | 0.0826 |
| 54458 | PRR13 | P128T-E | Human | Esophagus | ESCC | 5.32e-65 | 2.87e+00 | 0.1241 |
| 54458 | PRR13 | P130T-E | Human | Esophagus | ESCC | 1.77e-101 | 2.48e+00 | 0.1676 |
| 54458 | PRR13 | S43 | Human | Liver | Cirrhotic | 3.19e-13 | -3.59e-01 | -0.0187 |
| 54458 | PRR13 | HCC1_Meng | Human | Liver | HCC | 6.24e-85 | 1.94e-01 | 0.0246 |
| 54458 | PRR13 | HCC2_Meng | Human | Liver | HCC | 3.44e-56 | 4.79e-01 | 0.0107 |
| 54458 | PRR13 | cirrhotic1 | Human | Liver | Cirrhotic | 4.67e-26 | 3.12e-01 | 0.0202 |
| 54458 | PRR13 | cirrhotic2 | Human | Liver | Cirrhotic | 3.88e-23 | 3.21e-01 | 0.0201 |
| 54458 | PRR13 | cirrhotic3 | Human | Liver | Cirrhotic | 4.81e-24 | 2.45e-01 | 0.0215 |
| 54458 | PRR13 | HCC1 | Human | Liver | HCC | 8.31e-13 | 4.69e+00 | 0.5336 |
| 54458 | PRR13 | HCC2 | Human | Liver | HCC | 7.14e-19 | 4.72e+00 | 0.5341 |
| 54458 | PRR13 | Pt13.a | Human | Liver | HCC | 4.43e-04 | 1.15e-01 | 0.021 |
| 54458 | PRR13 | Pt13.b | Human | Liver | HCC | 4.78e-28 | 8.71e-02 | 0.0251 |
| 54458 | PRR13 | Pt14.a | Human | Liver | HCC | 1.61e-09 | 2.18e-01 | 0.0169 |
| 54458 | PRR13 | Pt14.b | Human | Liver | HCC | 6.76e-04 | 4.60e-02 | 0.018 |
| 54458 | PRR13 | S014 | Human | Liver | HCC | 6.12e-32 | 1.68e+00 | 0.2254 |
| 54458 | PRR13 | S015 | Human | Liver | HCC | 4.69e-28 | 2.13e+00 | 0.2375 |
| 54458 | PRR13 | S016 | Human | Liver | HCC | 1.17e-31 | 1.82e+00 | 0.2243 |
| 54458 | PRR13 | S027 | Human | Liver | HCC | 8.95e-15 | 1.78e+00 | 0.2446 |
| 54458 | PRR13 | S028 | Human | Liver | HCC | 6.92e-27 | 2.21e+00 | 0.2503 |
| Page: 1 2 3 4 5 6 7 8 9 10 |
| Tissue | Expression Dynamics | Abbreviation |
| Colorectum (GSE201348) |  | FAP: Familial adenomatous polyposis |
| CRC: Colorectal cancer | ||
| Colorectum (HTA11) |  | AD: Adenomas |
| SER: Sessile serrated lesions | ||
| MSI-H: Microsatellite-high colorectal cancer | ||
| MSS: Microsatellite stable colorectal cancer | ||
| Esophagus | 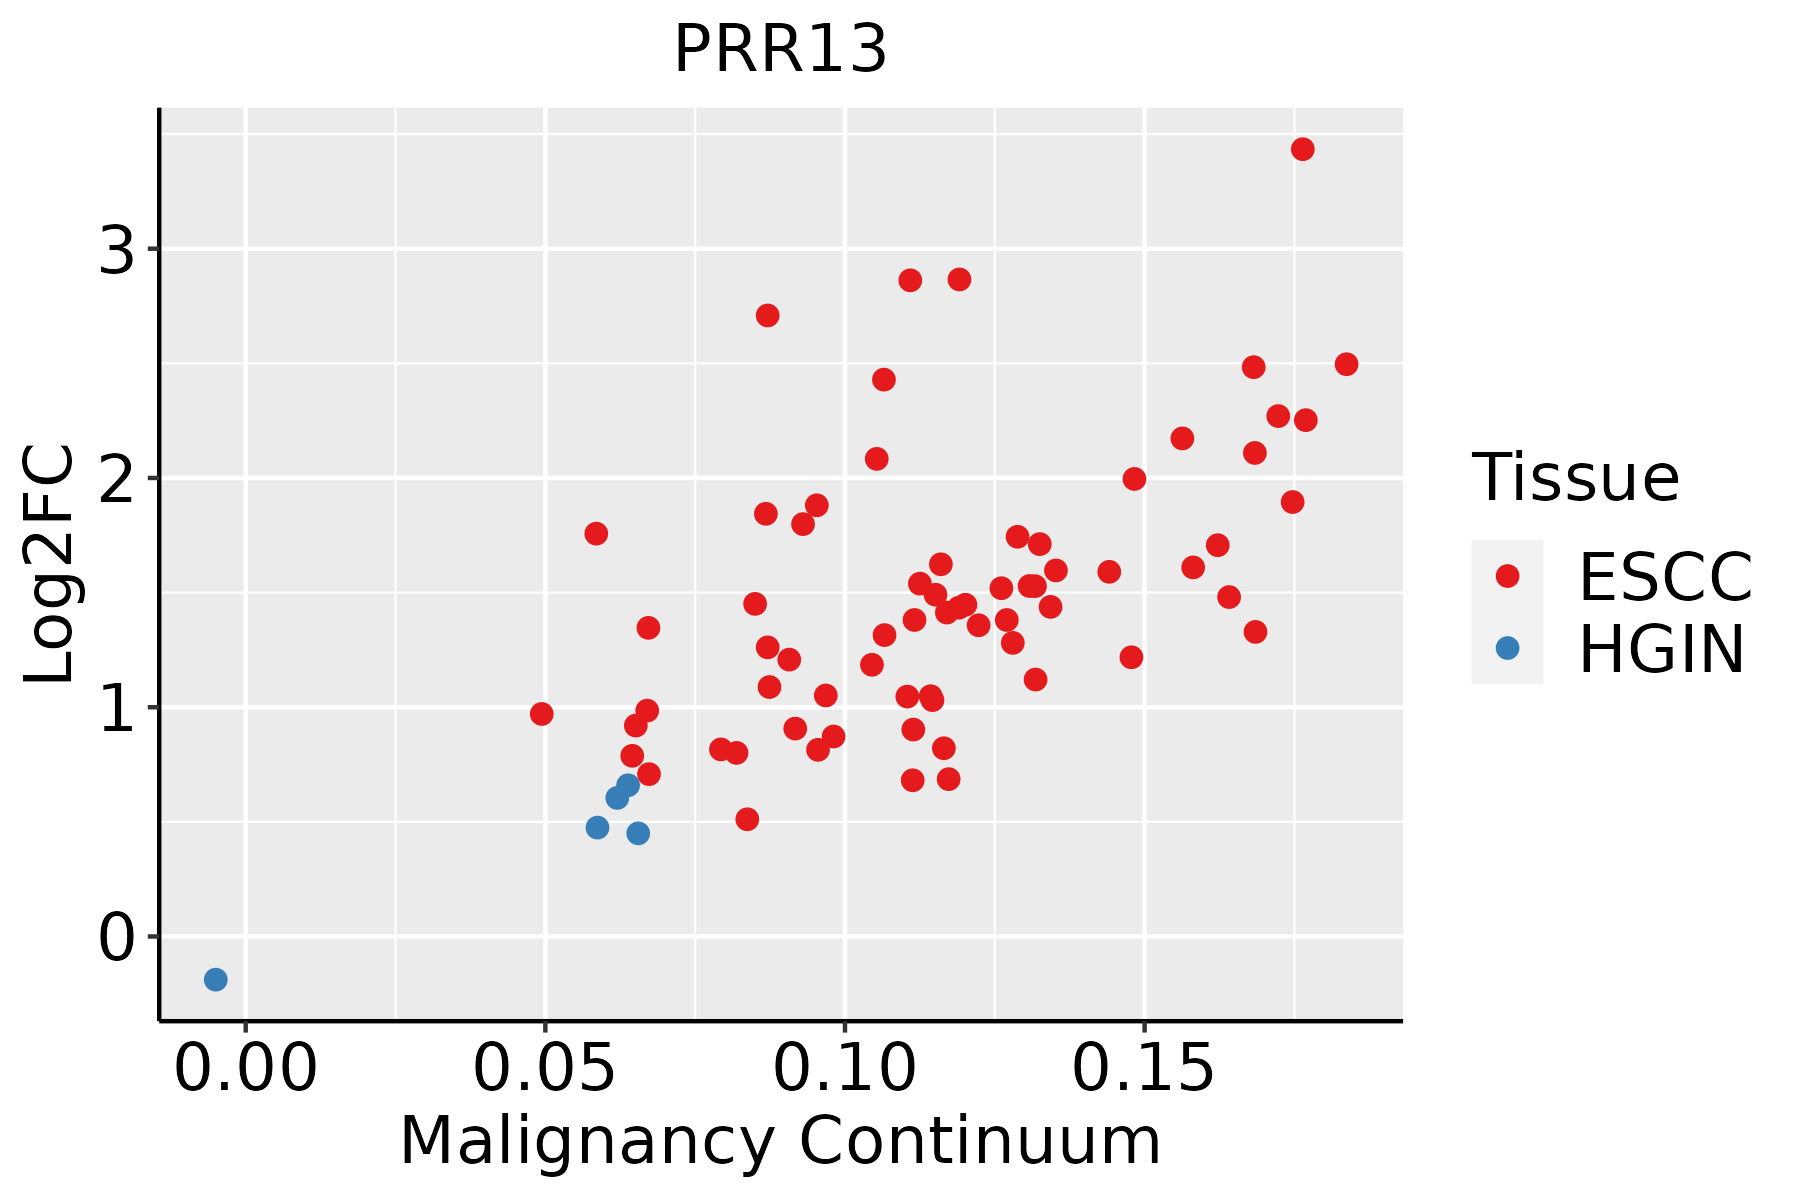 | ESCC: Esophageal squamous cell carcinoma |
| HGIN: High-grade intraepithelial neoplasias | ||
| LGIN: Low-grade intraepithelial neoplasias | ||
| GC | 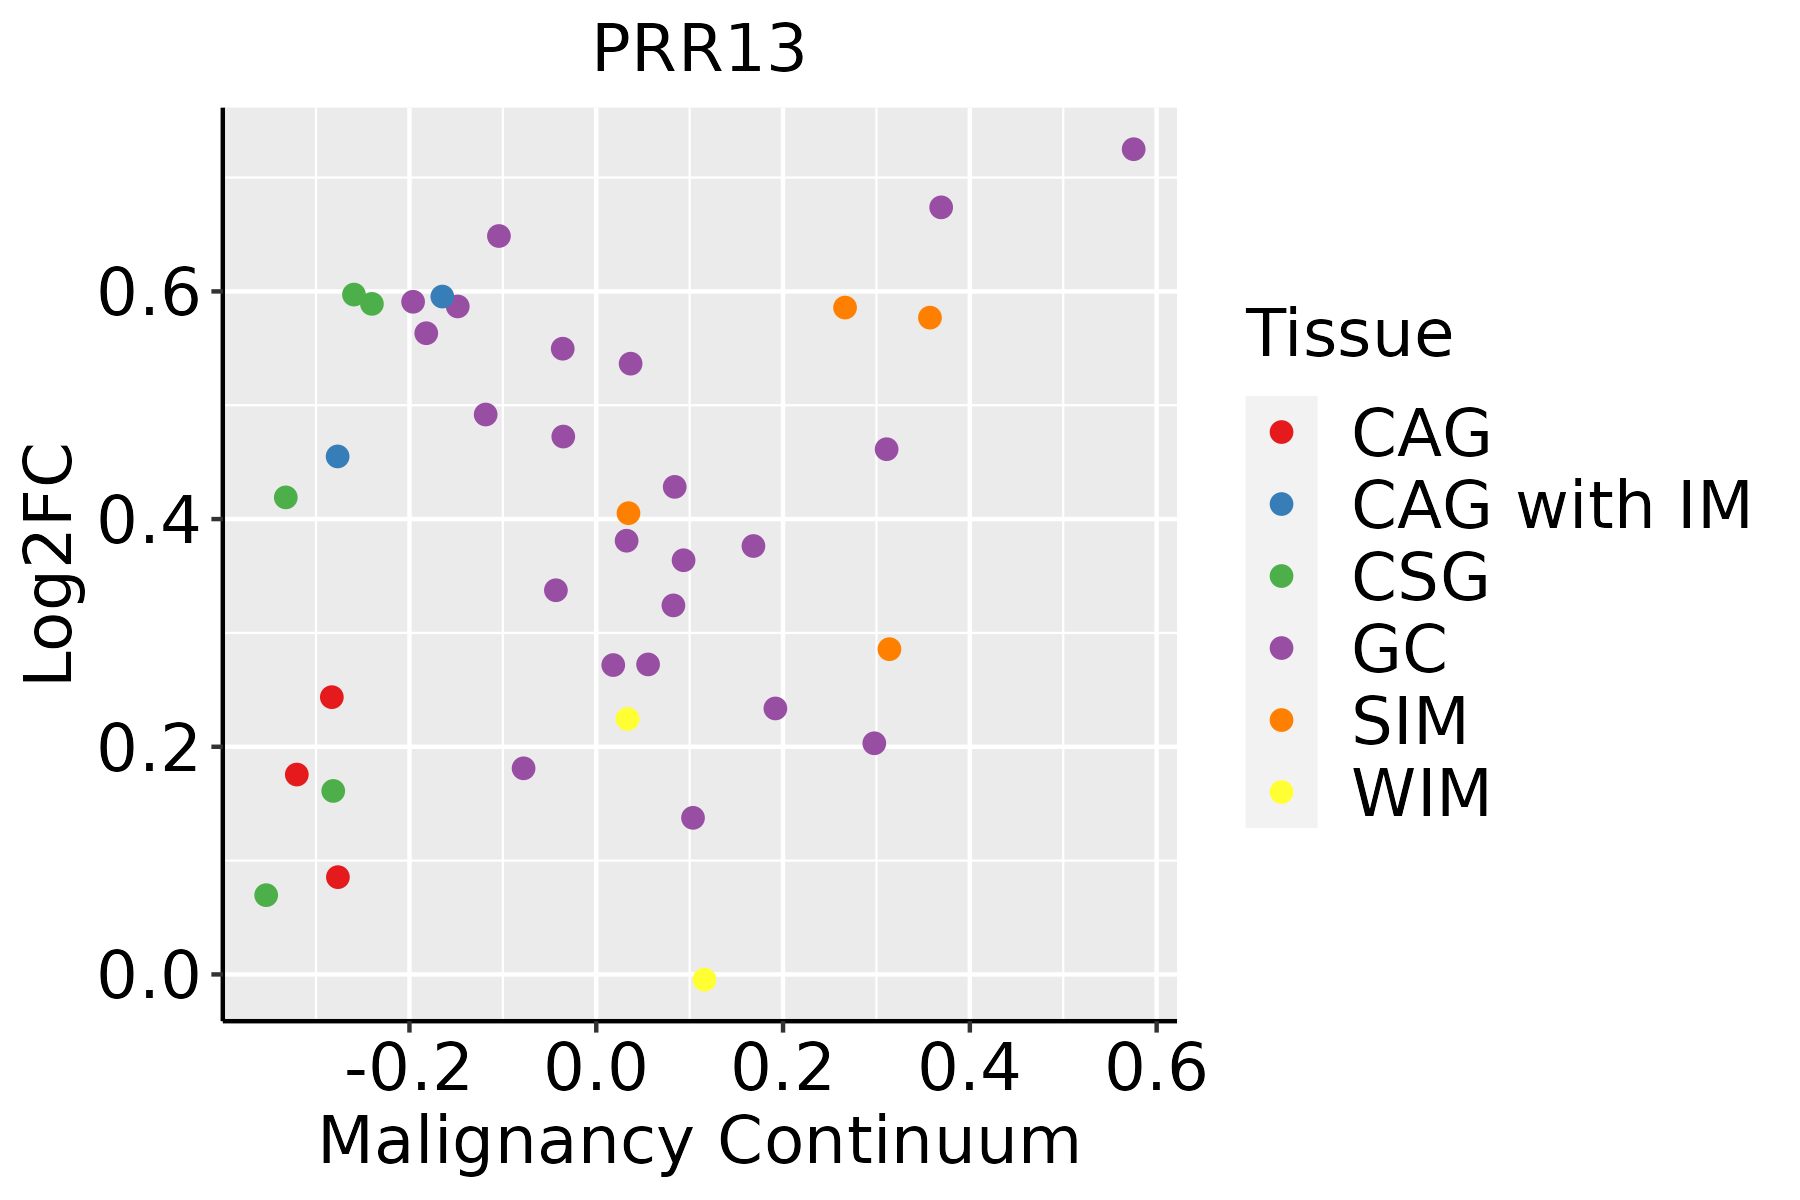 | CAG: Chronic atrophic gastritis |
| CAG with IM: Chronic atrophic gastritis with intestinal metaplasia | ||
| CSG: Chronic superficial gastritis | ||
| GC: Gastric cancer | ||
| SIM: Severe intestinal metaplasia | ||
| WIM: Wild intestinal metaplasia | ||
| Liver | 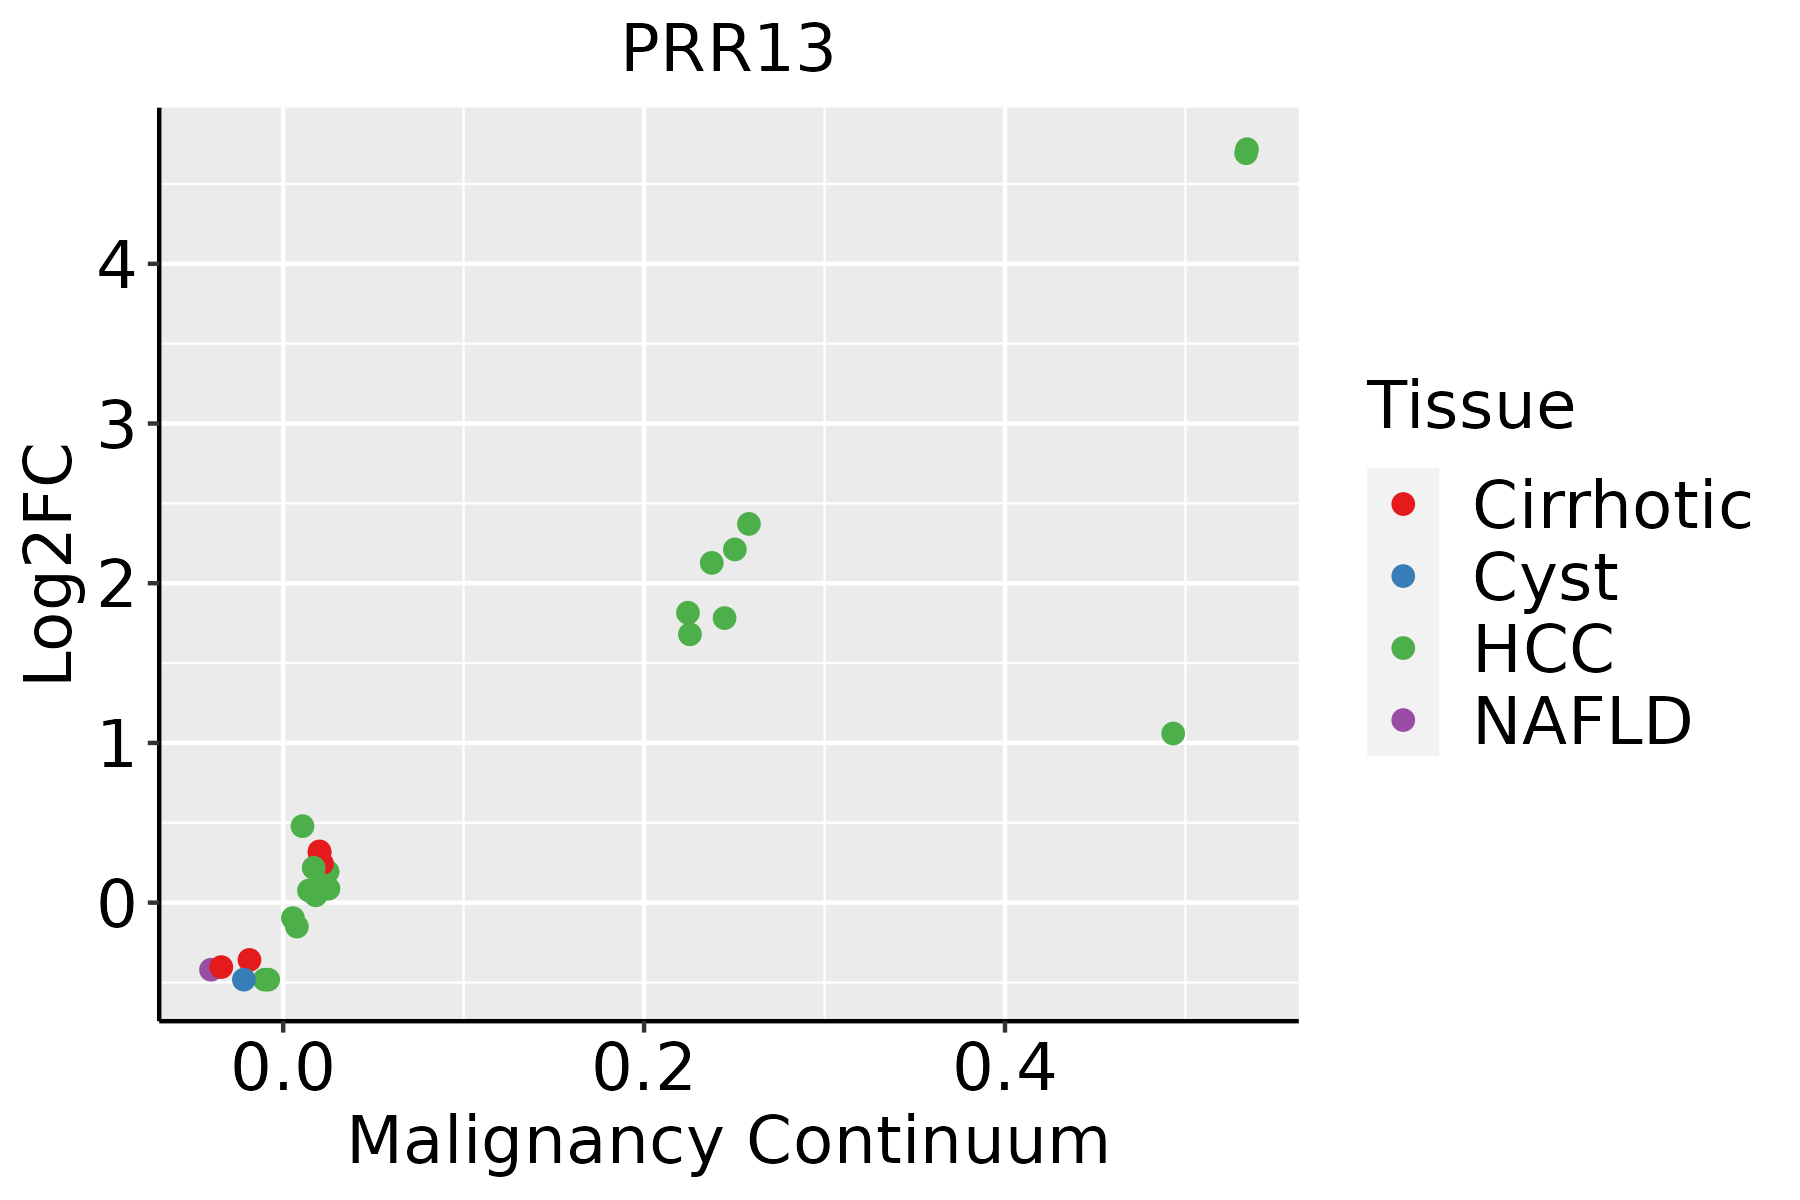 | HCC: Hepatocellular carcinoma |
| NAFLD: Non-alcoholic fatty liver disease | ||
| Oral Cavity |  | EOLP: Erosive Oral lichen planus |
| LP: leukoplakia | ||
| NEOLP: Non-erosive oral lichen planus | ||
| OSCC: Oral squamous cell carcinoma | ||
| Skin |  | AK: Actinic keratosis |
| cSCC: Cutaneous squamous cell carcinoma | ||
| SCCIS:squamous cell carcinoma in situ | ||
| Thyroid | 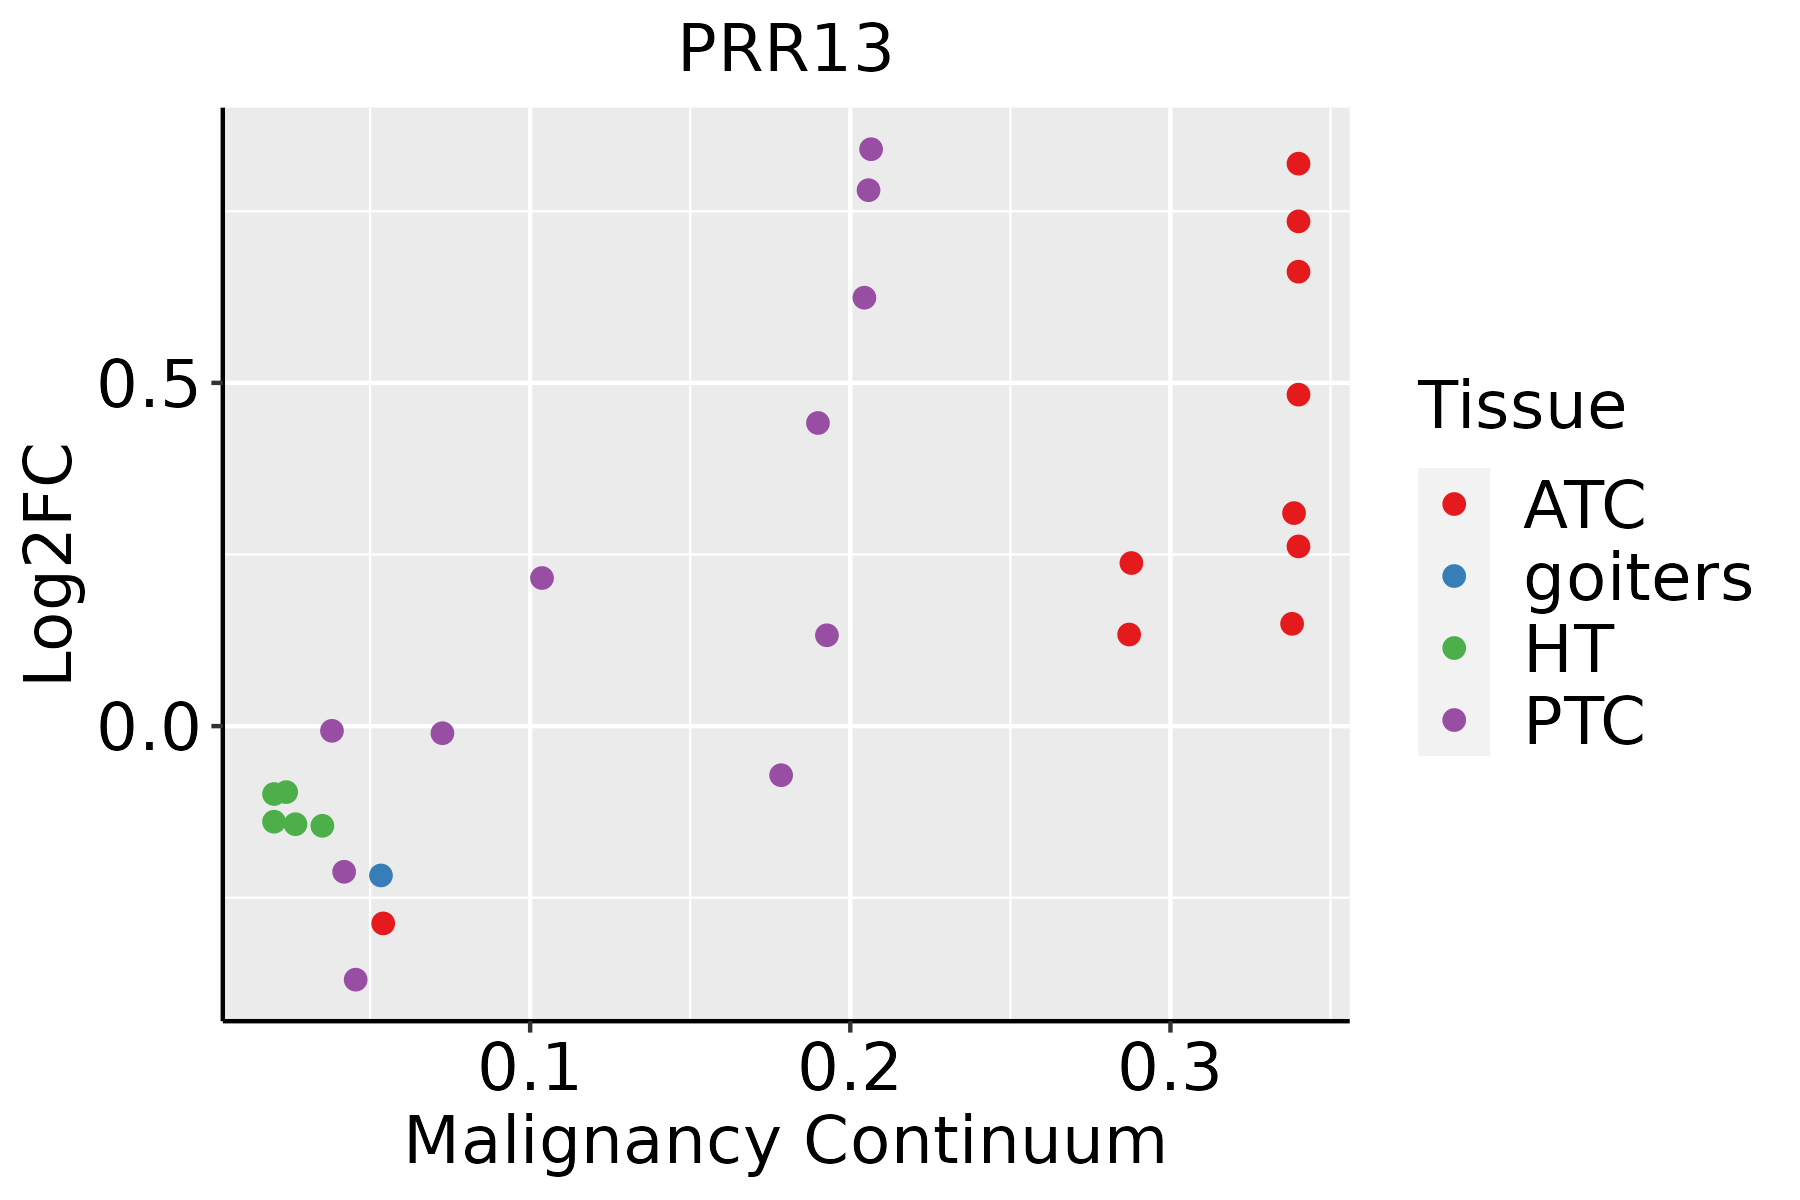 | ATC: Anaplastic thyroid cancer |
| HT: Hashimoto's thyroiditis | ||
| PTC: Papillary thyroid cancer |
| ∗log2FC in expression of this searched gene in stem-like cells from each diseased tissue sample relative to stem-like cells in normal samples in each tissue plotted against the malignancy continuum. Samples are colored based on if they are from different disease stage. |
Top |
Malignant transformation related pathway analysis |
| Find out the enriched GO biological processes and KEGG pathways involved in transition from healthy to precancer to cancer |
| Tissue | Disease Stage | Enriched GO biological Processes |
| Colorectum | AD |  |
| Colorectum | SER |  |
| Colorectum | MSS |  |
| Colorectum | MSI-H |  |
| Colorectum | FAP |  |
| ∗Top 15 enriched GO BP terms are showed in the bar plot of each disease state in each tissue. Each row represents a significant GO biological process which is colored according to the -log10(p.adjust). |
| Page: 1 2 3 4 5 6 7 8 9 |
| GO ID | Tissue | Disease Stage | Description | Gene Ratio | Bg Ratio | pvalue | p.adjust | Count |
| Page: 1 |
| Pathway ID | Tissue | Disease Stage | Description | Gene Ratio | Bg Ratio | pvalue | p.adjust | qvalue | Count |
| Page: 1 |
Top |
Cell-cell communication analysis |
| Identification of potential cell-cell interactions between two cell types and their ligand-receptor pairs for different disease states |
| Ligand | Receptor | LRpair | Pathway | Tissue | Disease Stage |
| Page: 1 |
Top |
Single-cell gene regulatory network inference analysis |
| Find out the significant the regulons (TFs) and the target genes of each regulon across cell types for different disease states |
| TF | Cell Type | Tissue | Disease Stage | Target Gene | RSS | Regulon Activity |
| ∗The dot plots of a searched regulon are shown for all cell subpopulations in each disease state of each tissue based on the regulon specific score inferred using pySCENIC and by calculating the average expression. |
| Page: 1 |
Top |
Somatic mutation of malignant transformation related genes |
| Annotation of somatic variants for genes involved in malignant transformation |
| Hugo Symbol | Variant Class | Variant Classification | dbSNP RS | HGVSc | HGVSp | HGVSp Short | SWISSPROT | BIOTYPE | SIFT | PolyPhen | Tumor Sample Barcode | Tissue | Histology | Sex | Age | Stage | Therapy Types | Drugs | Outcome |
| PRR13 | SNV | Missense_Mutation | c.428N>T | p.Ser143Phe | p.S143F | Q9NZ81 | protein_coding | tolerated_low_confidence(0.72) | probably_damaging(0.997) | TCGA-LP-A4AV-01 | Cervix | cervical & endocervical cancer | Female | <65 | I/II | Unknown | Unknown | SD | |
| PRR13 | SNV | Missense_Mutation | novel | c.149G>T | p.Gly50Val | p.G50V | Q9NZ81 | protein_coding | deleterious_low_confidence(0.03) | possibly_damaging(0.833) | TCGA-A5-A1OF-01 | Endometrium | uterine corpus endometrioid carcinoma | Female | <65 | I/II | Unknown | Unknown | SD |
| PRR13 | SNV | Missense_Mutation | novel | c.321G>T | p.Lys107Asn | p.K107N | Q9NZ81 | protein_coding | deleterious_low_confidence(0.01) | probably_damaging(0.998) | TCGA-AX-A2HC-01 | Endometrium | uterine corpus endometrioid carcinoma | Female | <65 | III/IV | Chemotherapy | paclitaxel | PD |
| PRR13 | SNV | Missense_Mutation | rs775012346 | c.248N>T | p.Pro83Leu | p.P83L | Q9NZ81 | protein_coding | deleterious_low_confidence(0.01) | probably_damaging(0.998) | TCGA-BG-A222-01 | Endometrium | uterine corpus endometrioid carcinoma | Female | <65 | I/II | Unknown | Unknown | SD |
| Page: 1 |
Top |
Related drugs of malignant transformation related genes |
| Identification of chemicals and drugs interact with genes involved in malignant transfromation |
| (DGIdb 4.0) |
| Entrez ID | Symbol | Category | Interaction Types | Drug Claim Name | Drug Name | PMIDs |
| Page: 1 |

Copyright 2023-Present -The University of Texas Health Science Center at Houston |