Schematic overview of the cellular and molecular mechanisms involved in the cancer progression, including the proposed cellular and molecular mechanisms in cancer cells trajectory. AT1: alveolar type 1 cells; AT2: alveolar type 2 cells; AAH: atypical adenomatous hyperplasia; AIS: adenocarcinoma in situ; MIA: minimally invasive adenocarcinoma; IA: invasive adenocarcinoma; EMT: epithelial-mesenchymal transition

Home

Download

Statistics

Help

Contact

Center for Computational Systems Medicine
leaf

Gene summary

leaf

Malignant transformation analysis

leaf

Malignant transformation related pathway analysis

leaf

Cell-cell communication analysis

leaf

Single-cell gene regulatory network inference analysis

leaf

Somatic mutation of malignant transformation related genes

leaf

Related drugs of malignant transformation related genes

Gene: POGZ

Gene summary for POGZ

check button Gene summary.

Gene informationSpeciesHuman
Gene symbol

POGZ

Gene ID

23126

Gene namepogo transposable element derived with ZNF domain
Gene AliasMRD37
Cytomap1q21.3
Gene Typeprotein-coding
GO ID

GO:0000070

UniProtAcc

Q7Z3K3


Top

Malignant transformation analysis

check button Identification of the aberrant gene expression in precancerous and cancerous lesions by comparing the gene expression of stem-like cells in diseased tissues with normal stem cells
check button Malignant transformation involving gene list.
Entrez IDSymbolReplicatesSpeciesOrganTissueAdj P-valueLog2FCMalignancy
23126POGZHCC2_MengHumanLiverHCC8.62e-34-3.31e-020.0107
23126POGZcirrhotic1HumanLiverCirrhotic2.07e-02-7.81e-020.0202
23126POGZHCC1HumanLiverHCC4.31e-033.53e+000.5336
23126POGZHCC2HumanLiverHCC1.17e-064.03e+000.5341
23126POGZPt13.aHumanLiverHCC2.99e-02-2.23e-010.021
23126POGZPt13.bHumanLiverHCC1.89e-09-3.98e-020.0251
23126POGZPt13.cHumanLiverHCC6.94e-03-3.19e-010.0076
23126POGZPt14.aHumanLiverHCC2.37e-041.53e-010.0169
23126POGZS014HumanLiverHCC1.52e-034.86e-010.2254
23126POGZS015HumanLiverHCC3.55e-024.55e-010.2375
23126POGZS016HumanLiverHCC1.29e-024.44e-010.2243
23126POGZS028HumanLiverHCC1.40e-098.07e-010.2503
23126POGZS029HumanLiverHCC4.32e-045.84e-010.2581
23126POGZTD9HumanLungIAC4.93e-036.01e-010.088
23126POGZRNA-P17T-P17T-4HumanLungIAC1.27e-024.46e-010.343
23126POGZRNA-P17T-P17T-6HumanLungIAC1.39e-024.54e-010.3385
23126POGZRNA-P25T1-P25T1-1HumanLungAIS3.32e-064.89e-01-0.2116
23126POGZRNA-P25T1-P25T1-4HumanLungAIS5.27e-043.50e-01-0.2119
23126POGZRNA-P6T1-P6T1-3HumanLungMIAC7.42e-049.72e-01-0.0296
23126POGZRNA-P6T1-P6T1-4HumanLungMIAC1.20e-071.06e+00-0.0263
Page: 1 2 3 4 5 6 7 8 9 

check button Transcriptomic changes along malignancy continuum.
TissueExpression DynamicsAbbreviation
CervixThe image shows the transcriptomic changes along malignancy continuum.log2FC in expression of this searched gene in stem-like cells from each diseased tissue sample relative to stem-like cells in normal samples in each tissue plotted against the malignancy continuum. Samples are colored based on if they are from different disease stage.CC: Cervix cancer
HSIL_HPV: HPV-infected high-grade squamous intraepithelial lesions
N_HPV: HPV-infected normal cervix
Colorectum (GSE201348)The image shows the transcriptomic changes along malignancy continuum.log2FC in expression of this searched gene in stem-like cells from each diseased tissue sample relative to stem-like cells in normal samples in each tissue plotted against the malignancy continuum. Samples are colored based on if they are from different disease stage.FAP: Familial adenomatous polyposis
CRC: Colorectal cancer
Colorectum (HTA11)The image shows the transcriptomic changes along malignancy continuum.log2FC in expression of this searched gene in stem-like cells from each diseased tissue sample relative to stem-like cells in normal samples in each tissue plotted against the malignancy continuum. Samples are colored based on if they are from different disease stage.AD: Adenomas
SER: Sessile serrated lesions
MSI-H: Microsatellite-high colorectal cancer
MSS: Microsatellite stable colorectal cancer
EsophagusThe image shows the transcriptomic changes along malignancy continuum.log2FC in expression of this searched gene in stem-like cells from each diseased tissue sample relative to stem-like cells in normal samples in each tissue plotted against the malignancy continuum. Samples are colored based on if they are from different disease stage.
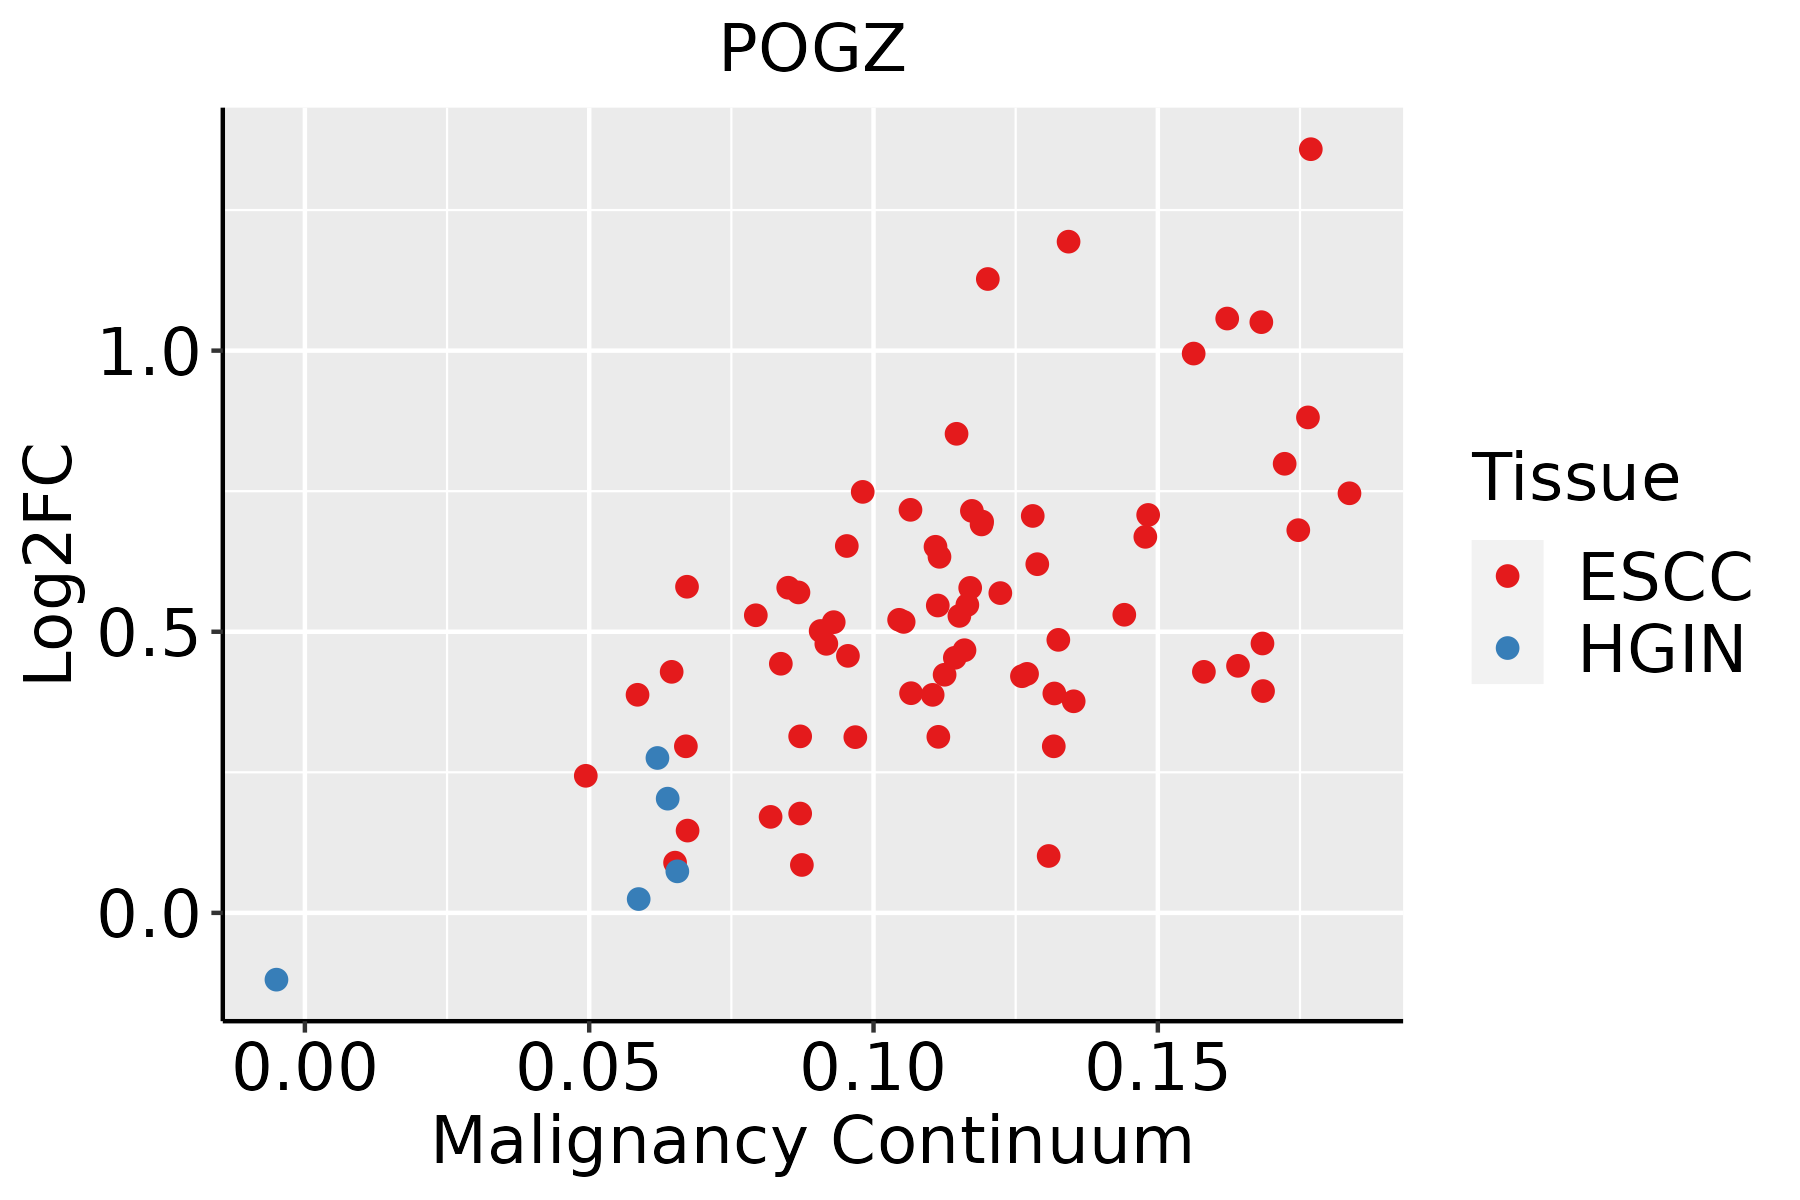
ESCC: Esophageal squamous cell carcinoma
HGIN: High-grade intraepithelial neoplasias
LGIN: Low-grade intraepithelial neoplasias
LiverThe image shows the transcriptomic changes along malignancy continuum.log2FC in expression of this searched gene in stem-like cells from each diseased tissue sample relative to stem-like cells in normal samples in each tissue plotted against the malignancy continuum. Samples are colored based on if they are from different disease stage.
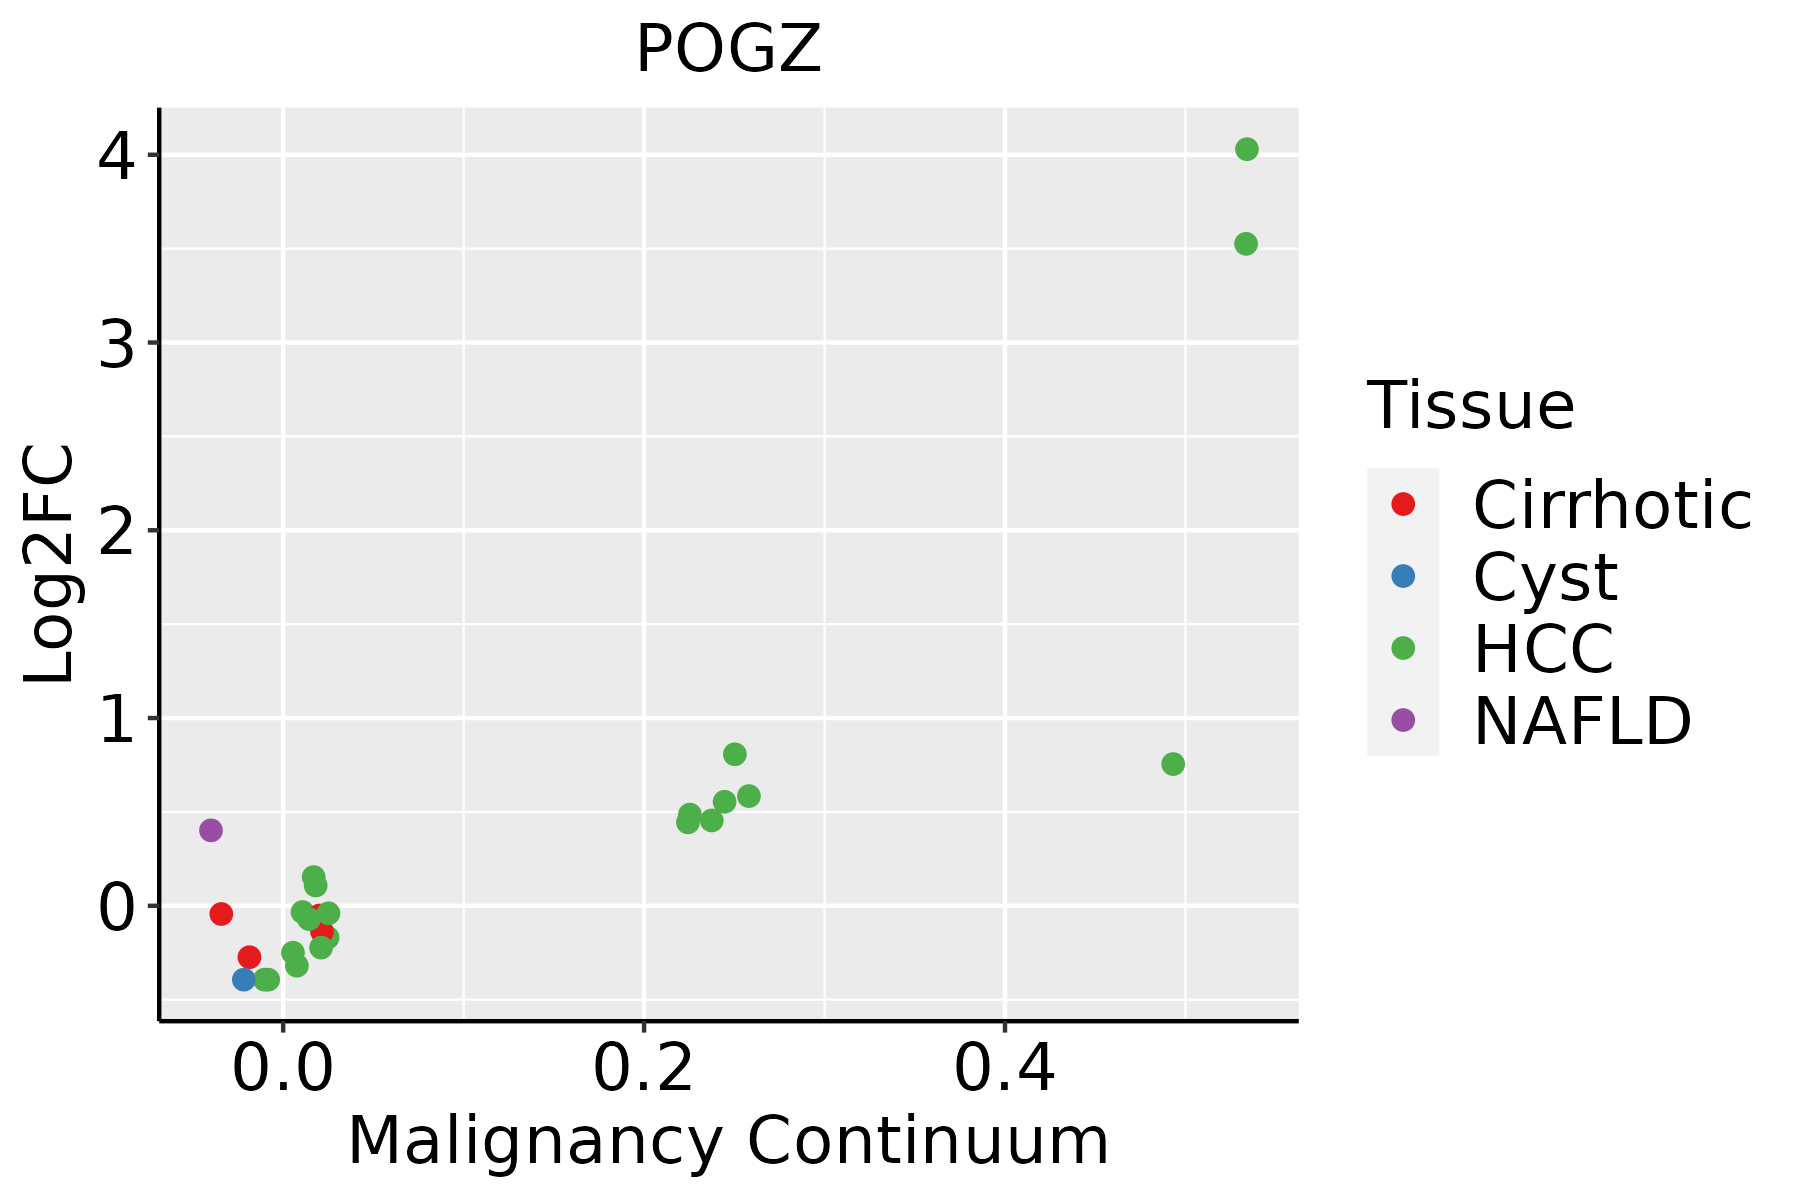
HCC: Hepatocellular carcinoma
NAFLD: Non-alcoholic fatty liver disease
LungThe image shows the transcriptomic changes along malignancy continuum.log2FC in expression of this searched gene in stem-like cells from each diseased tissue sample relative to stem-like cells in normal samples in each tissue plotted against the malignancy continuum. Samples are colored based on if they are from different disease stage.
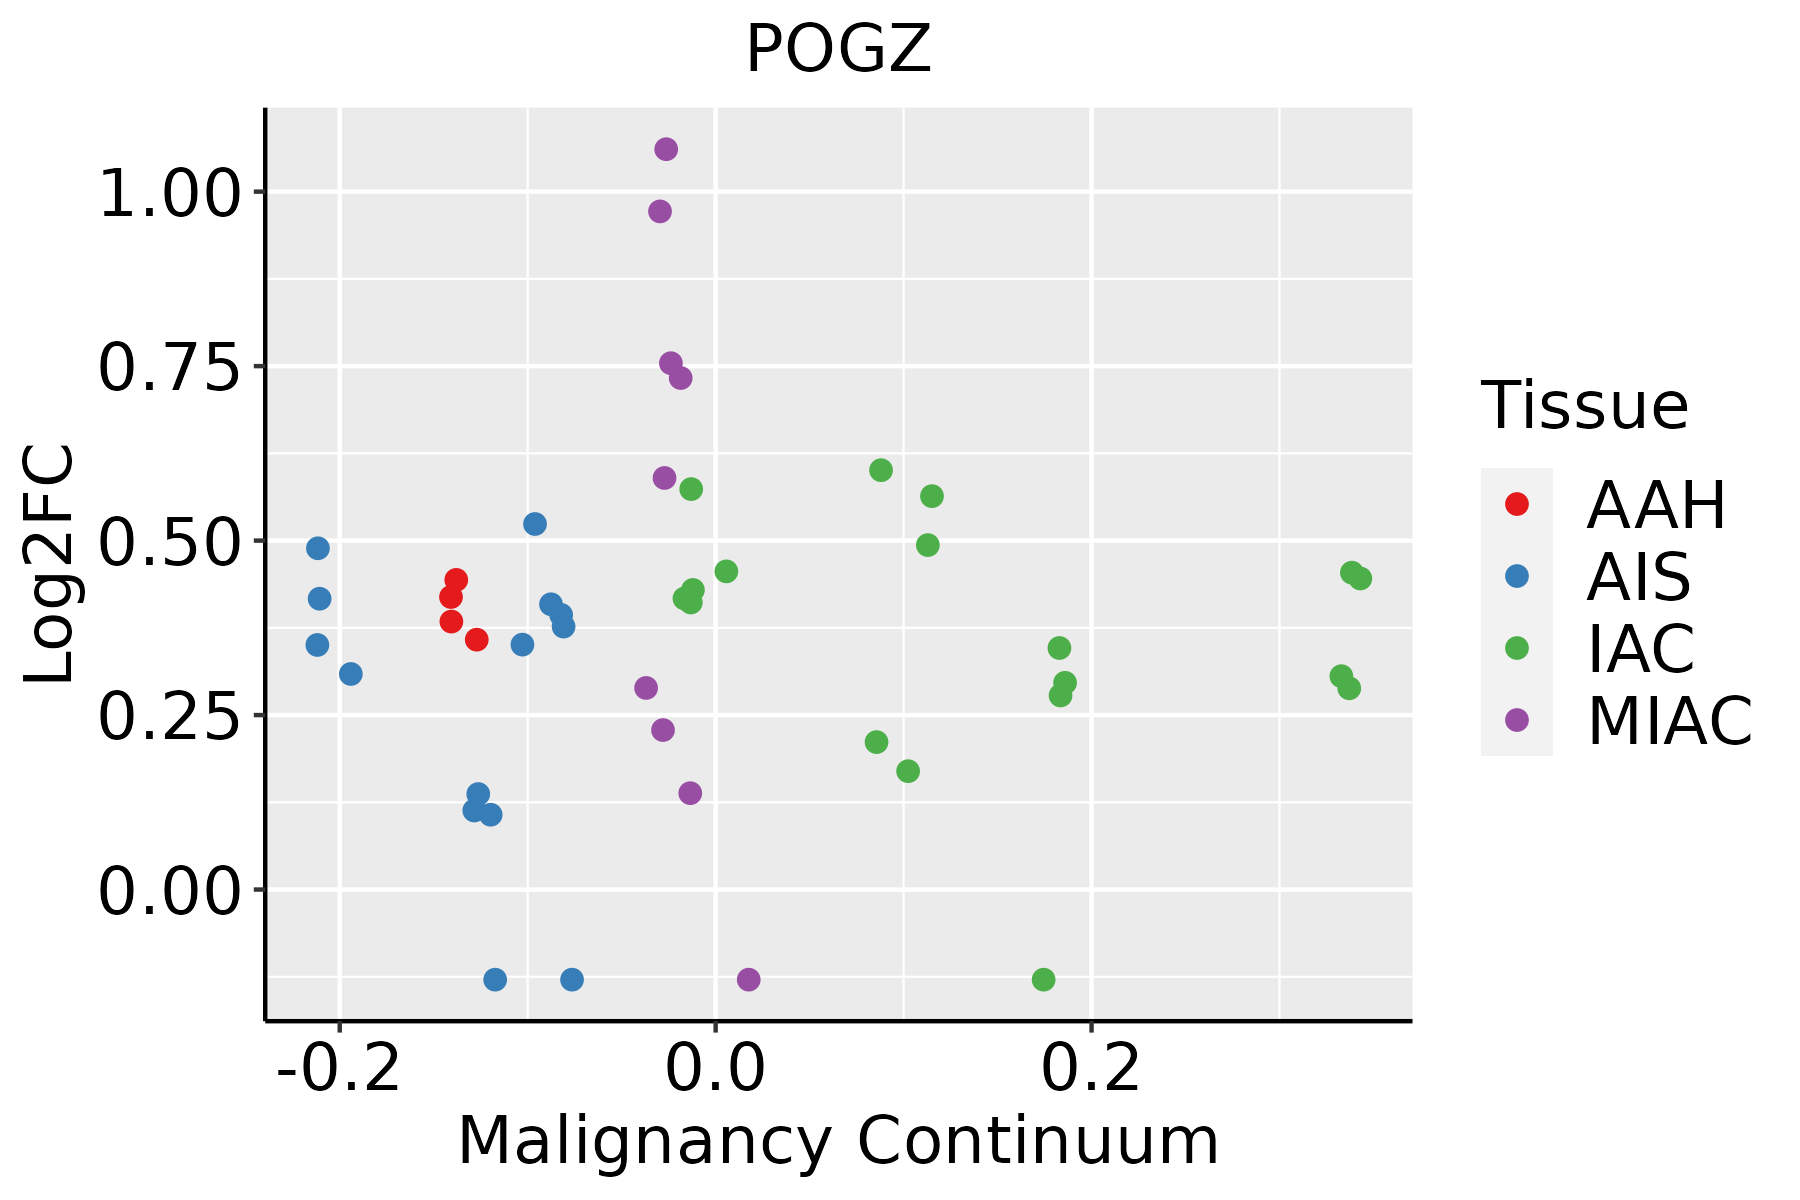
AAH: Atypical adenomatous hyperplasia
AIS: Adenocarcinoma in situ
IAC: Invasive lung adenocarcinoma
MIA: Minimally invasive adenocarcinoma
Oral CavityThe image shows the transcriptomic changes along malignancy continuum.log2FC in expression of this searched gene in stem-like cells from each diseased tissue sample relative to stem-like cells in normal samples in each tissue plotted against the malignancy continuum. Samples are colored based on if they are from different disease stage.
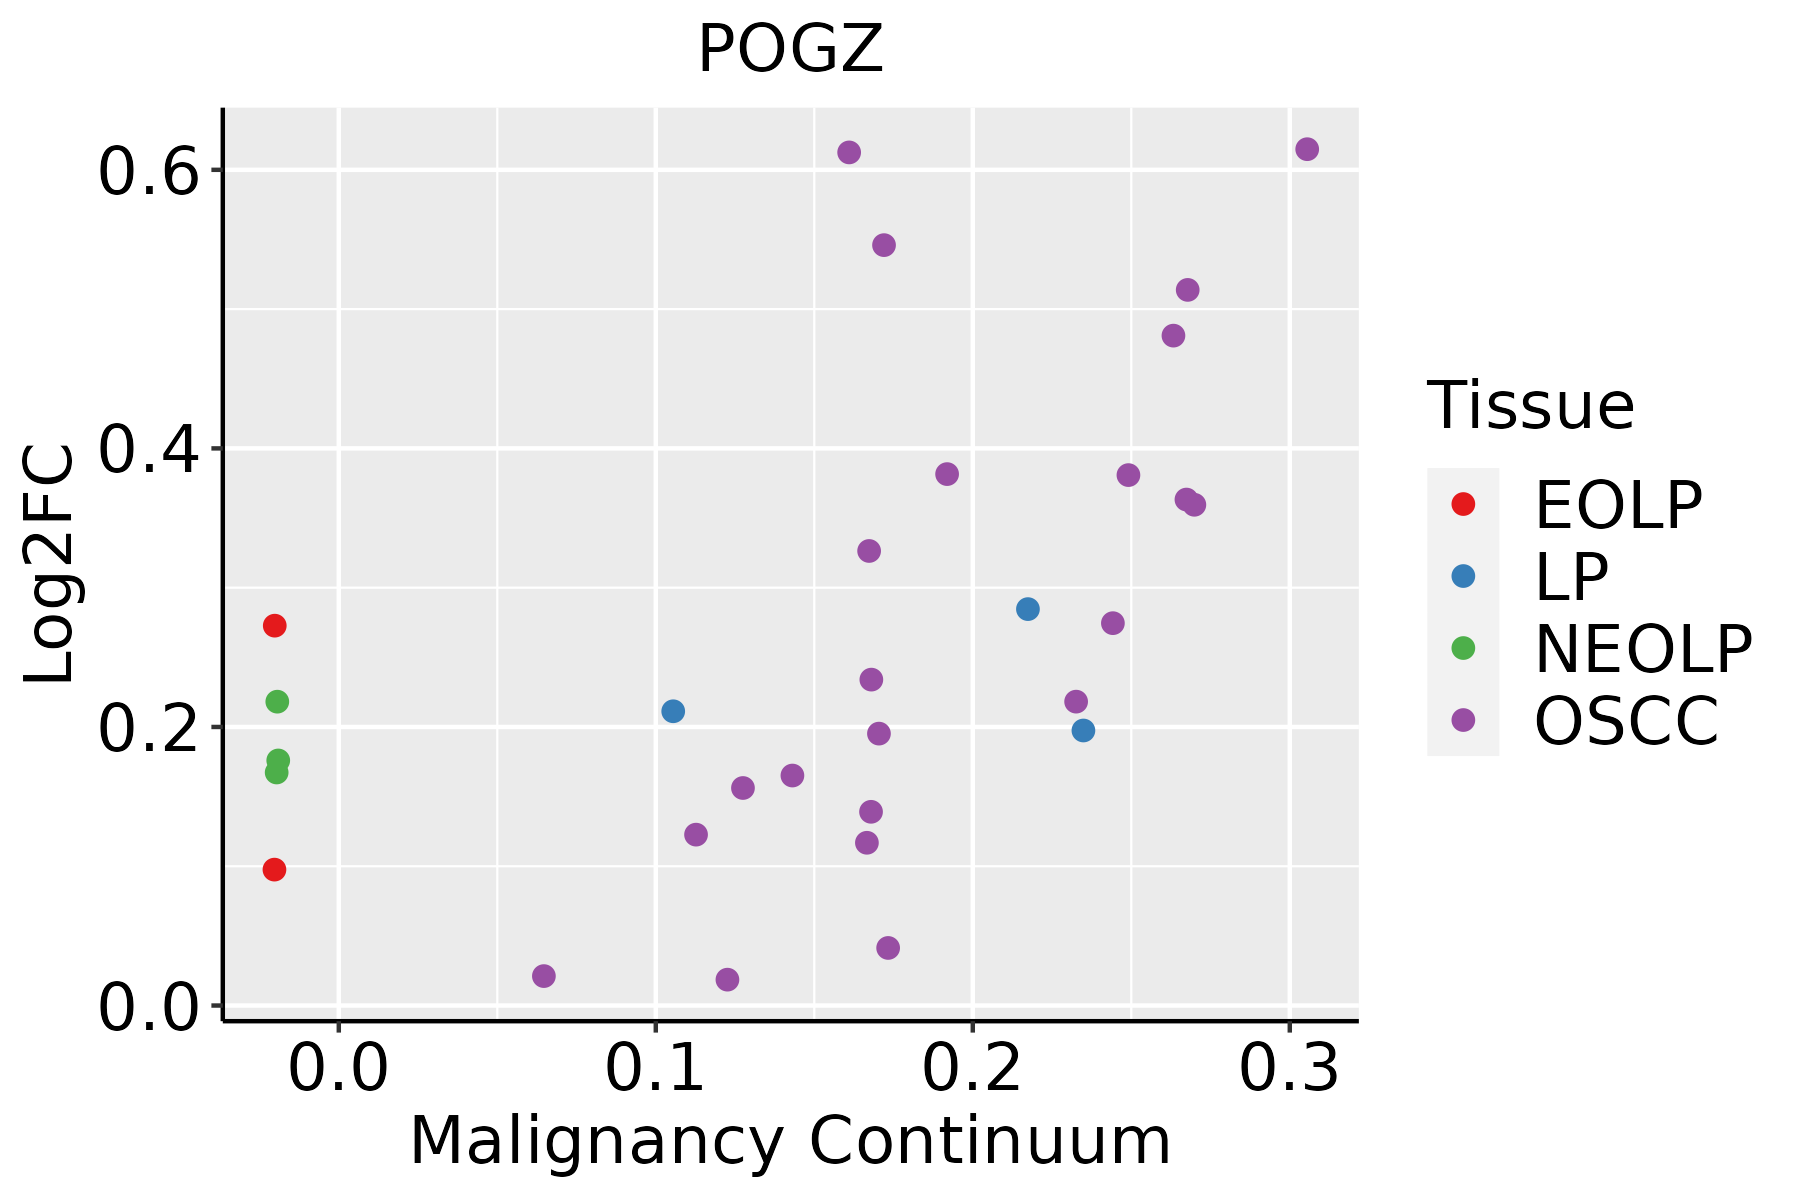
EOLP: Erosive Oral lichen planus
LP: leukoplakia
NEOLP: Non-erosive oral lichen planus
OSCC: Oral squamous cell carcinoma
ThyroidThe image shows the transcriptomic changes along malignancy continuum.log2FC in expression of this searched gene in stem-like cells from each diseased tissue sample relative to stem-like cells in normal samples in each tissue plotted against the malignancy continuum. Samples are colored based on if they are from different disease stage.ATC: Anaplastic thyroid cancer
HT: Hashimoto's thyroiditis
PTC: Papillary thyroid cancer
∗log2FC in expression of this searched gene in stem-like cells from each diseased tissue sample relative to stem-like cells in normal samples in each tissue plotted against the malignancy continuum. Samples are colored based on if they are from different disease stage.

Top

Malignant transformation related pathway analysis

check buttonFind out the enriched GO biological processes and KEGG pathways involved in transition from healthy to precancer to cancer
check button Figure of enriched GO biological processes.
TissueDisease StageEnriched GO biological Processes
ColorectumADGO analysis - Figure of enriched GO biological processes: Top 15 enriched GO BP terms are showed in the bar plot of each disease state in each tissue. Each row represents a significant GO biological process which is colored according to the -log10(p.adjust).
ColorectumSERGO analysis - Figure of enriched GO biological processes: Top 15 enriched GO BP terms are showed in the bar plot of each disease state in each tissue. Each row represents a significant GO biological process which is colored according to the -log10(p.adjust).
ColorectumMSSGO analysis - Figure of enriched GO biological processes: Top 15 enriched GO BP terms are showed in the bar plot of each disease state in each tissue. Each row represents a significant GO biological process which is colored according to the -log10(p.adjust).
ColorectumMSI-HGO analysis - Figure of enriched GO biological processes: Top 15 enriched GO BP terms are showed in the bar plot of each disease state in each tissue. Each row represents a significant GO biological process which is colored according to the -log10(p.adjust).
ColorectumFAPGO analysis - Figure of enriched GO biological processes: Top 15 enriched GO BP terms are showed in the bar plot of each disease state in each tissue. Each row represents a significant GO biological process which is colored according to the -log10(p.adjust).
∗Top 15 enriched GO BP terms are showed in the bar plot of each disease state in each tissue. Each row represents a significant GO biological process which is colored according to the -log10(p.adjust).
Page: 1 2 3 4 5 6 7 8 9 

check button Enriched GO biological processes.
GO IDTissueDisease StageDescriptionGene RatioBg Ratiopvaluep.adjustCount
GO:00070646CervixCCmitotic sister chromatid cohesion12/231128/187235.47e-058.06e-0412
GO:01400143CervixCCmitotic nuclear division50/2311287/187237.27e-033.91e-0250
GO:00070625CervixCCsister chromatid cohesion15/231162/187237.30e-033.92e-0215
GO:00482851CervixCCorganelle fission78/2311488/187239.70e-034.79e-0278
GO:0007064ColorectumADmitotic sister chromatid cohesion13/391828/187232.22e-031.75e-0213
GO:0007062ColorectumADsister chromatid cohesion23/391862/187232.51e-031.92e-0223
GO:0140014ColorectumADmitotic nuclear division78/3918287/187236.48e-034.05e-0278
GO:00070621ColorectumMSSsister chromatid cohesion20/346762/187236.63e-034.38e-0220
GO:01400141ColorectumMSSmitotic nuclear division70/3467287/187237.48e-034.72e-0270
GO:00070641ColorectumMSSmitotic sister chromatid cohesion11/346728/187238.30e-035.00e-0211
GO:00070642ColorectumFAPmitotic sister chromatid cohesion11/262228/187238.55e-048.79e-0311
GO:00070622ColorectumFAPsister chromatid cohesion18/262262/187231.60e-031.42e-0218
GO:00070623ColorectumCRCsister chromatid cohesion16/207862/187239.40e-041.15e-0216
GO:00070643ColorectumCRCmitotic sister chromatid cohesion9/207828/187232.43e-032.30e-029
GO:01400146EsophagusHGINmitotic nuclear division61/2587287/187233.38e-045.55e-0361
GO:00070593EsophagusHGINchromosome segregation71/2587346/187233.47e-045.62e-0371
GO:00000703EsophagusHGINmitotic sister chromatid segregation36/2587168/187234.42e-033.87e-0236
GO:014001414EsophagusESCCmitotic nuclear division218/8552287/187236.17e-261.78e-23218
GO:000007011EsophagusESCCmitotic sister chromatid segregation138/8552168/187231.37e-222.63e-20138
GO:00008194EsophagusESCCsister chromatid segregation157/8552202/187238.41e-211.33e-18157
Page: 1 2 3 4 5 

check button Enriched KEGG pathways.
Pathway IDTissueDisease StageDescriptionGene RatioBg Ratiopvaluep.adjustqvalueCount
Page: 1 

Top

Cell-cell communication analysis

check buttonIdentification of potential cell-cell interactions between two cell types and their ligand-receptor pairs for different disease states
LigandReceptorLRpairPathwayTissueDisease Stage
Page: 1 

Top

Single-cell gene regulatory network inference analysis

check buttonFind out the significant the regulons (TFs) and the target genes of each regulon across cell types for different disease states
TFCell TypeTissueDisease StageTarget GeneRSSRegulon Activity
∗The dot plots of a searched regulon are shown for all cell subpopulations in each disease state of each tissue based on the regulon specific score inferred using pySCENIC and by calculating the average expression.
Page: 1 

Top

Somatic mutation of malignant transformation related genes

check buttonAnnotation of somatic variants for genes involved in malignant transformation
Hugo SymbolVariant ClassVariant ClassificationdbSNP RSHGVScHGVSpHGVSp ShortSWISSPROTBIOTYPESIFTPolyPhenTumor Sample BarcodeTissueHistologySexAgeStageTherapy TypesDrugsOutcome
POGZSNVMissense_Mutationnovelc.1545C>Ap.His515Glnp.H515QQ7Z3K3protein_codingdeleterious(0.01)possibly_damaging(0.624)TCGA-A7-A5ZX-01Breastbreast invasive carcinomaFemale<65III/IVChemotherapydoxorubicinCR
POGZSNVMissense_Mutationc.3695G>Ap.Arg1232Hisp.R1232HQ7Z3K3protein_codingtolerated(0.4)possibly_damaging(0.543)TCGA-AN-A046-01Breastbreast invasive carcinomaFemale>=65I/IIUnknownUnknownSD
POGZSNVMissense_Mutationc.3377A>Gp.Asp1126Glyp.D1126GQ7Z3K3protein_codingdeleterious(0)probably_damaging(0.999)TCGA-AN-A0FD-01Breastbreast invasive carcinomaFemale>=65I/IIUnknownUnknownSD
POGZSNVMissense_Mutationc.2235N>Cp.Met745Ilep.M745IQ7Z3K3protein_codingtolerated(0.12)benign(0.117)TCGA-AO-A0JC-01Breastbreast invasive carcinomaFemale<65I/IIChemotherapyfluorouracilSD
POGZSNVMissense_Mutationc.367C>Gp.Gln123Glup.Q123EQ7Z3K3protein_codingtolerated(0.17)benign(0.024)TCGA-BH-A0AV-01Breastbreast invasive carcinomaFemale<65I/IIChemotherapytaxotereCR
POGZSNVMissense_Mutationc.3926N>Cp.Leu1309Prop.L1309PQ7Z3K3protein_codingdeleterious(0)probably_damaging(0.942)TCGA-BH-A0BA-01Breastbreast invasive carcinomaFemale<65III/IVChemotherapycytoxanSD
POGZSNVMissense_Mutationnovelc.2116G>Ap.Asp706Asnp.D706NQ7Z3K3protein_codingtolerated(0.14)possibly_damaging(0.823)TCGA-C8-A3M7-01Breastbreast invasive carcinomaFemale<65III/IVUnknownUnknownPD
POGZSNVMissense_Mutationc.3225N>Gp.Phe1075Leup.F1075LQ7Z3K3protein_codingdeleterious(0)probably_damaging(0.989)TCGA-D8-A1JA-01Breastbreast invasive carcinomaFemale<65III/IVChemotherapyadriamycinPD
POGZSNVMissense_Mutationc.2423N>Gp.Asn808Serp.N808SQ7Z3K3protein_codingtolerated(0.59)benign(0.046)TCGA-D8-A27I-01Breastbreast invasive carcinomaFemale<65III/IVChemotherapyadrimycin+cyclophosphamideSD
POGZSNVMissense_Mutationnovelc.3881N>Tp.Ser1294Phep.S1294FQ7Z3K3protein_codingdeleterious(0.03)probably_damaging(0.972)TCGA-E2-A572-01Breastbreast invasive carcinomaFemale>=65III/IVChemotherapydoxorubicinSD
Page: 1 2 3 4 5 6 7 8 9 10 11 12 13 14 15 

Top

Related drugs of malignant transformation related genes

check buttonIdentification of chemicals and drugs interact with genes involved in malignant transfromation
(DGIdb 4.0)
Entrez IDSymbolCategoryInteraction TypesDrug Claim NameDrug NamePMIDs
Page: 1